Resource Utilization Overview
The Resource Utilization (RU) module tracks and stores data on CPU, memory, disk, and network usage, as well as power and environmental sensors. This page covers how to enable RU tracking, understand the data storage architecture, visualize trends, and use the RU API.
RU resource-usage metrics can fuel advanced business and capacity-planning decisions, migration planning, move-group selection (via Application Groups), and cloud-target rightsizing, as well as support a variety of other digital transformation projects.
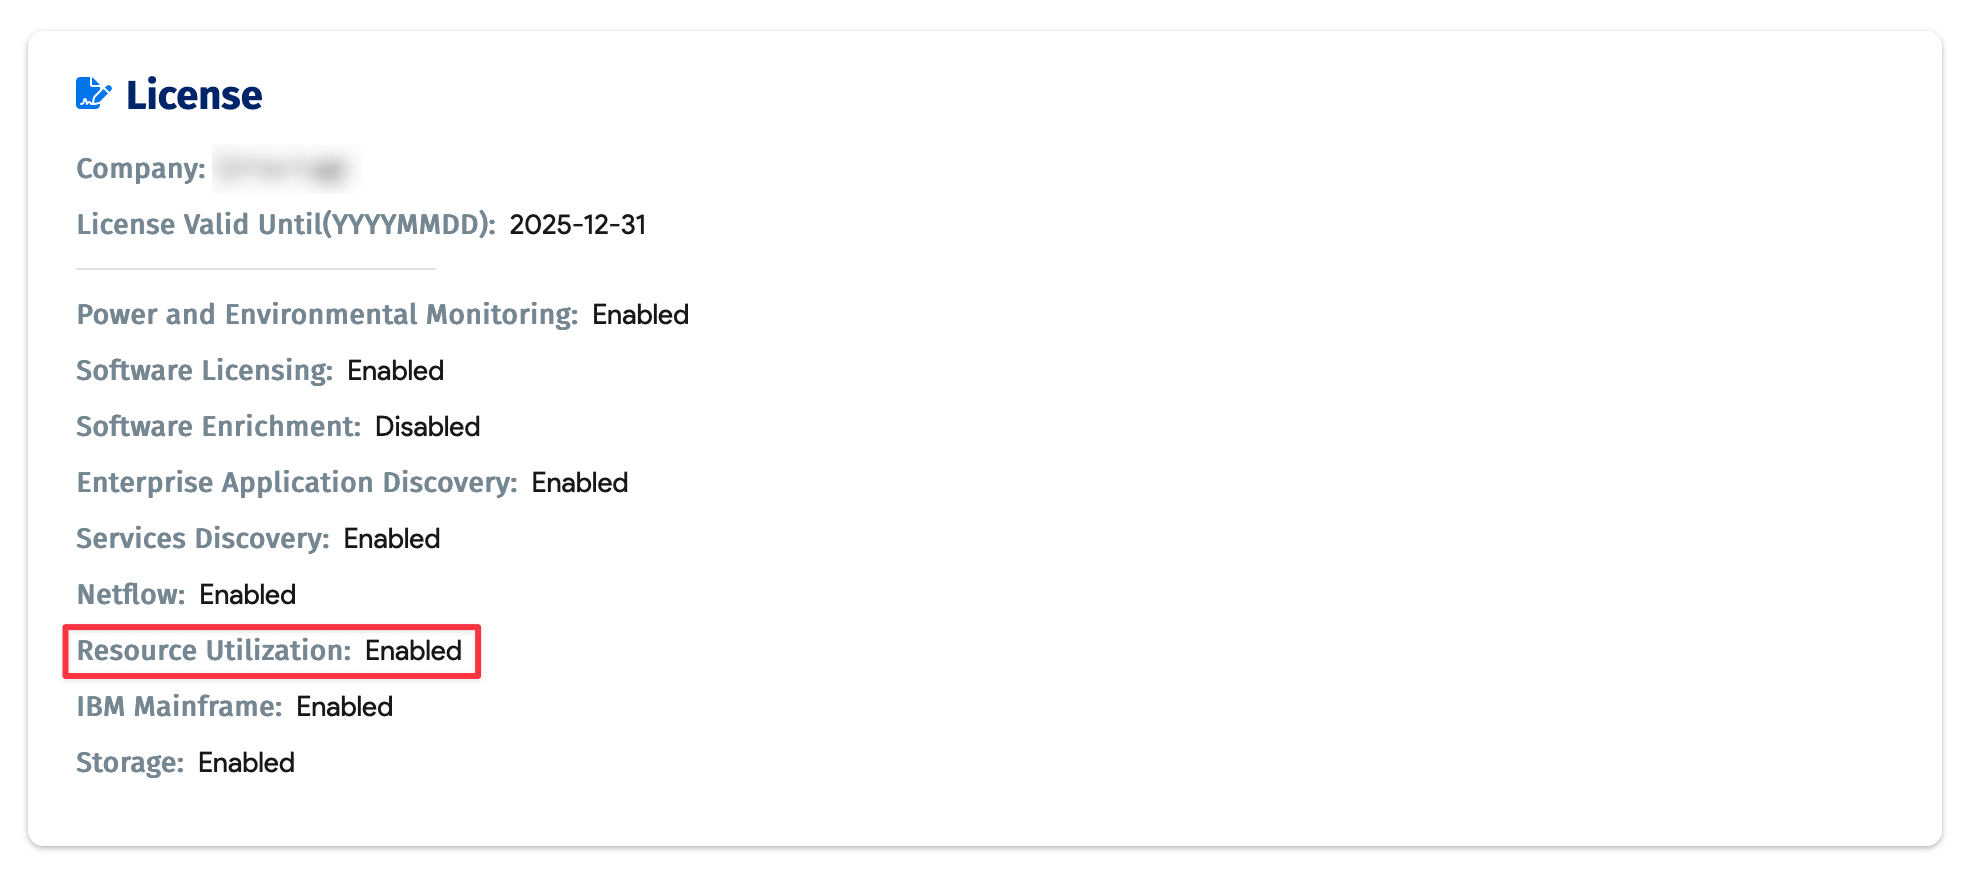
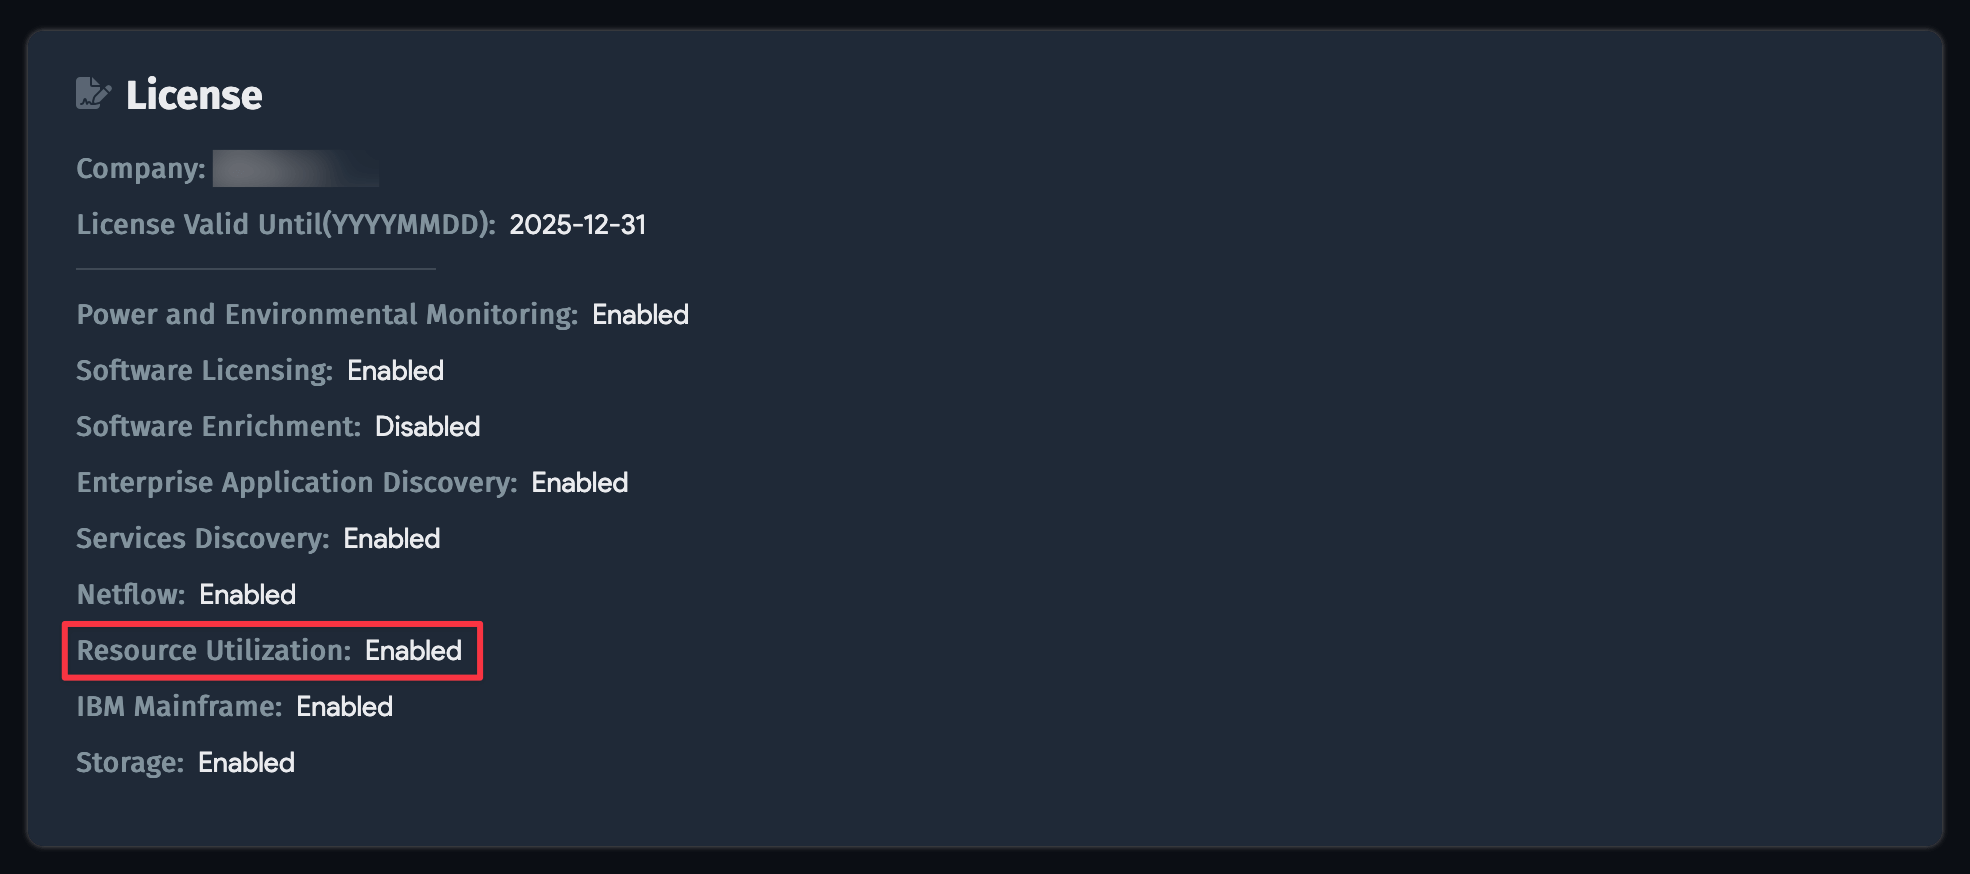
You need an RU license installed to use Device42's Resource Utilization features. See Licensing for more details.
Enable Resource Utilization
Enable RU tracking by checking Enable Resource Utilization Tracking for Device(s) on Hypervisor/*nix/Windows discovery jobs.
Select an interval from the Resource Utilization Sampling Interval dropdown. The default period is ten minutes (600 seconds). When RU tracking is enabled, you cannot save the discovery job unless an interval is specified.
If the checkbox is inactive or missing, the RU licensing module is likely disabled. Check your licensing settings under Tools > Settings > Licensing.
Enable Tracking on Devices
Discovered devices are tracked when Enable Resource Utilization Tracking for Device(s) is checked on the discovery job when the job runs. If the option was unselected when the job ran, enable it and the job will bring in data the next time it runs.
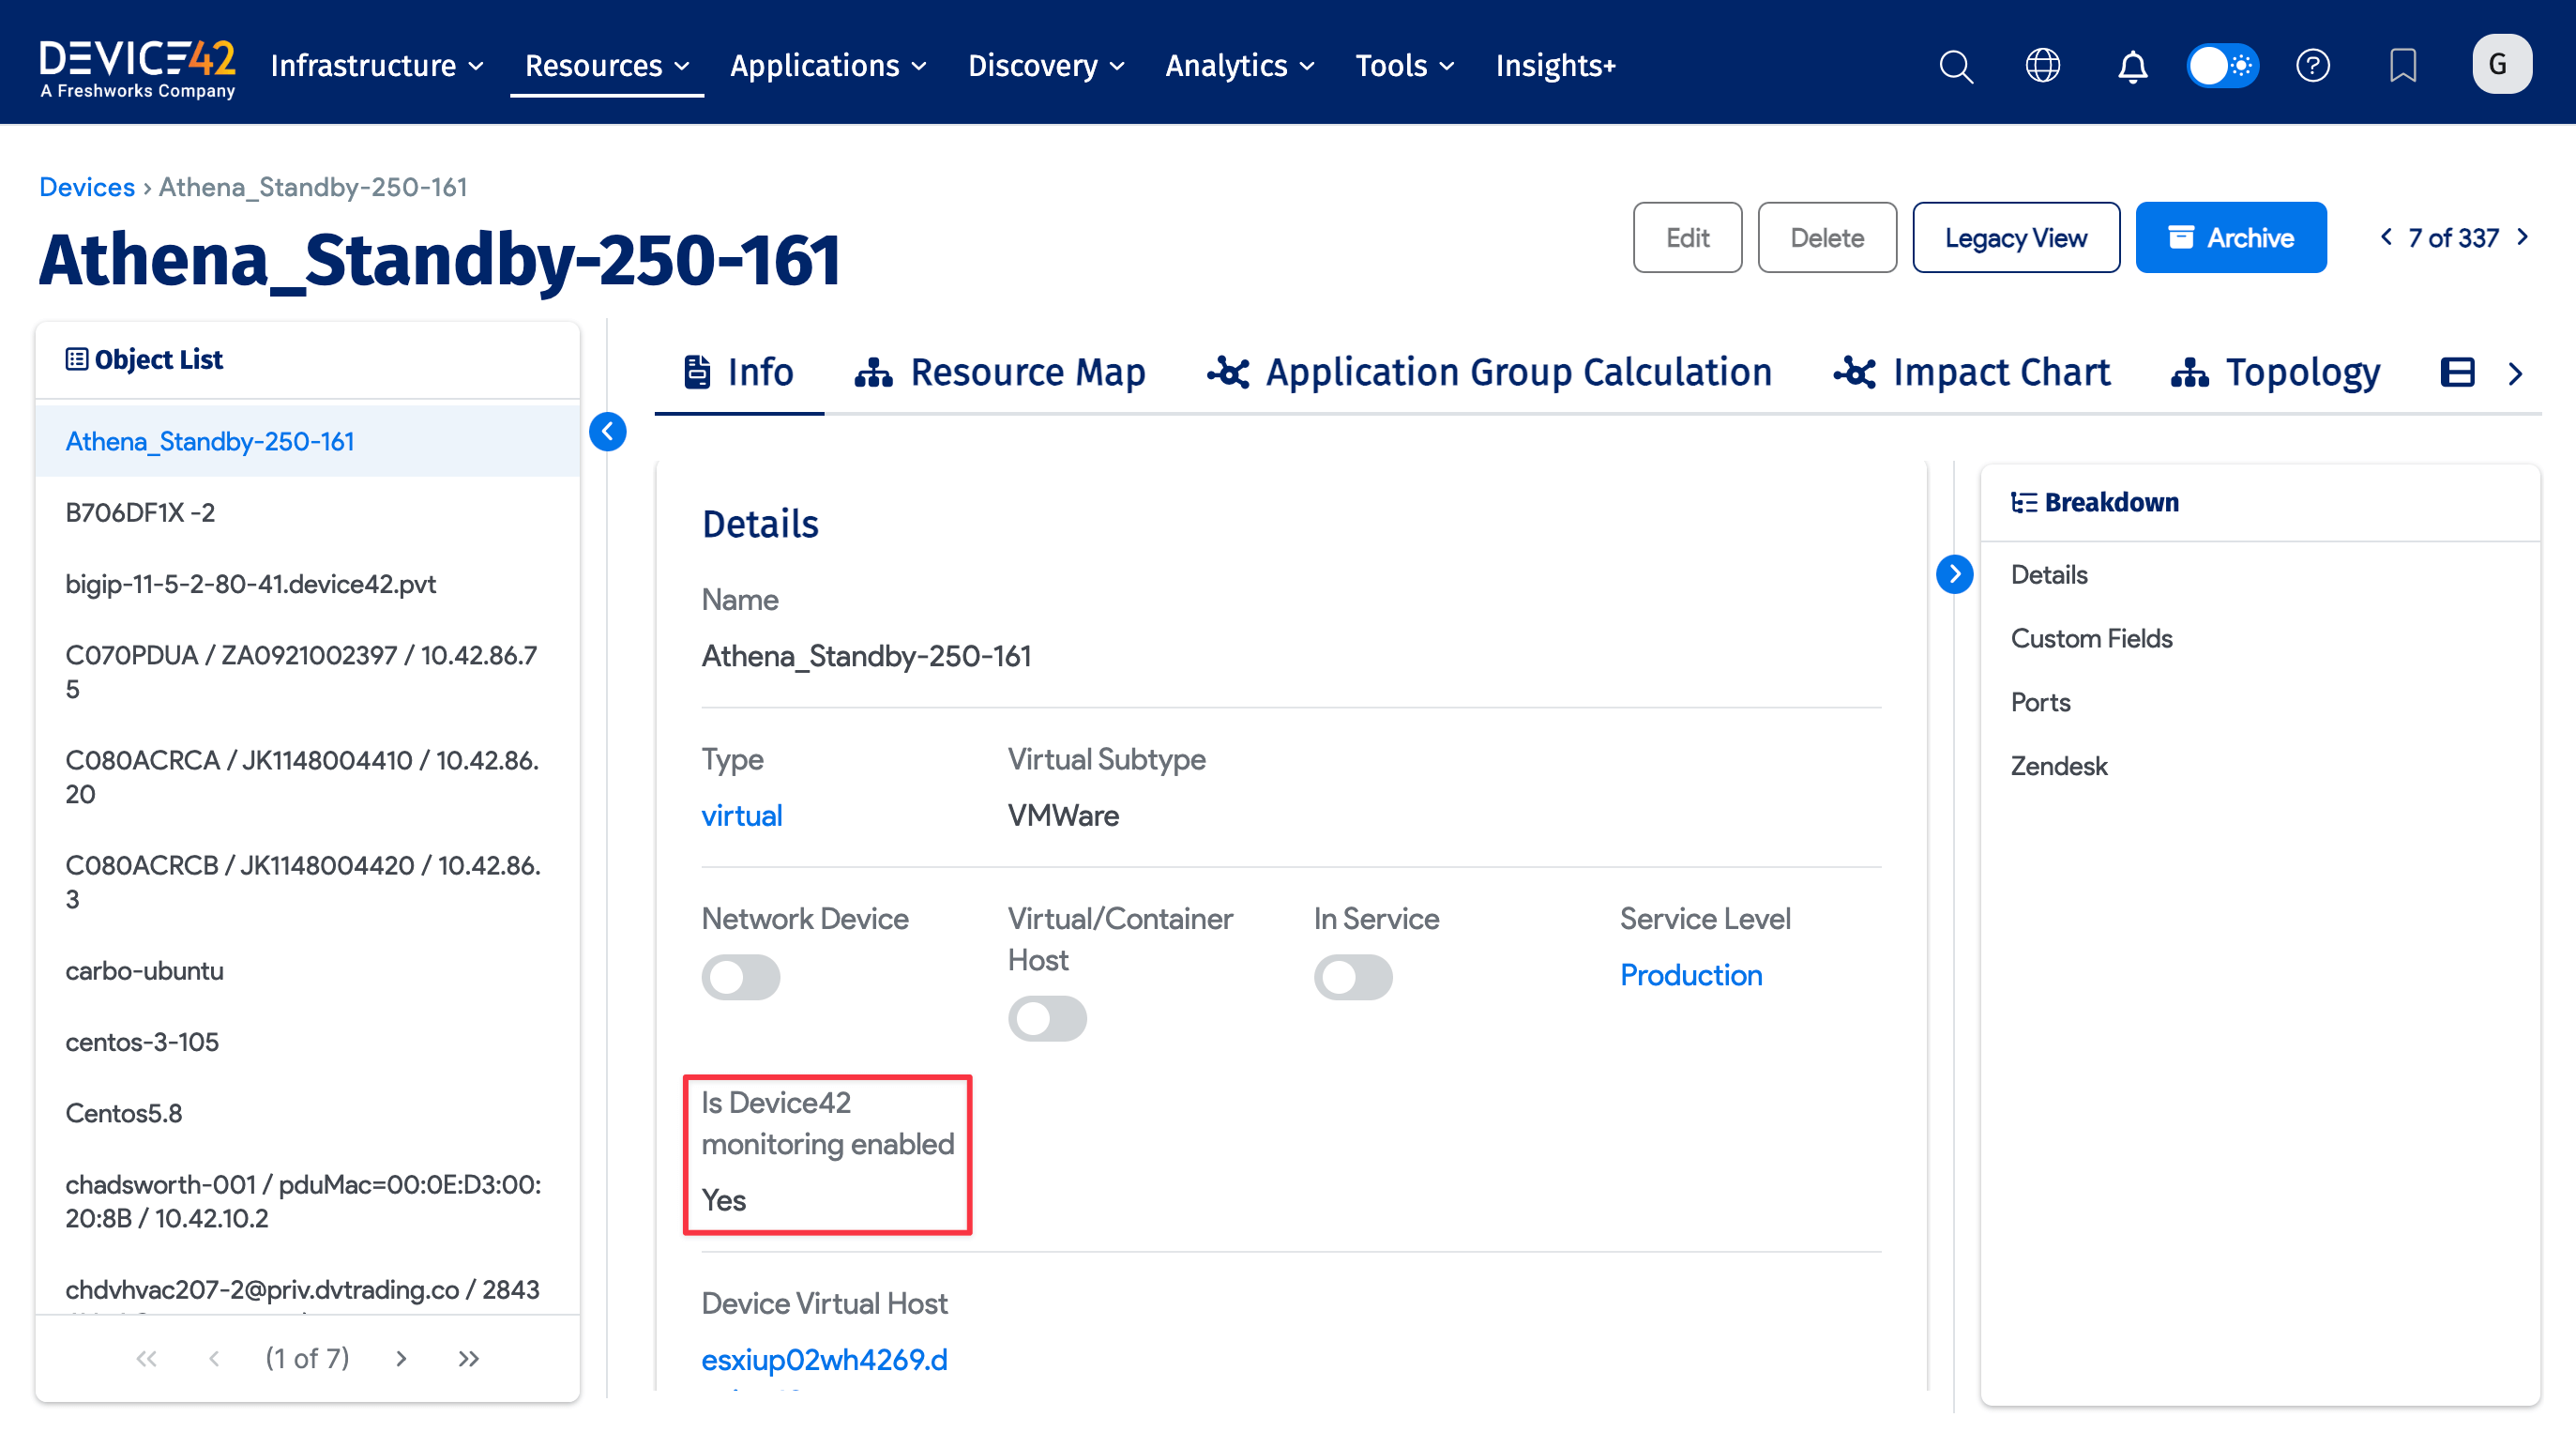
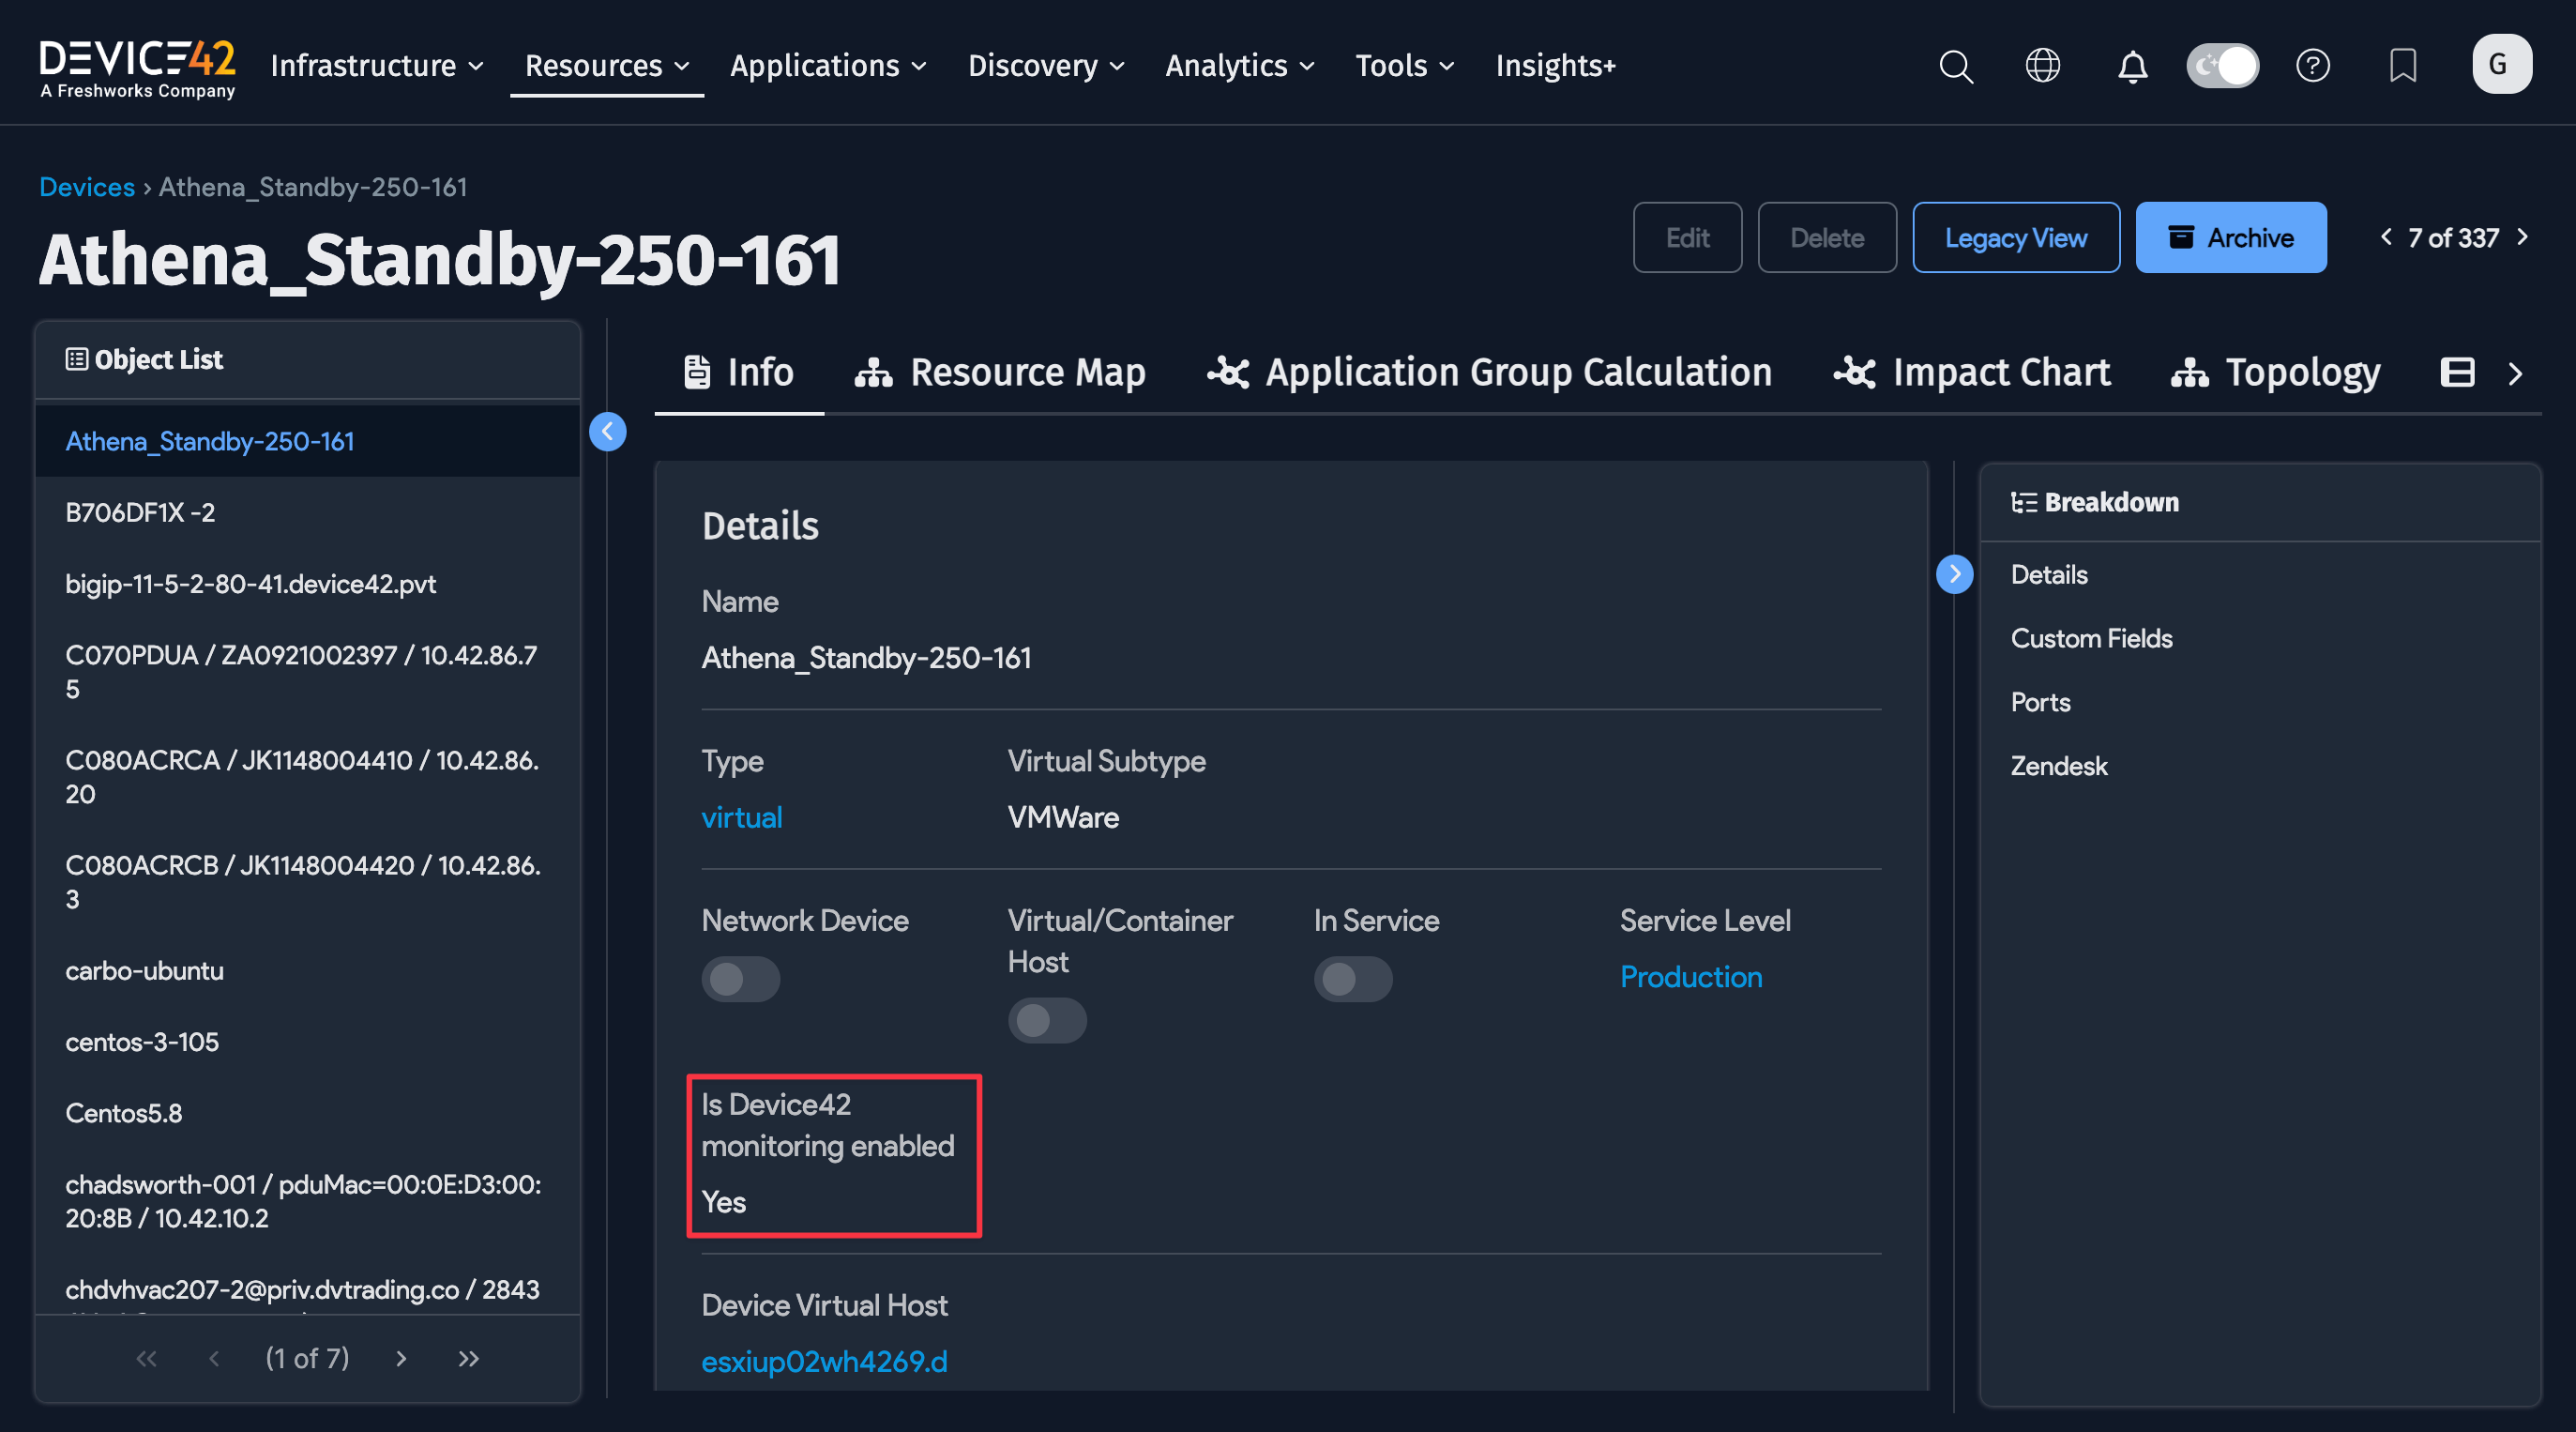
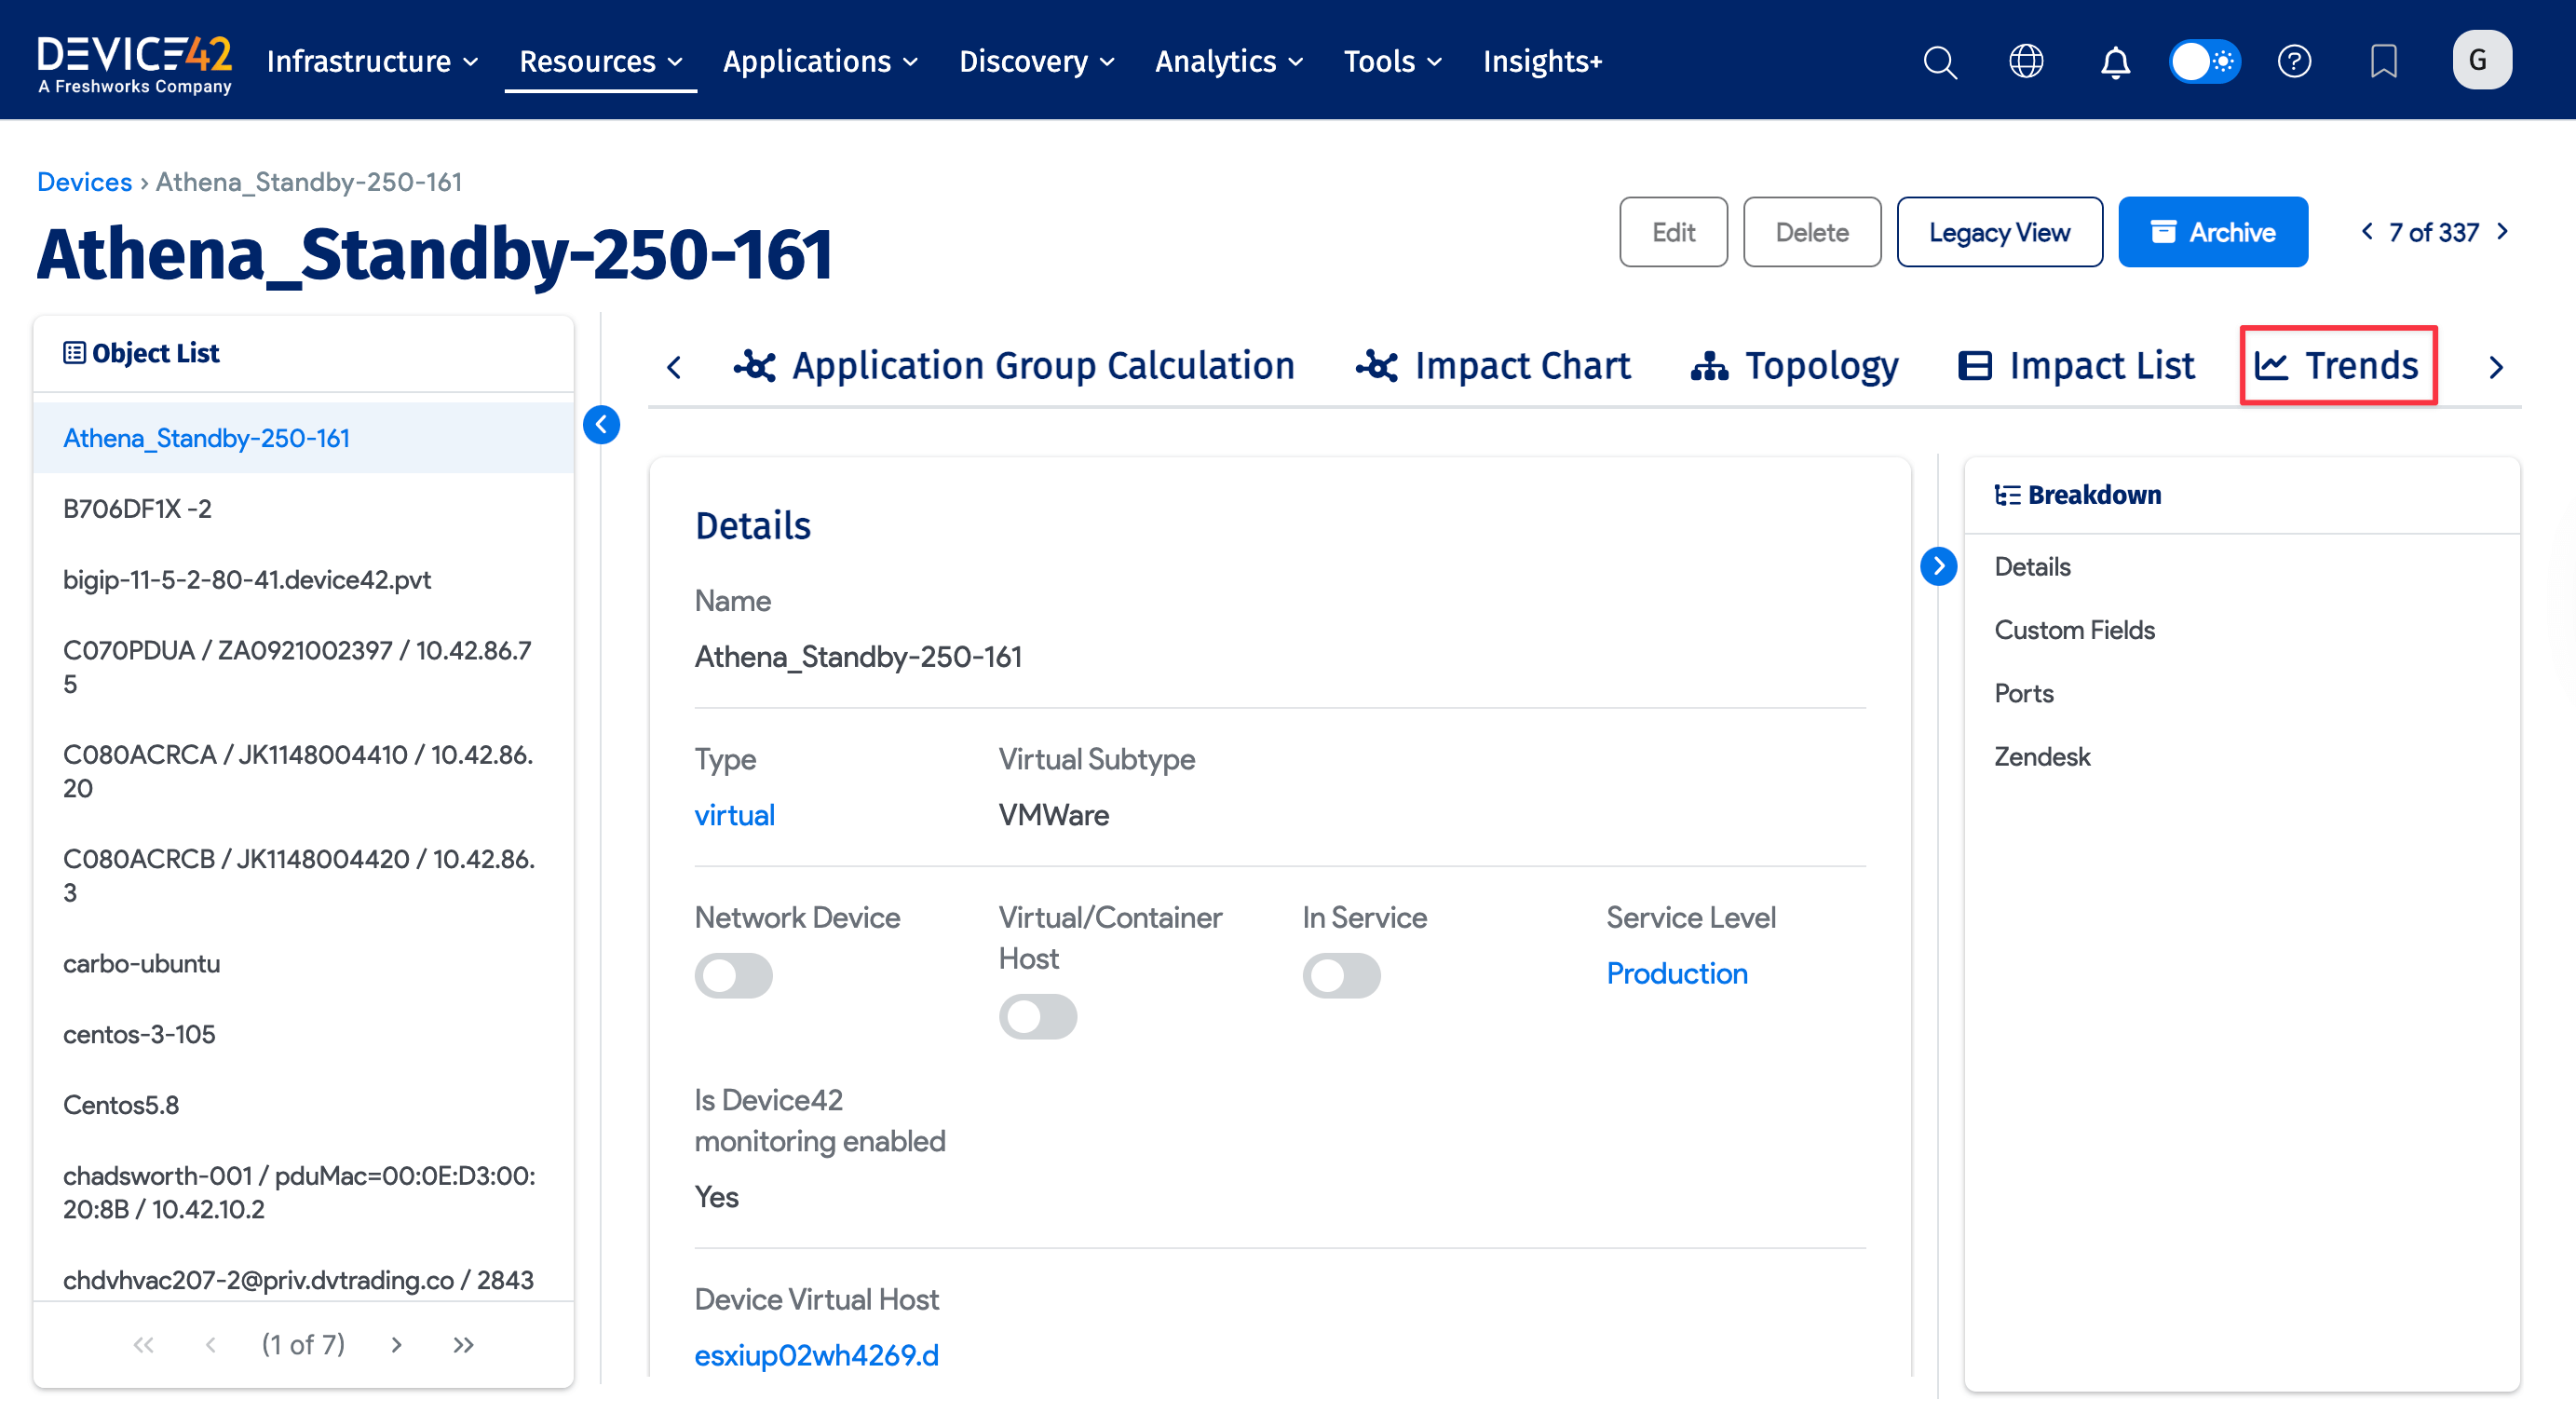
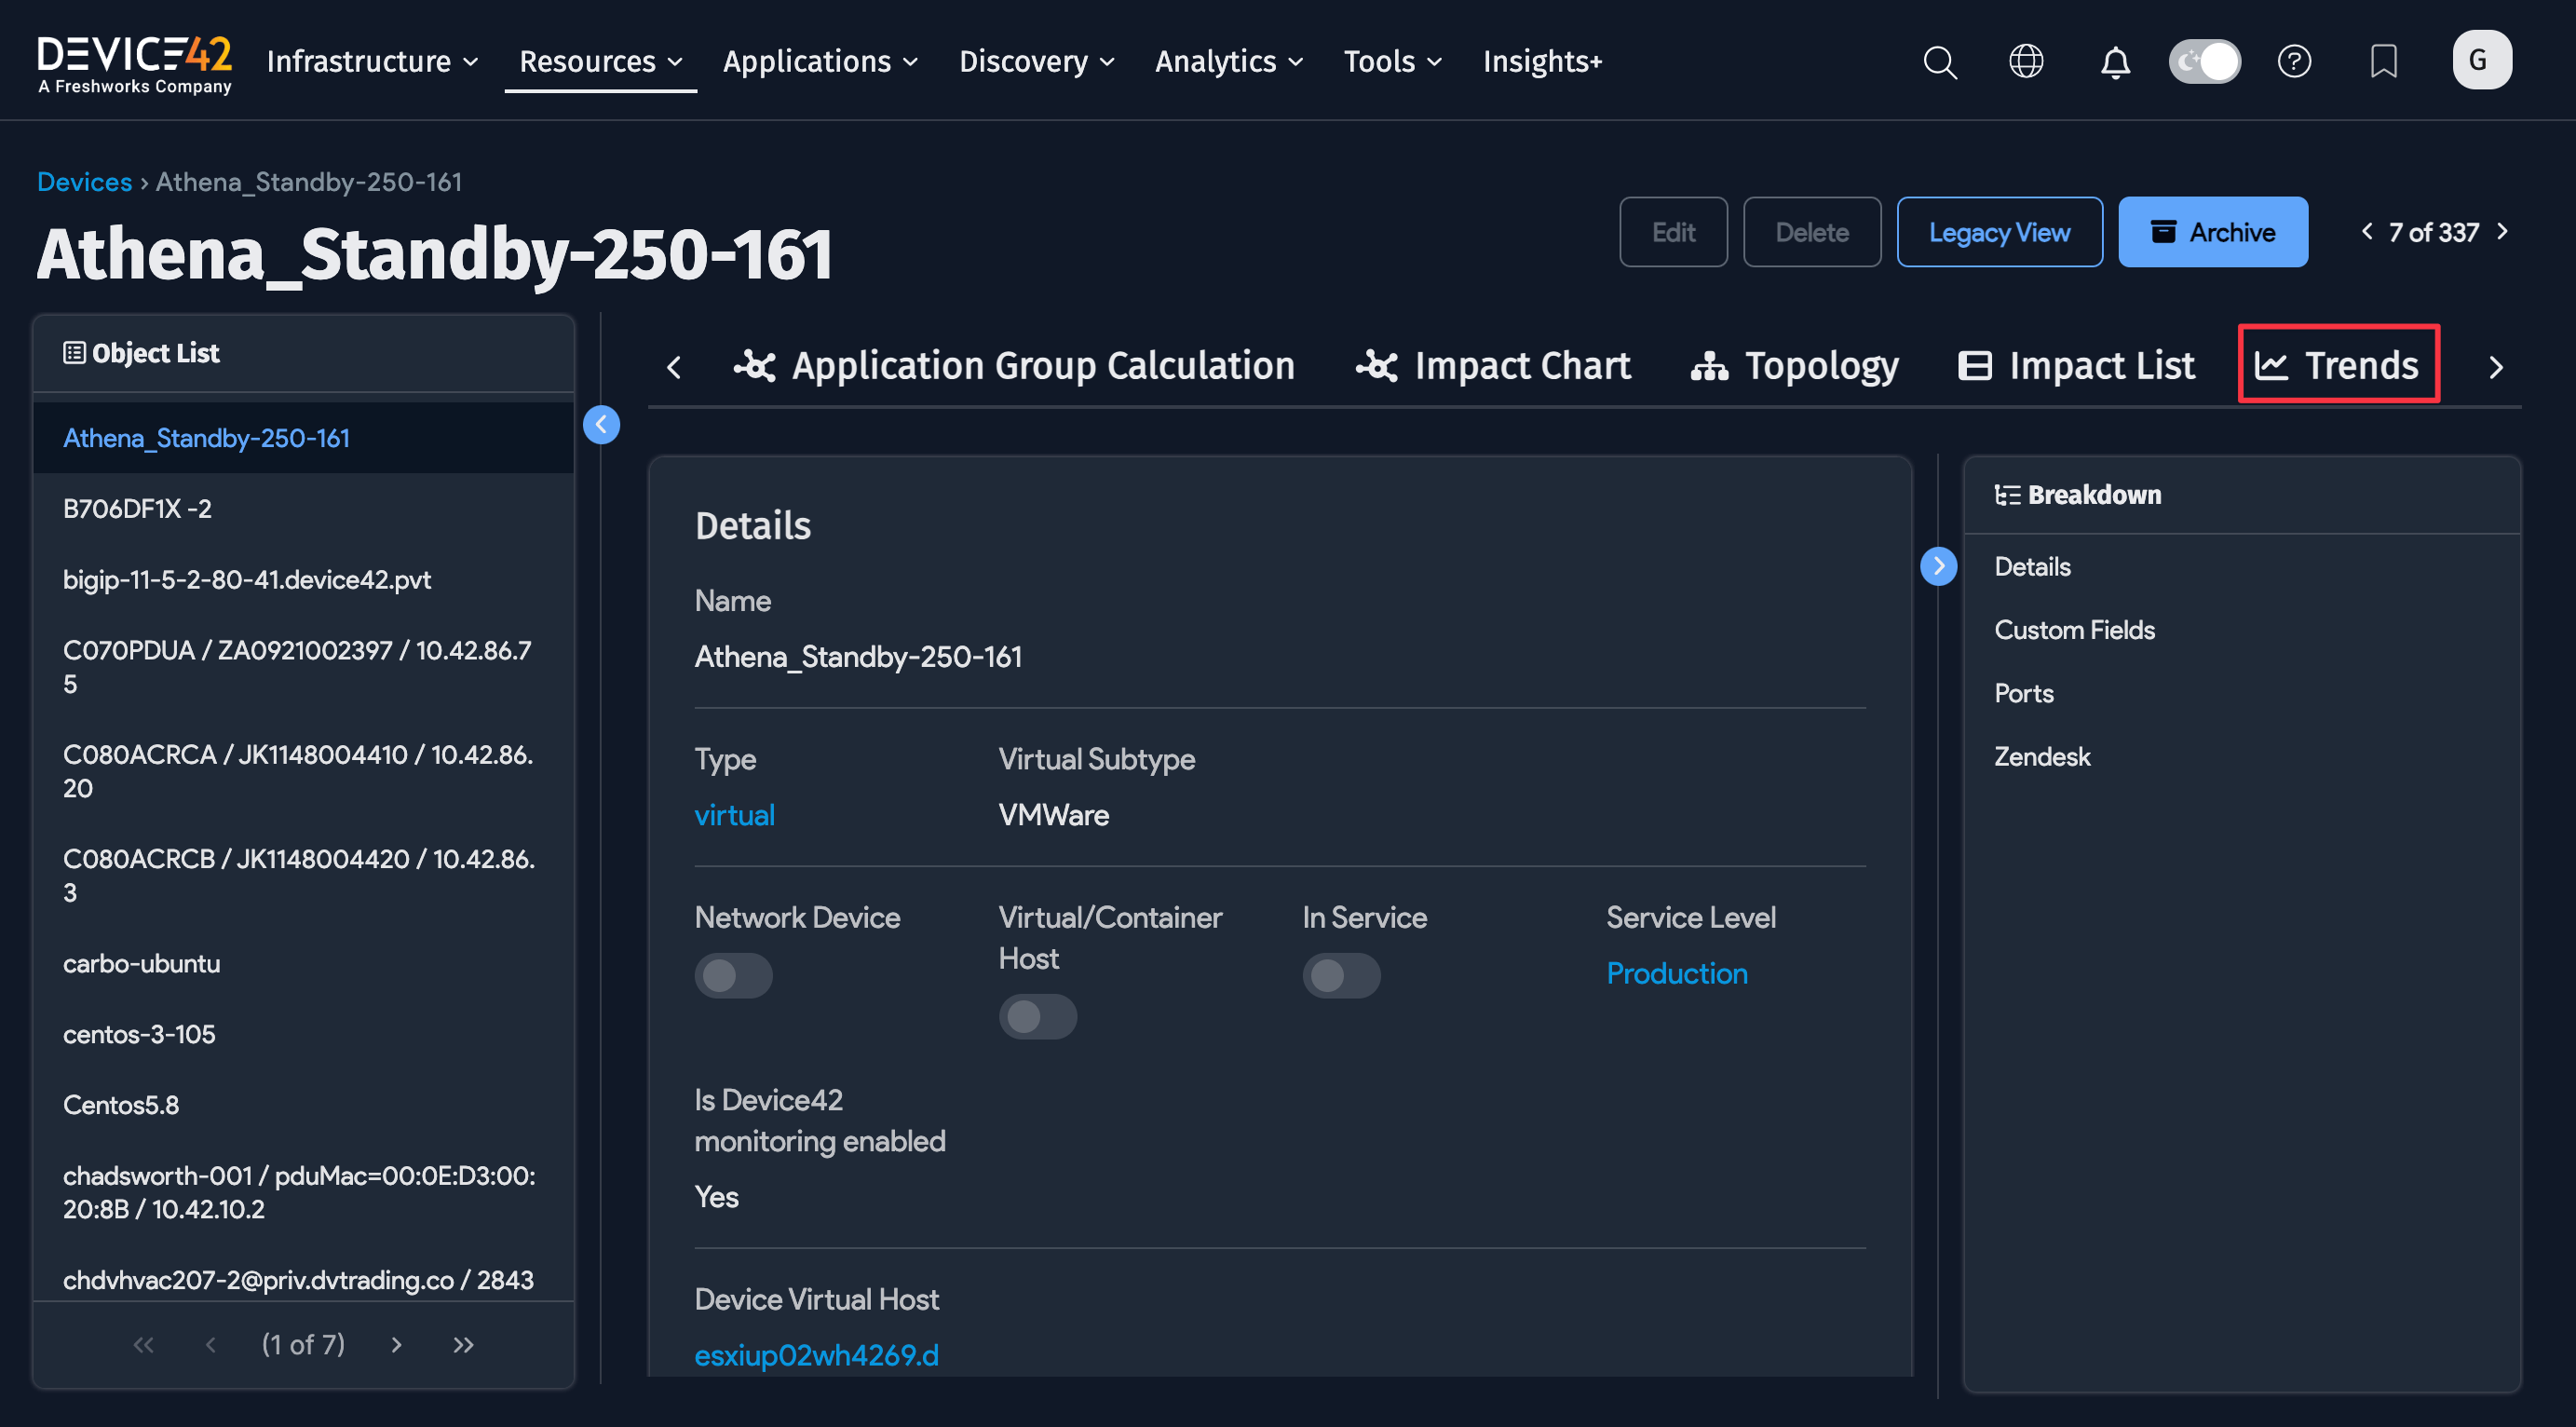
On an individual device's details page, the Is Device42 monitoring enabled option is set to Yes.
Technical Details: RU Data Storage
This section explains how RU data is stored and aggregated.
The Time-Series Database (TSDB)
Monitoring data is kept on the RC in a TSDB. A dedicated database called sensors is used for this purpose and contains the following series:
infeeds: Stores infeeds statsoutlets: Stores outlets statsbanks: Stores banks statsbattery: Stores battery statsdevice: Stores device sensors (usually load, power factor, and so on)env_sensor: Stores all types ofdevice_sensors(humidity, temperature, CPU, and so on)
You can think of these series as Excel sheets, with the first column always consisting of a timestamp. For example, a memory series looks like this:

In general, charts don't use all the data points, as there tend to be quite a lot of them. For example, a 30-second interval used for a month would generate 86,400 data points. Instead, data is aggregated, which is a common way to visualize data of this type.
Aggregation takes multiple data points and converts their values to one data point, depending on the selected aggregation function. Currently, Device42 does this one of three ways: MIN, AVG, or MAX.
As an example, if you were to generate AVG physical values from 5-minute intervals, with a point every minute, from the table in the screenshot above, you would get: | The MIN setting, instead, would return the smallest value from each set: |
|
|
Data Capture Intervals
The available intervals are:
- SNMP: 1 second
- Linux: 5 seconds
- Windows: 15 seconds
Data Visualization
To visualize data, choose the Trends option from any device that has RU enabled. This option is not displayed when tracking is not active or the license does not allow it.
For users with power tracking enabled, device_sensors is also shown here.
Captured Data Details
This section describes the metrics captured for each resource type.
CPU
CPU: The mathematical mean ofCPU-1...Nloads, expressed as a percentageCPU-1...N: The real CPU load as a percentage
Memory
Total: Sum of physical and swap in megabytesPhysical: RAM used in megabytesSwap: Swap/page file used in megabytes
Disks
Name: Name of the HDDWriteLatency: Latency of the write operations in msWriteIORate: Speed of the write operations in MB/sWriteIOPS: Number of write operations per secondWriteTransfer: Raw number of bytes written to diskReadLatency: Latency of the read operations in msReadIORate: Speed of the read operations in MB/sReadIOPS: Number of read operations per secondReadTransfer: Raw number of bytes read from disk
Network
Name: Name of the adapterInSpeed: Download speed in MB/sInTransfer: Raw number of bytes received by adapterOutSpeed: Upload speed in MB/sOutTransfer: Raw number of bytes transmitted by adapter
For the most part, Device42 displays aggregated values.
The only exception to this in v1 is for Transfer values. They are written as raw numbers and are constantly growing, so there is logic behind the display of the values themselves. Instead, the difference for a given interval is displayed:
For example, the following data for ReadTransfer:
| If a user requests data between 00:01 and 00:03 with density=3 (see API section for density details), Device42 prints:
|
If results cannot be retrieved from an RC (if the RC is down, for example), an Inaccessible Remote Collector message is displayed on trend reports.
Reporting
There are three types of RU data reports available via Analytics > Reports based on captured RU data.
Select the "Type of Data" you want to see:
- Minimum: Report uses data minimums
- Maximum: Report uses data maximums
- Average: Report uses data averages
Peak (Maximum) calculations:
- CPU: A single number that represents the sum of all (CPU power times percentage peak usage)
- Memory: Total Peak, RAM, Swap, and RAM + Swap
- Network: Peak per card
- Disk: Peak IO across disks and Peak latency
APIs
Currently, this API endpoint provides results in CSV format. JSON format may be implemented in the future:
/service/data/v1.0/trends/?id=2714&metric=AVG&timezoneoffset=-180&timeperiod=3&density=110&end_date=09%2F24%2F17+21%3A17%3A24
General API Parameters
type: Type of report, currently supports only device. Optional.id: Device IDids: Comma-separated list of IDs. Optional.metric: The aggregation function that will be used. Can beAVG,MIN, orMAX.timezoneoffset: Your time zone represented by GMT offset in minutes. For Moscow it is -180 (minus) and for NY 240 (without plus).end_date: The date of the final data point in US date and 24H time format,12/31/17 15:16:17.timeperiod: The number of hours that you want to observe.
Possible Values
Pass an integer, 1-9, to represent the following values:
| Value | Time Interval |
|---|---|
1 | 30 minutes |
2 | 1 hour |
3 | 3 hours |
4 | 6 hours |
5 | 12 hours |
6 | 24 hours |
7 | 7 days |
8 | 31 days |
9 | 183 days |
Data Points Control Parameters
To control the number of data points, use the interval or density parameter. Choose one or the other, as trying to use both causes one to override the other.
interval: Specify the number of seconds between data points. For example, if you want to get AVG/MIN/MAX data at 5-minute intervals for the last 24 hours, setinterval=300and you will receive 288 data points.density: The number of points to collect per interval. This is similar tointerval, but you should use it if you want to get an exact number of points for a given interval. For example, if you use a time ofperiod=6(24 hours) anddensity=100, you will get 100 points with an interval of approximately 14.5 minutes. With a density of 1000, you will get 1000 points with a 1.5-minute interval.
Important Limitation: If the device polling interval is N seconds, and N > interval, the RC resets interval to N. For example, if the polling interval for the device is 15 seconds, and you set density=1000 and period=1 (30 min), you will not get 1000 points. Instead, you will get 30 min * 60 seconds = 1800 seconds / 15 seconds polling interval = 120 points.
CSV contains the following type-measure combinations of data:
CPU-load: Aggregated CPU load for the selected interval as a percentage (for CPUs without a number, it is averaged across all numbered CPUs)Mem-physical: Aggregated physical memory usedMem-swap: Aggregated swap usedDisk-(total,write,read)_iops: Aggregated IOPS for the diskDisk-(total,write,read)_iorate: Aggregated IORate for the diskDisk-(total,write,read)_latency: Aggregated latency for the diskDisk-(total,write,read)_transfer: Raw transfer for the disk at the end of the intervalDisk-(total,write,read)_transfer_diff: Difference between raw transfer at the end and the start of the intervalNic-(in,out)_speed: Aggregated speed for the interfaceNic-(in,out)_transfer: Raw transfer for the network interface at the end of the intervalNic-(in,out)_transfer_diff: Difference between raw transfer at the end and at the start of the interval
What If My RC Is Offline?
If your target RC is offline, you cannot fetch data from it, as the RC must be responsive to queries for data. All fields either come back empty or display the - character. Charts and reports show empty gaps in data for periods when the RC was down. One exception is the PDU main page, which displays the latest values because its data is cached.
Handle the Same IP Across Multiple RCs
If an IP is discovered across multiple Remote Collectors (RCs), Device42 does not monitor that IP again if it is already being monitored. Permitting duplicate monitoring would likely result in unexpected behavior.
Monitoring Management Example Scenarios
Consider the following scenario:
You have three Devices, A, B, and C, and two RCs, RC#1 and #2. Monitoring is currently disabled on all three.
Two discovery jobs are configured:
- Job#1 includes Device A and Device B
- Job#2 includes Device B and Device C
You run Job#1 on RC#1 with monitoring enabled. After discovery, you have:
- DeviceA with monitoring on RC#1
- DeviceB with monitoring on RC#1
- DeviceC without monitoring
Then you decide to run discovery using Job#2 on RC#2 with monitoring disabled. After this discovery job runs, you have:
- DeviceA with monitoring on RC#1
- DeviceB with monitoring on RC#1
- DeviceC without monitoring
Then you change the settings on Job#2 and run it from RC#2 with monitoring enabled. The end result is:
- DeviceA with monitoring on RC#1
- DeviceB with monitoring on RC#1
- DeviceC with monitoring on RC#2
DeviceB does not switch the RC that it's attached to.
(Legacy) Switch Device RU Monitoring to Another RC
If you want to move a device to another RC, open the device list, select the device, and select one of the Disable monitoring for selected devices... actions. After disabling monitoring, run the job again with monitoring re-enabled on the new target RC.

The options differ according to how they handle the historical data for the device. The ...but keep data action stores data for as long as needed, so that if the same device is rediscovered, the existing data is automatically utilized. The ...and delete data option deletes all existing data from the server. When a previously existent device is rediscovered with this option selected, its history begins anew.
Now rerun Job#2 on RC#2 with monitoring enabled once again. After that run, the device has moved to RC2:
- DeviceA with monitoring on RC#1
- DeviceB with monitoring on RC#2
- DeviceC with monitoring on RC#2