Power Monitoring
This section describes Device42's power monitoring capabilities. If you are just getting started, you'll want to first set up one or more Remote collectors (RCs).
Power Heatmaps
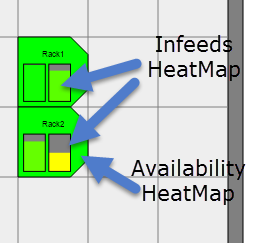
When you navigate to a room layout view, for example, by navigating to DataCenter > Rooms, choosing a room, and clicking Show, the racks are color-coded to show both space and power availability. Each power-enabled rack displays a rectangular bar graph representing each infeed of each PDU in the rack. These bars are color-coded, representing the amount of power currently in use over the infeed divided by the power capacity of that infeed.
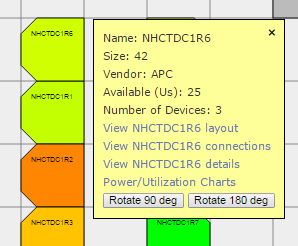
If you hover over a rack, you will see a popup. The Power/Utilization Charts hyperlink takes you to a display showing the power history for each infeed and outlet.
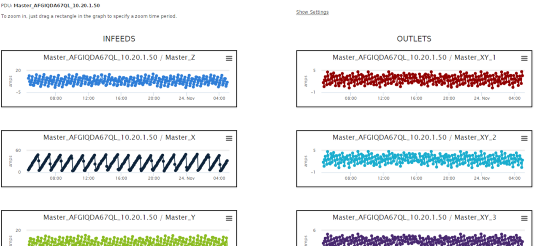
Rack-Level Power Visualization
You can view the visualizations under the Power Charts tab from any rack with a power unit that has discovered data.
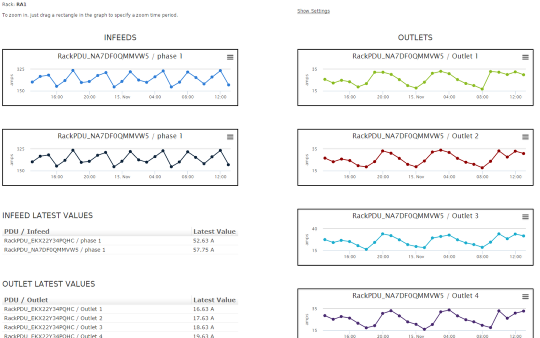
Here you can see the last 24 hours of power data for each infeed and outlet for each PDU in the rack. If you want to look at a different time (for example, the last week, month, or year), click the Show Settings button.
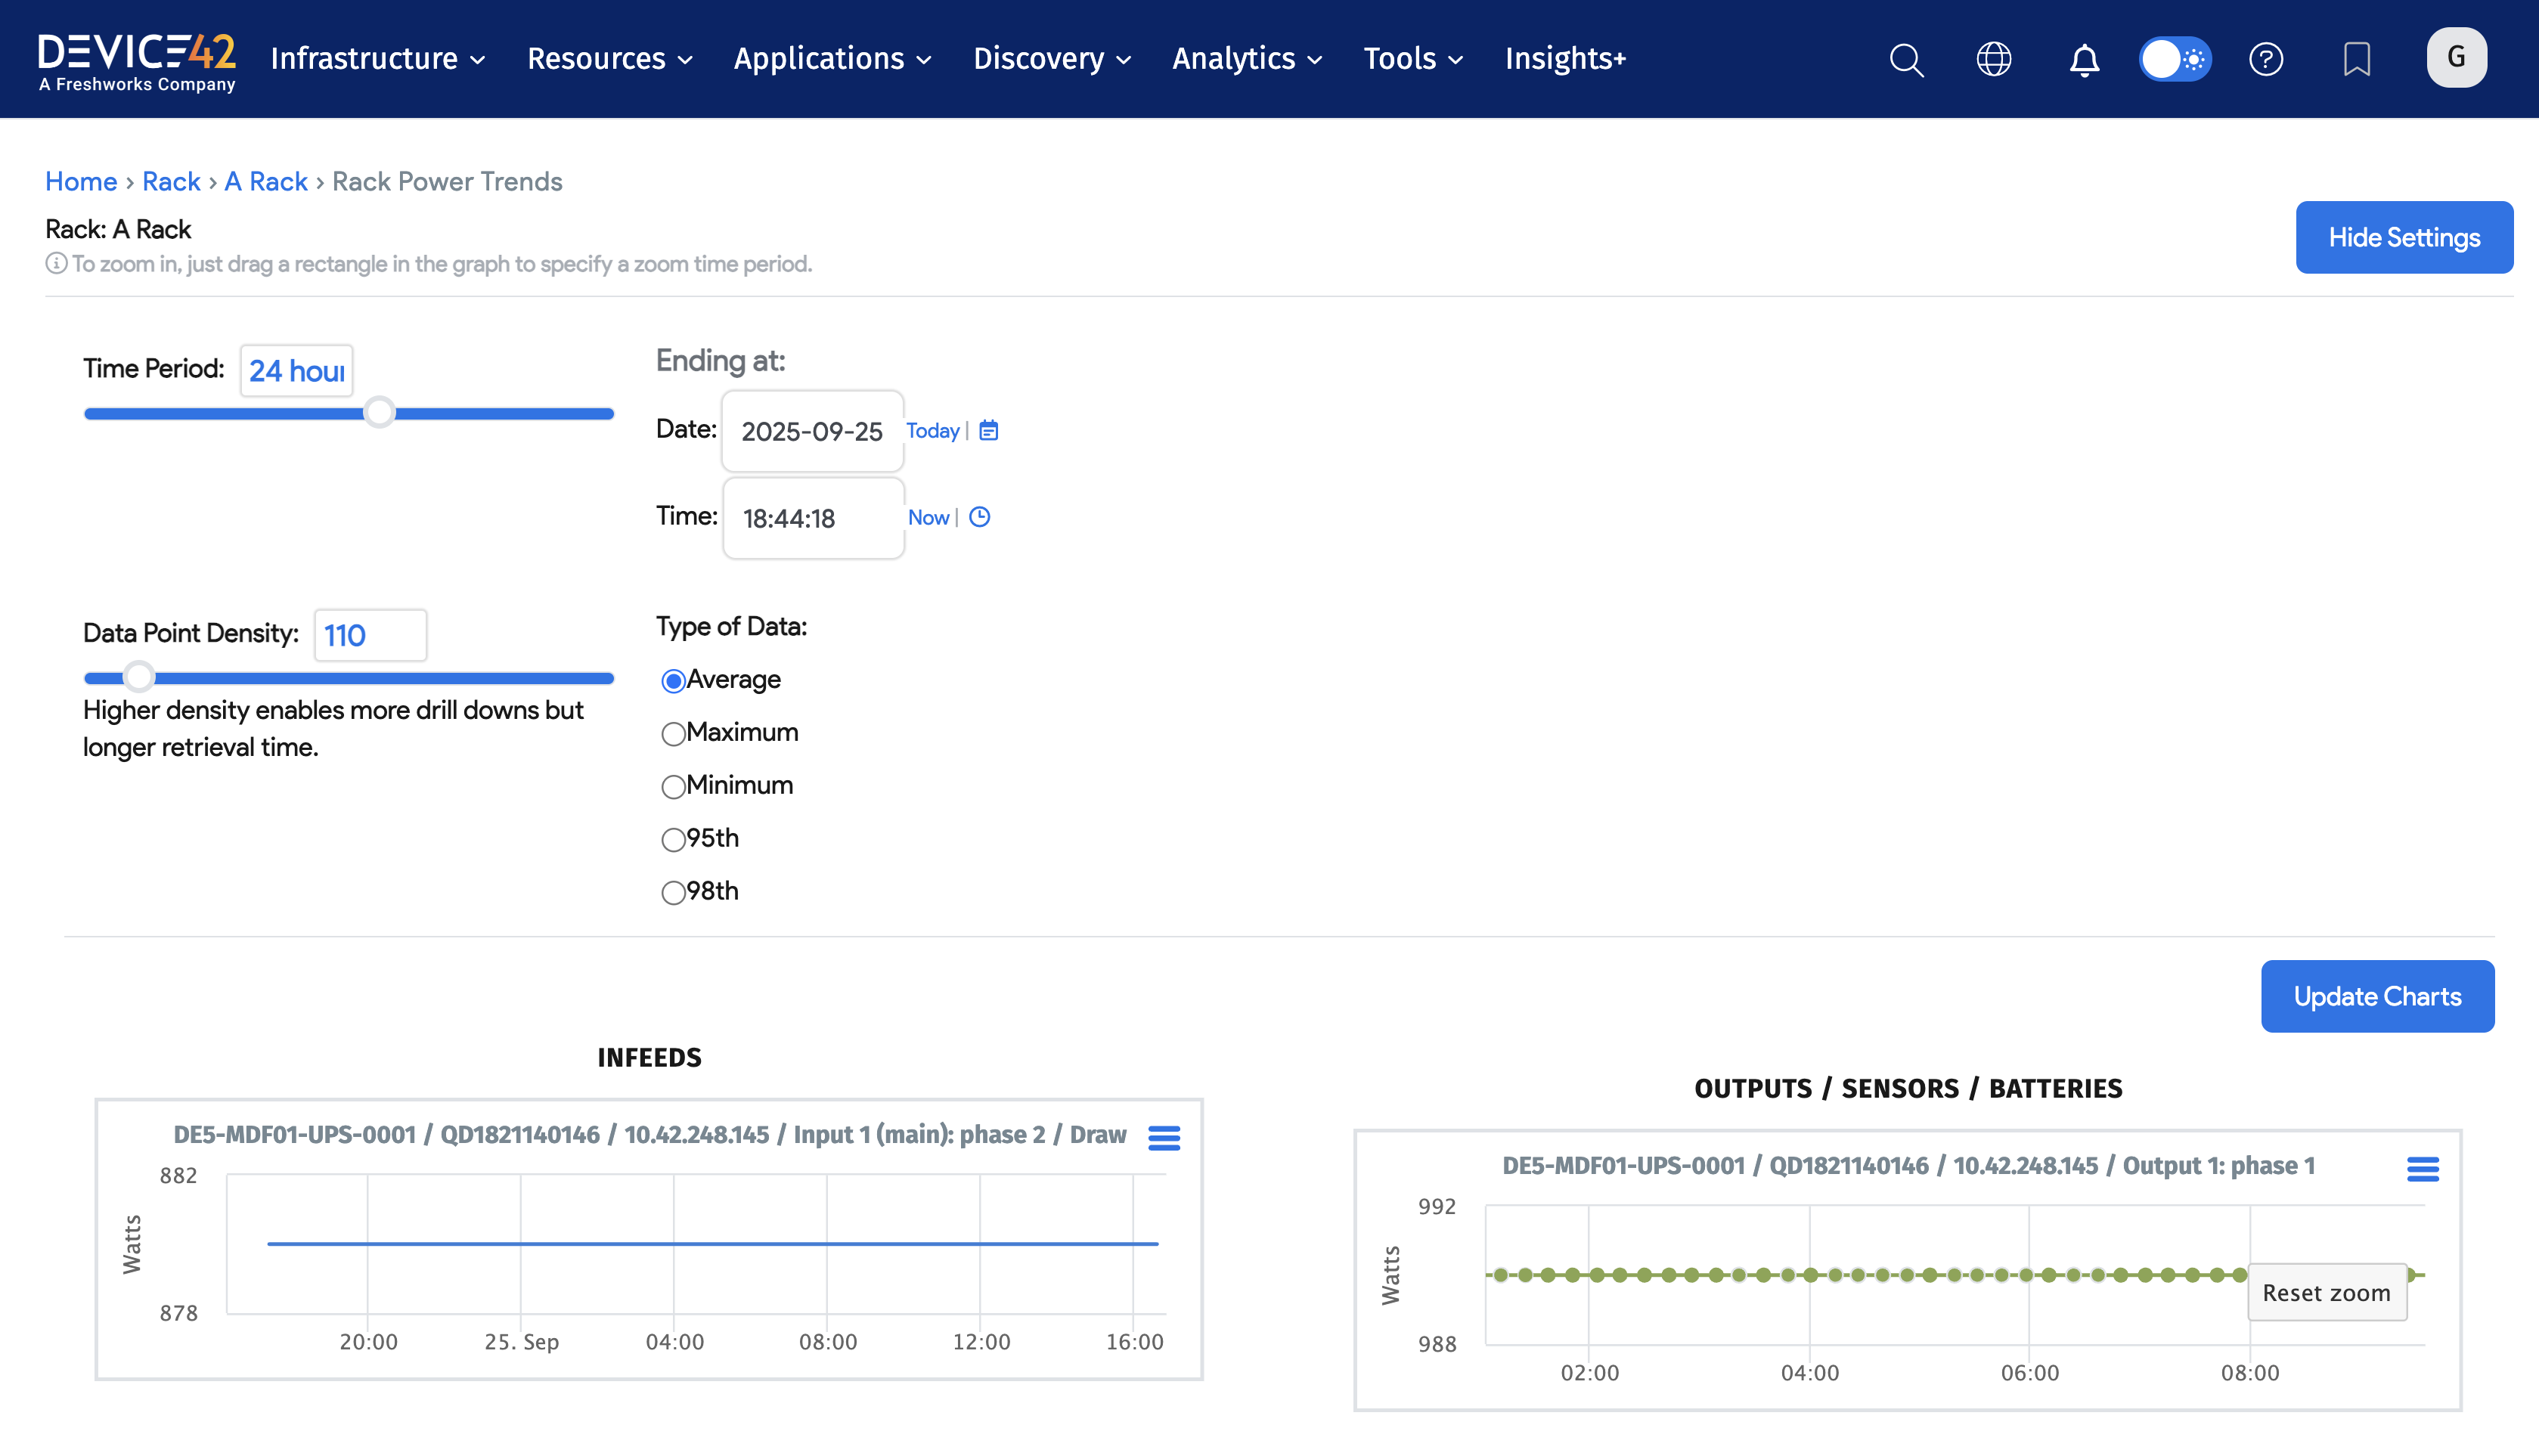
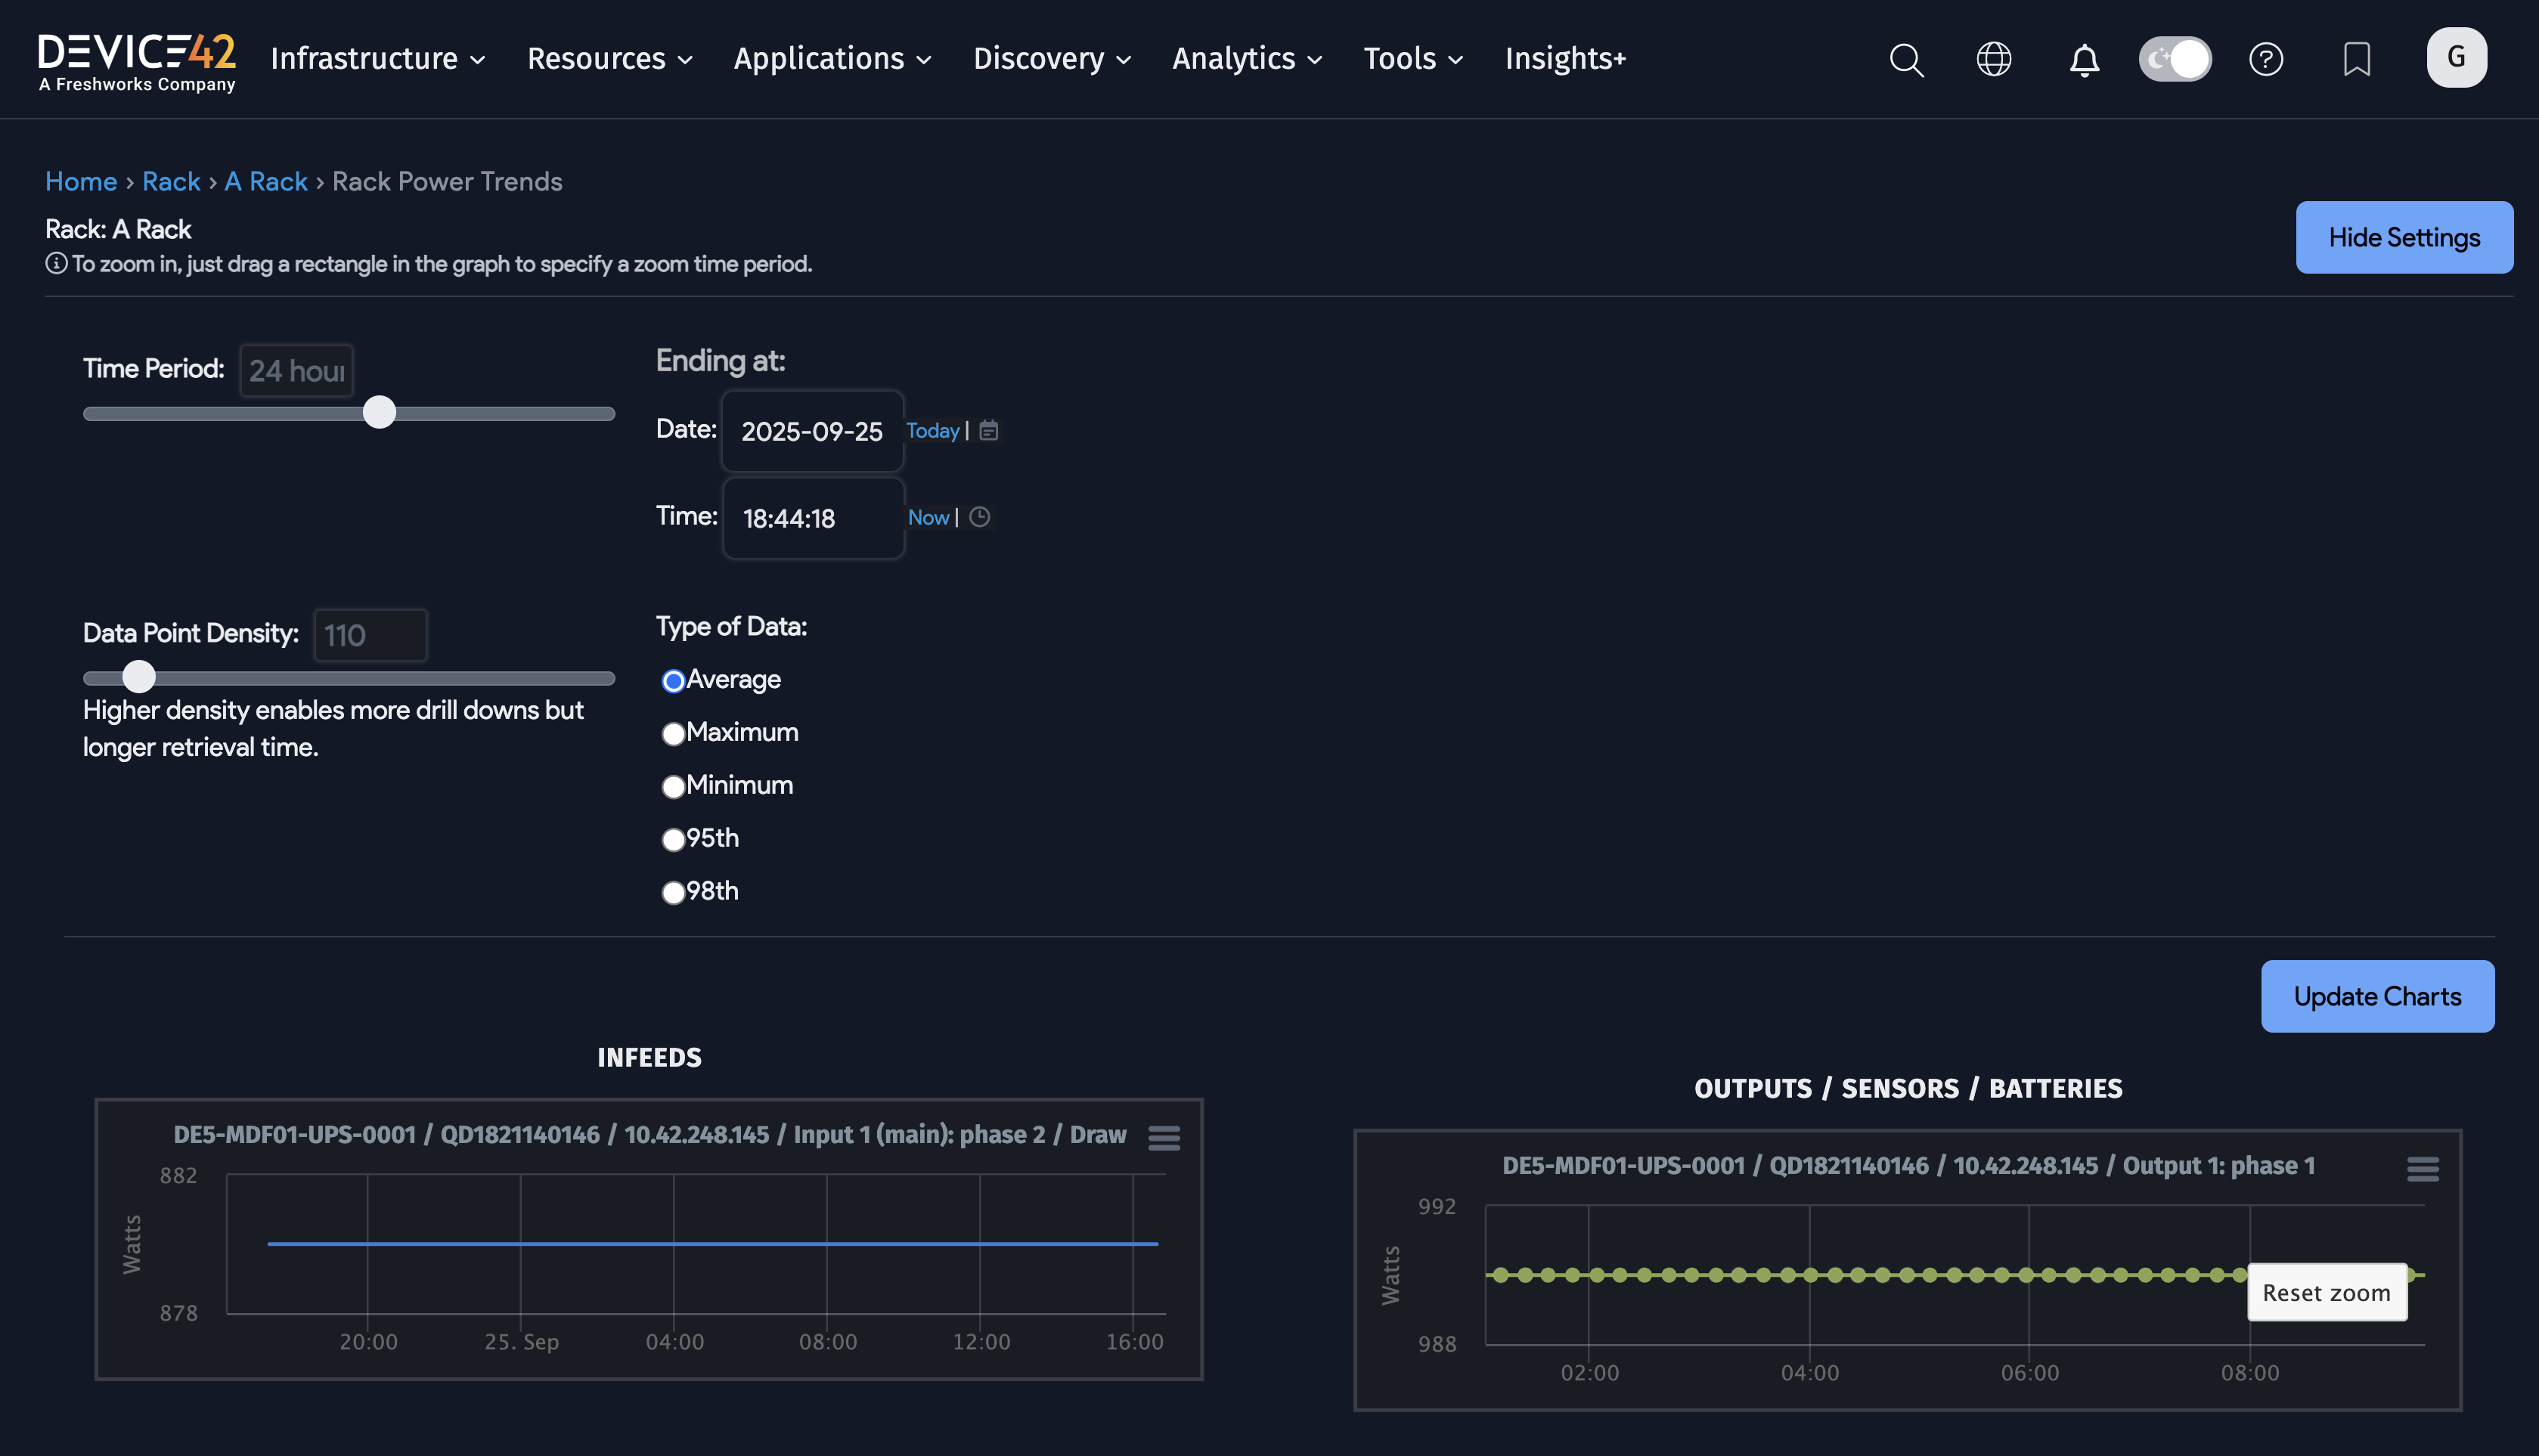
In the dialog box above, you can move sliders for the period (set for the past day in the example above).
You can also specify the data density. A higher data density brings back more data points but may also take a little longer to retrieve.
Last, you can specify the type of data to retrieve. This option requires some explanation: When you define an autodiscovery spec for a set of PDUs, one option is the polling interval in minutes. For example, if you set it to poll every minute, the database will hold minute-by-minute data. But if you request a week's data, Device42 will not bring back every individual data point; instead, it will aggregate the data points based on the data type. The Average setting brings back average data points, the Maximum setting brings back the maximum value observed for each set of data points, and the Minimum setting brings back the minimum value.
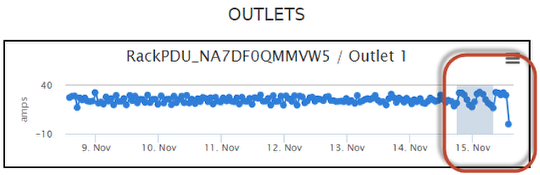
As you observe the data, you may see spikes or observe other data patterns that cause you to want to inspect the data in more detail. You can do this by highlighting the period you want to investigate.
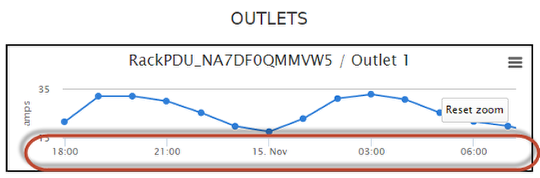
After you release the mouse button, the view expands to the highlighted period.
Rack-level power charts are also available from the Rack View page if you click the Power button at the top right of the page.
PDU-Level Power Data
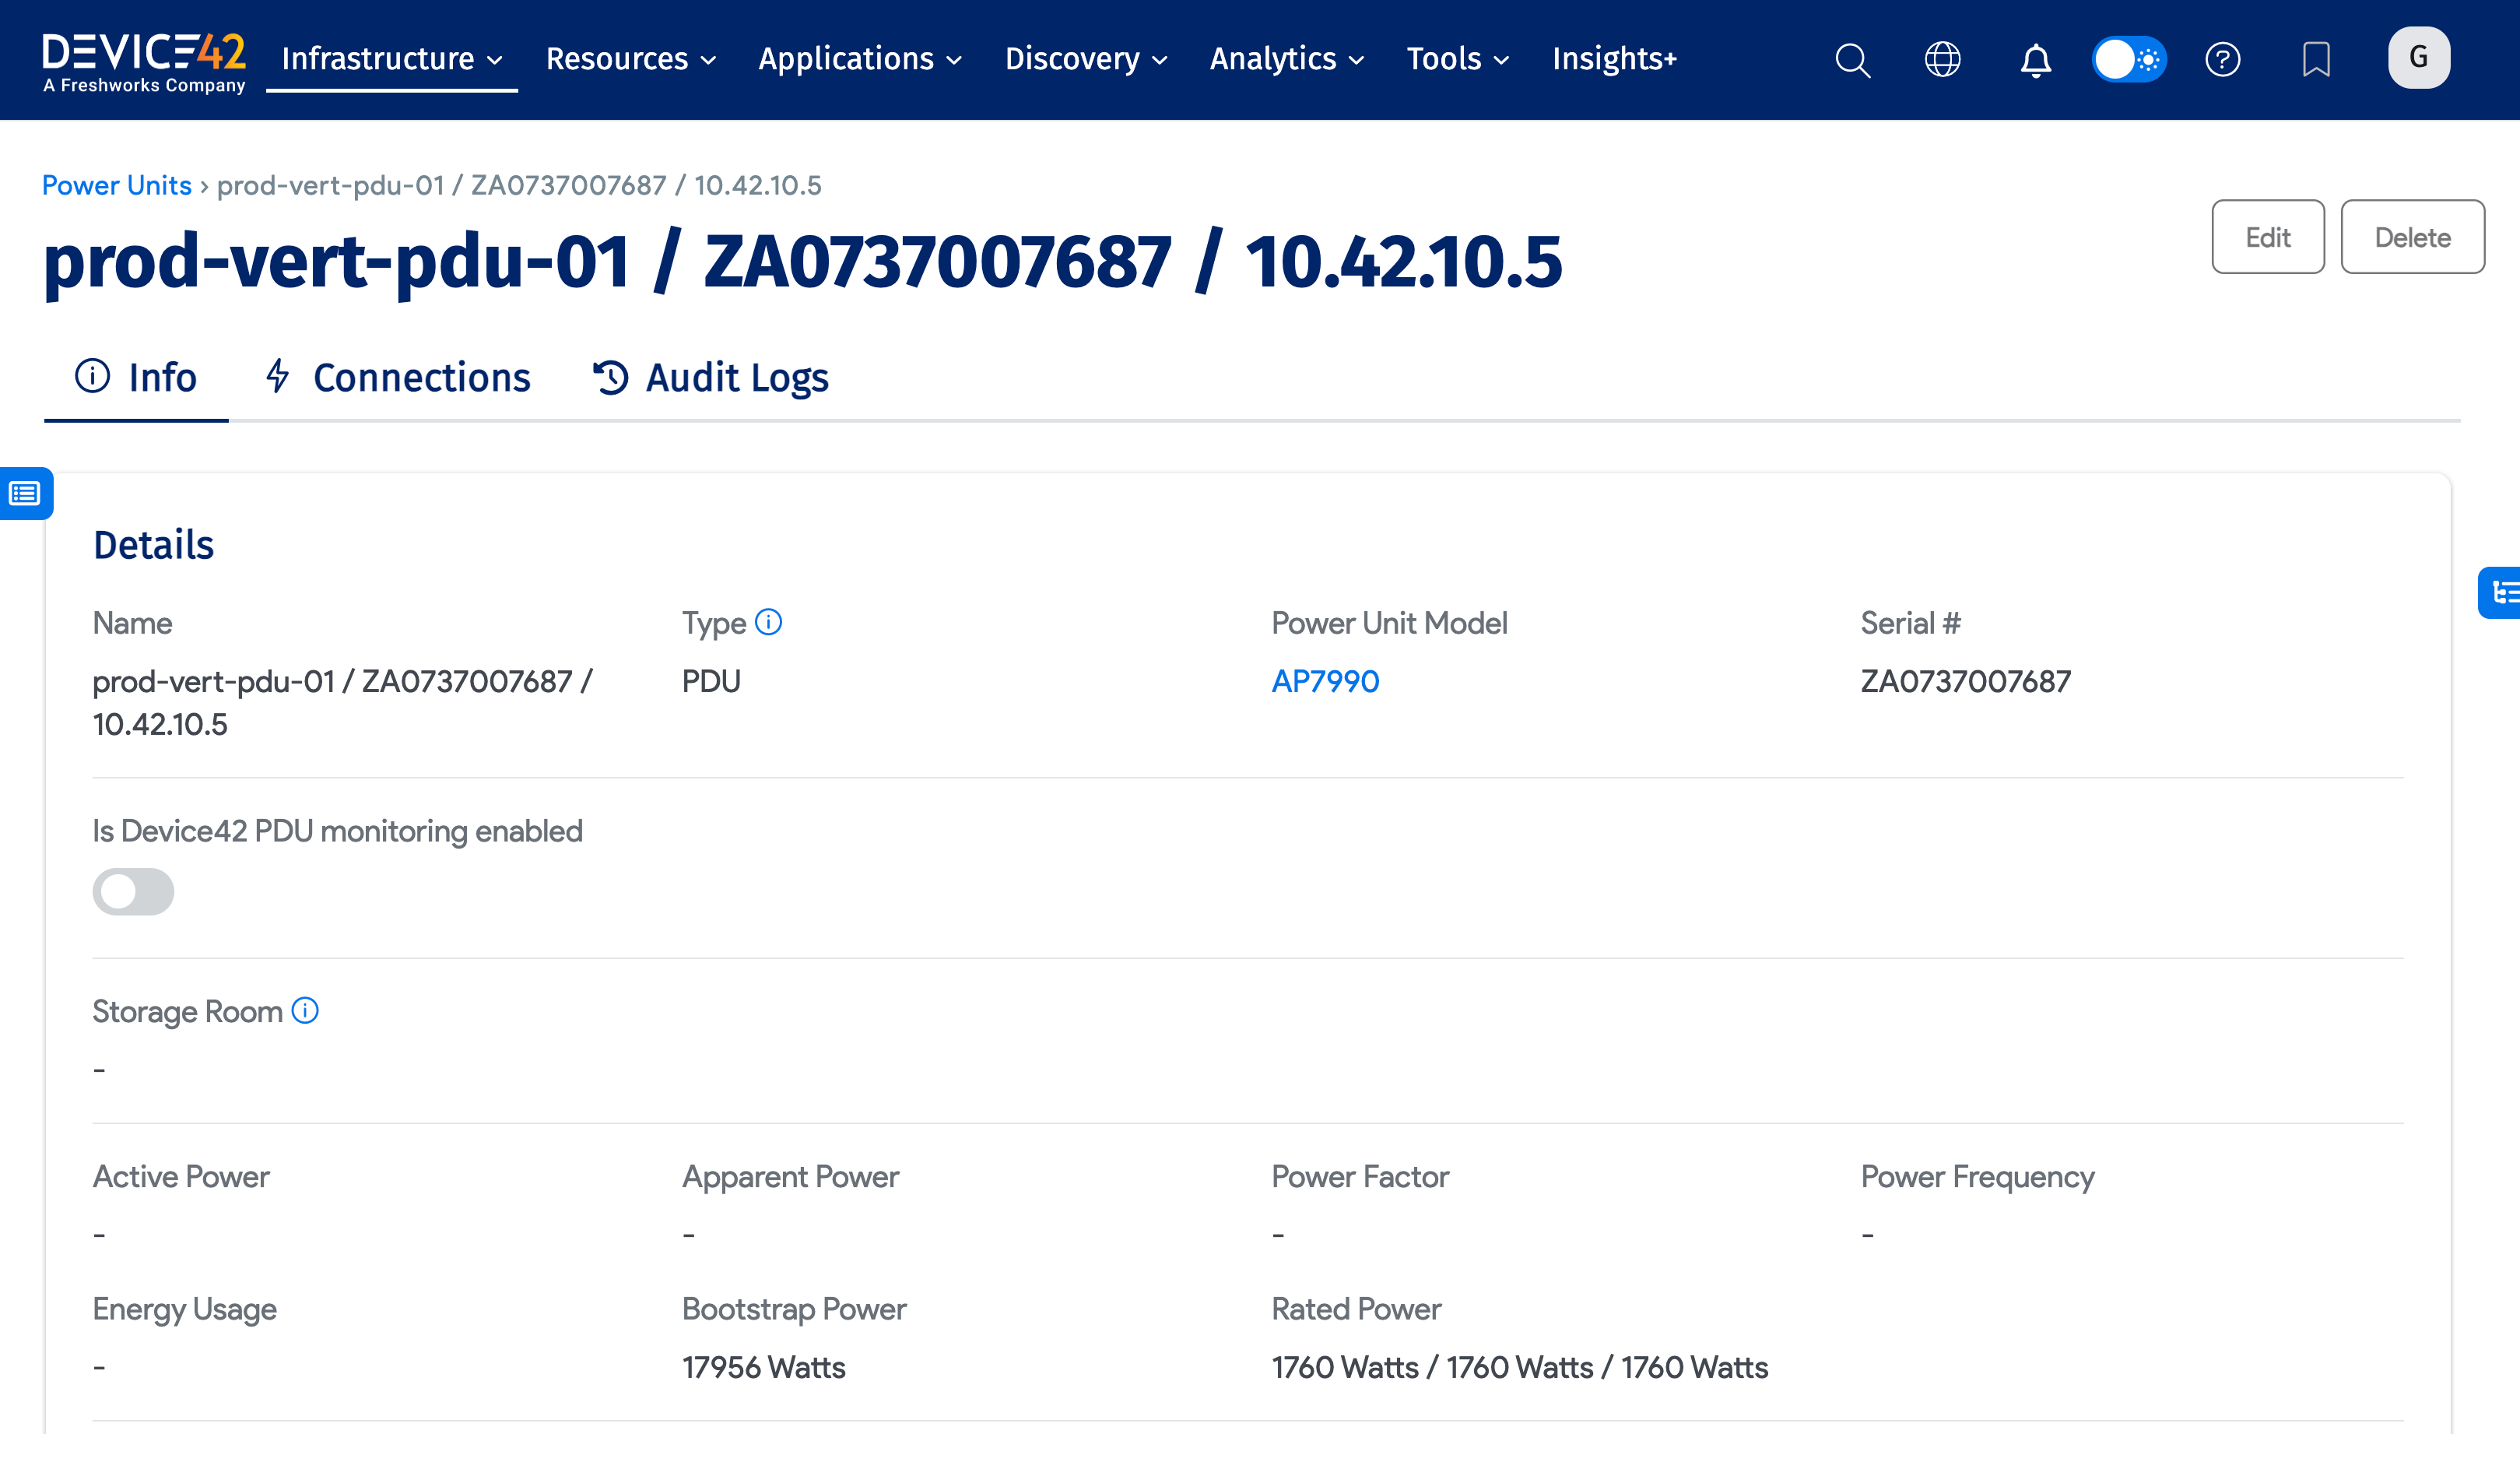
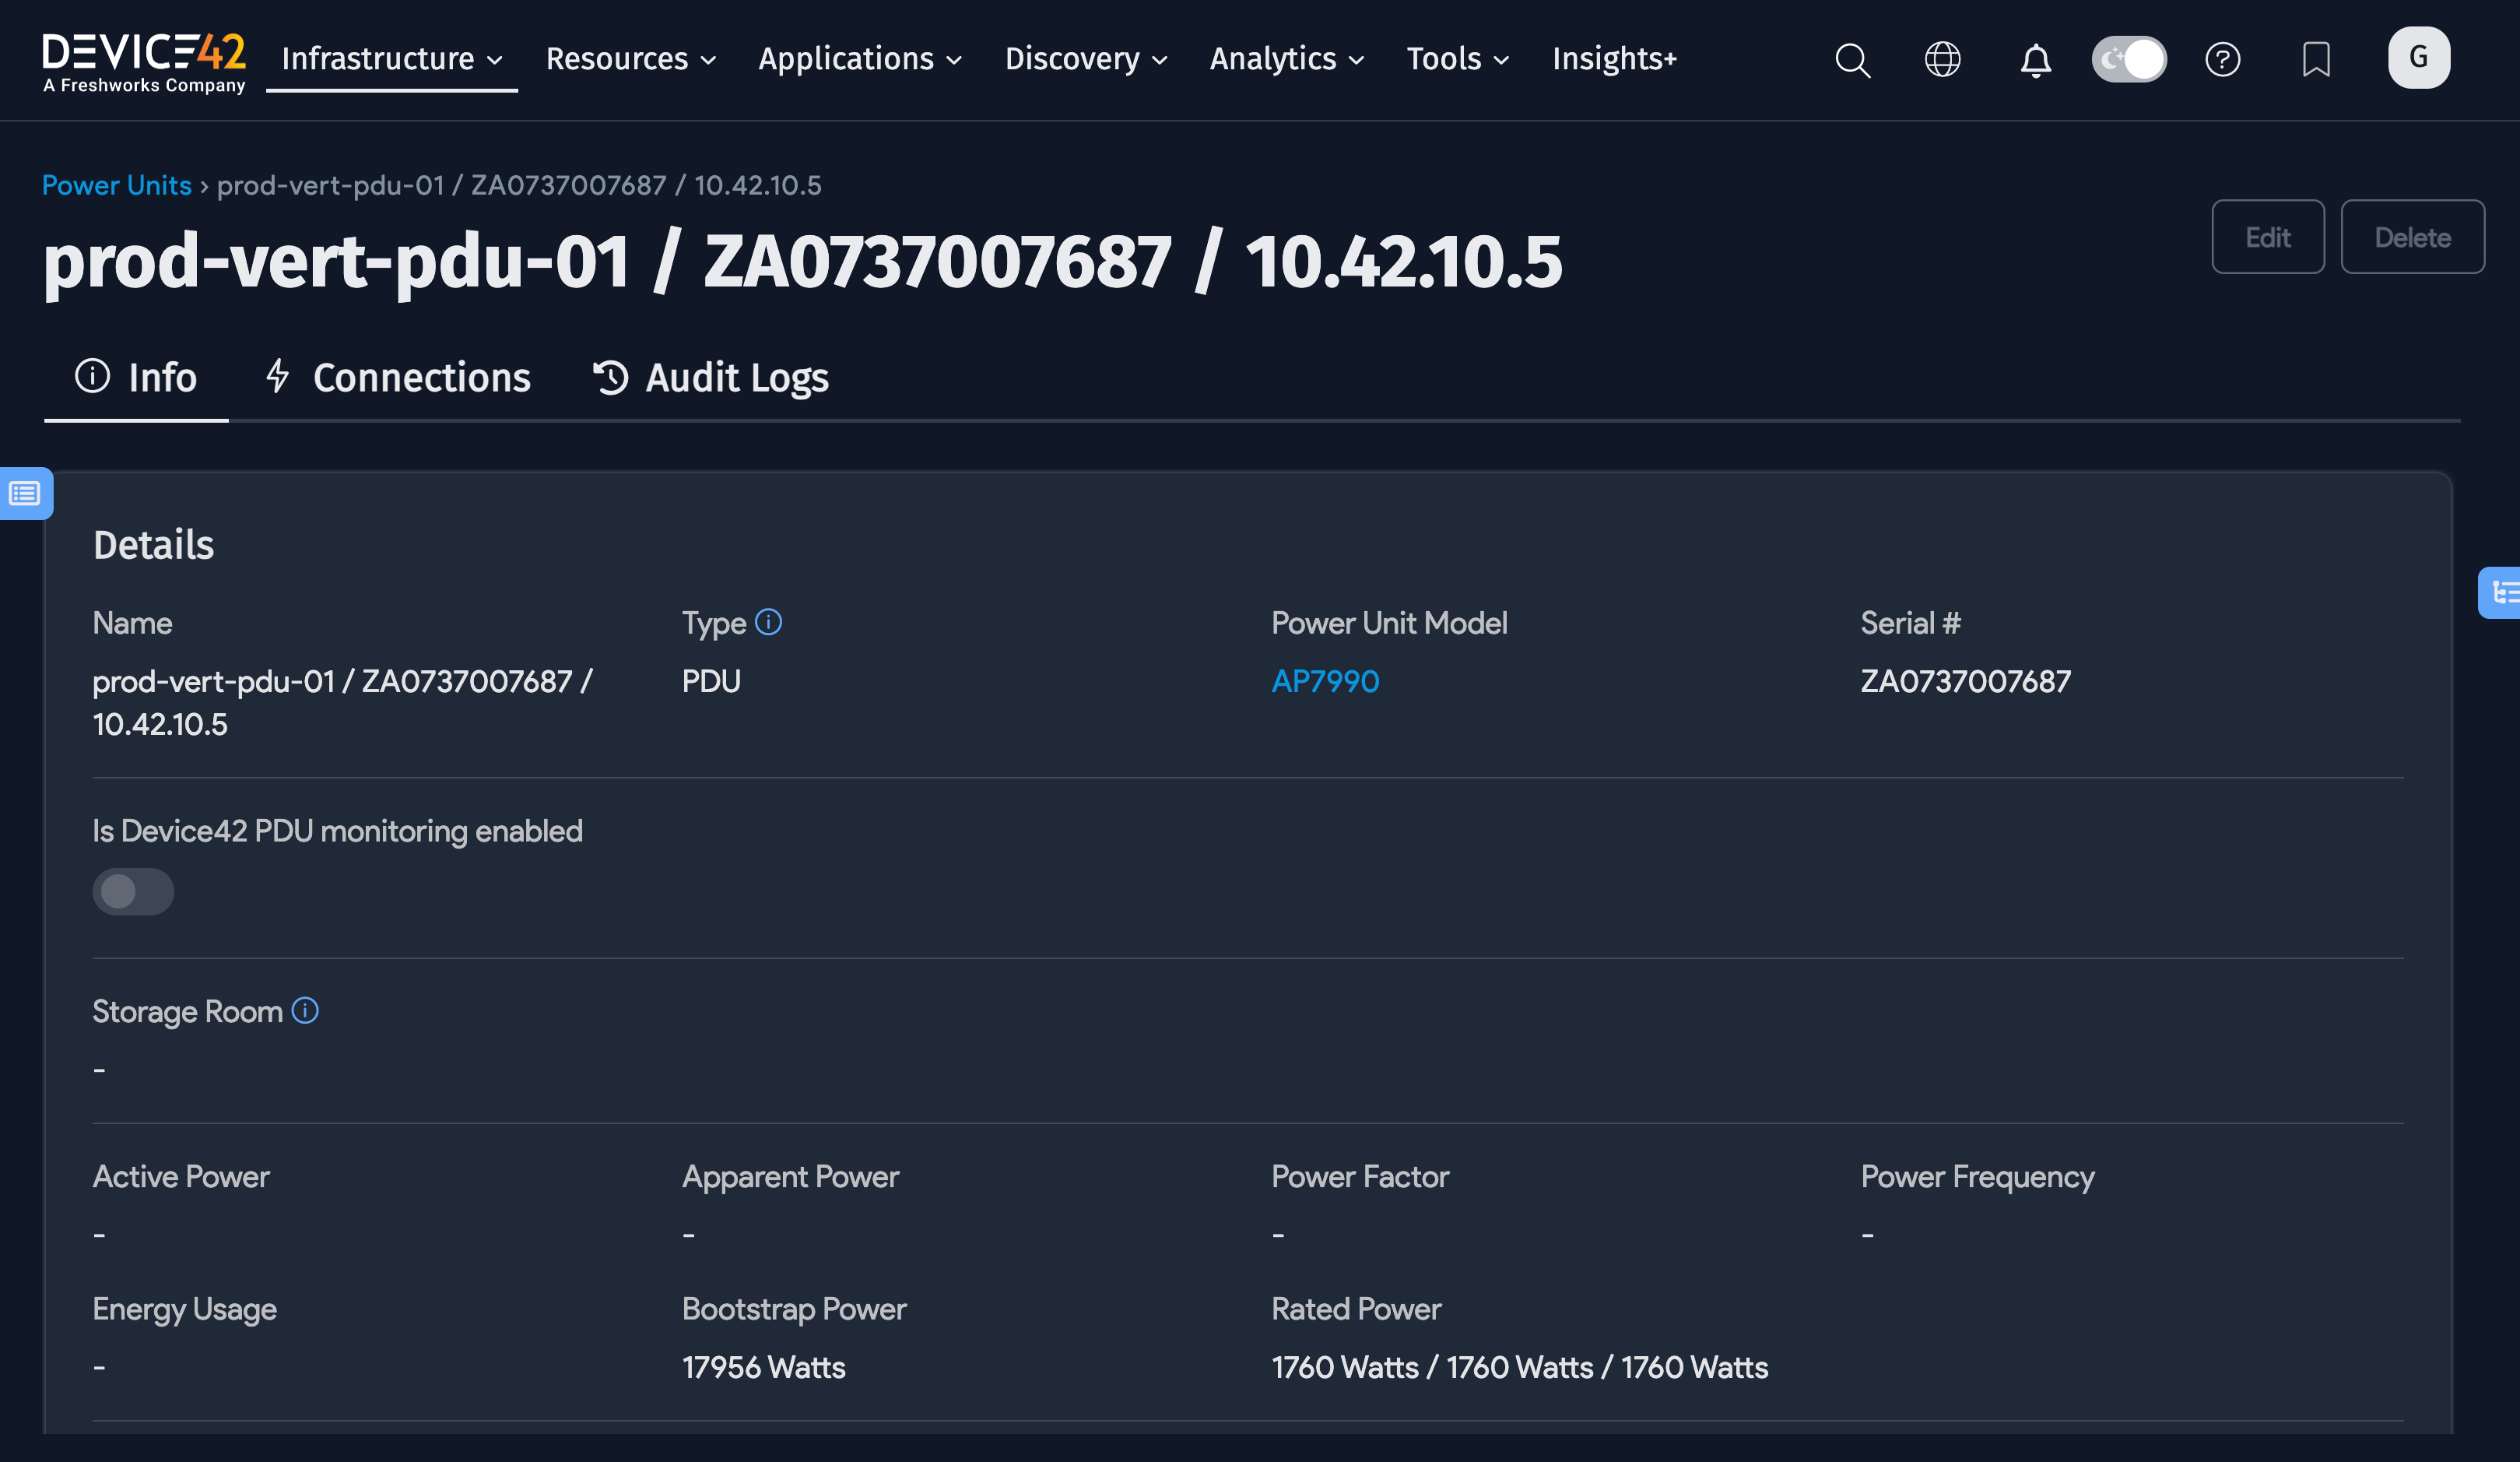
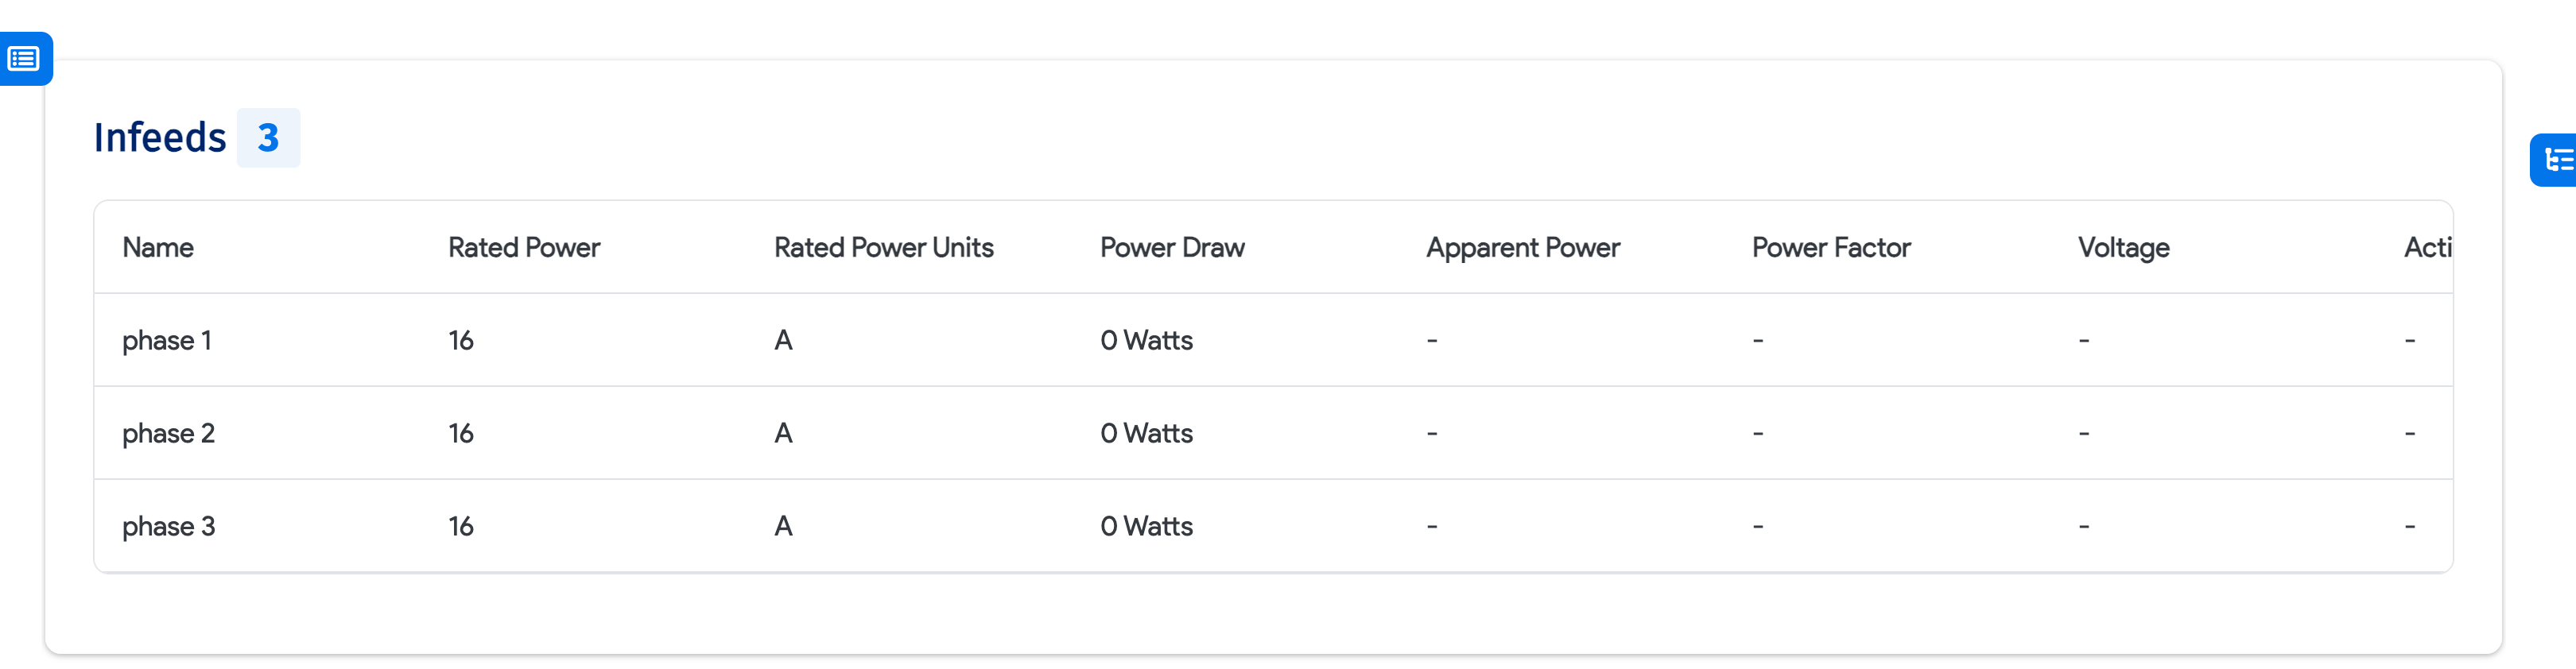
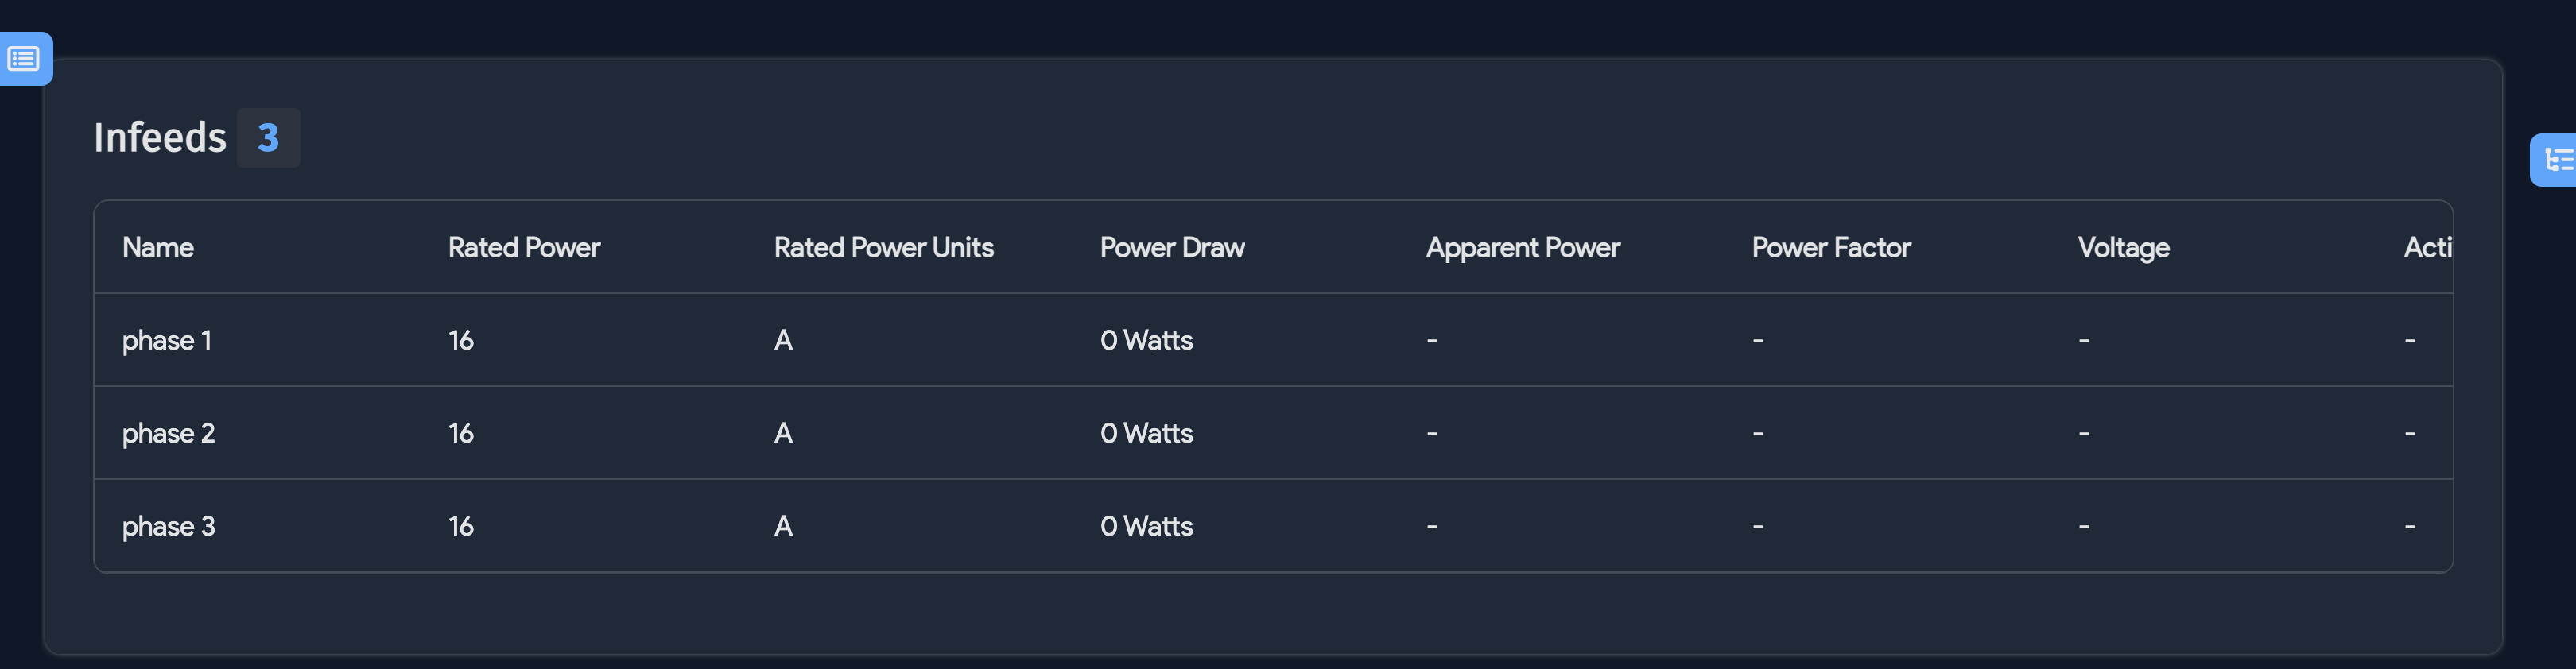
When you drill into a PDU, you can see power details for both Infeeds and Ports (outlets). In the example, the PDU has three infeeds and 24 outlets as visualized under the Connectivity tab:
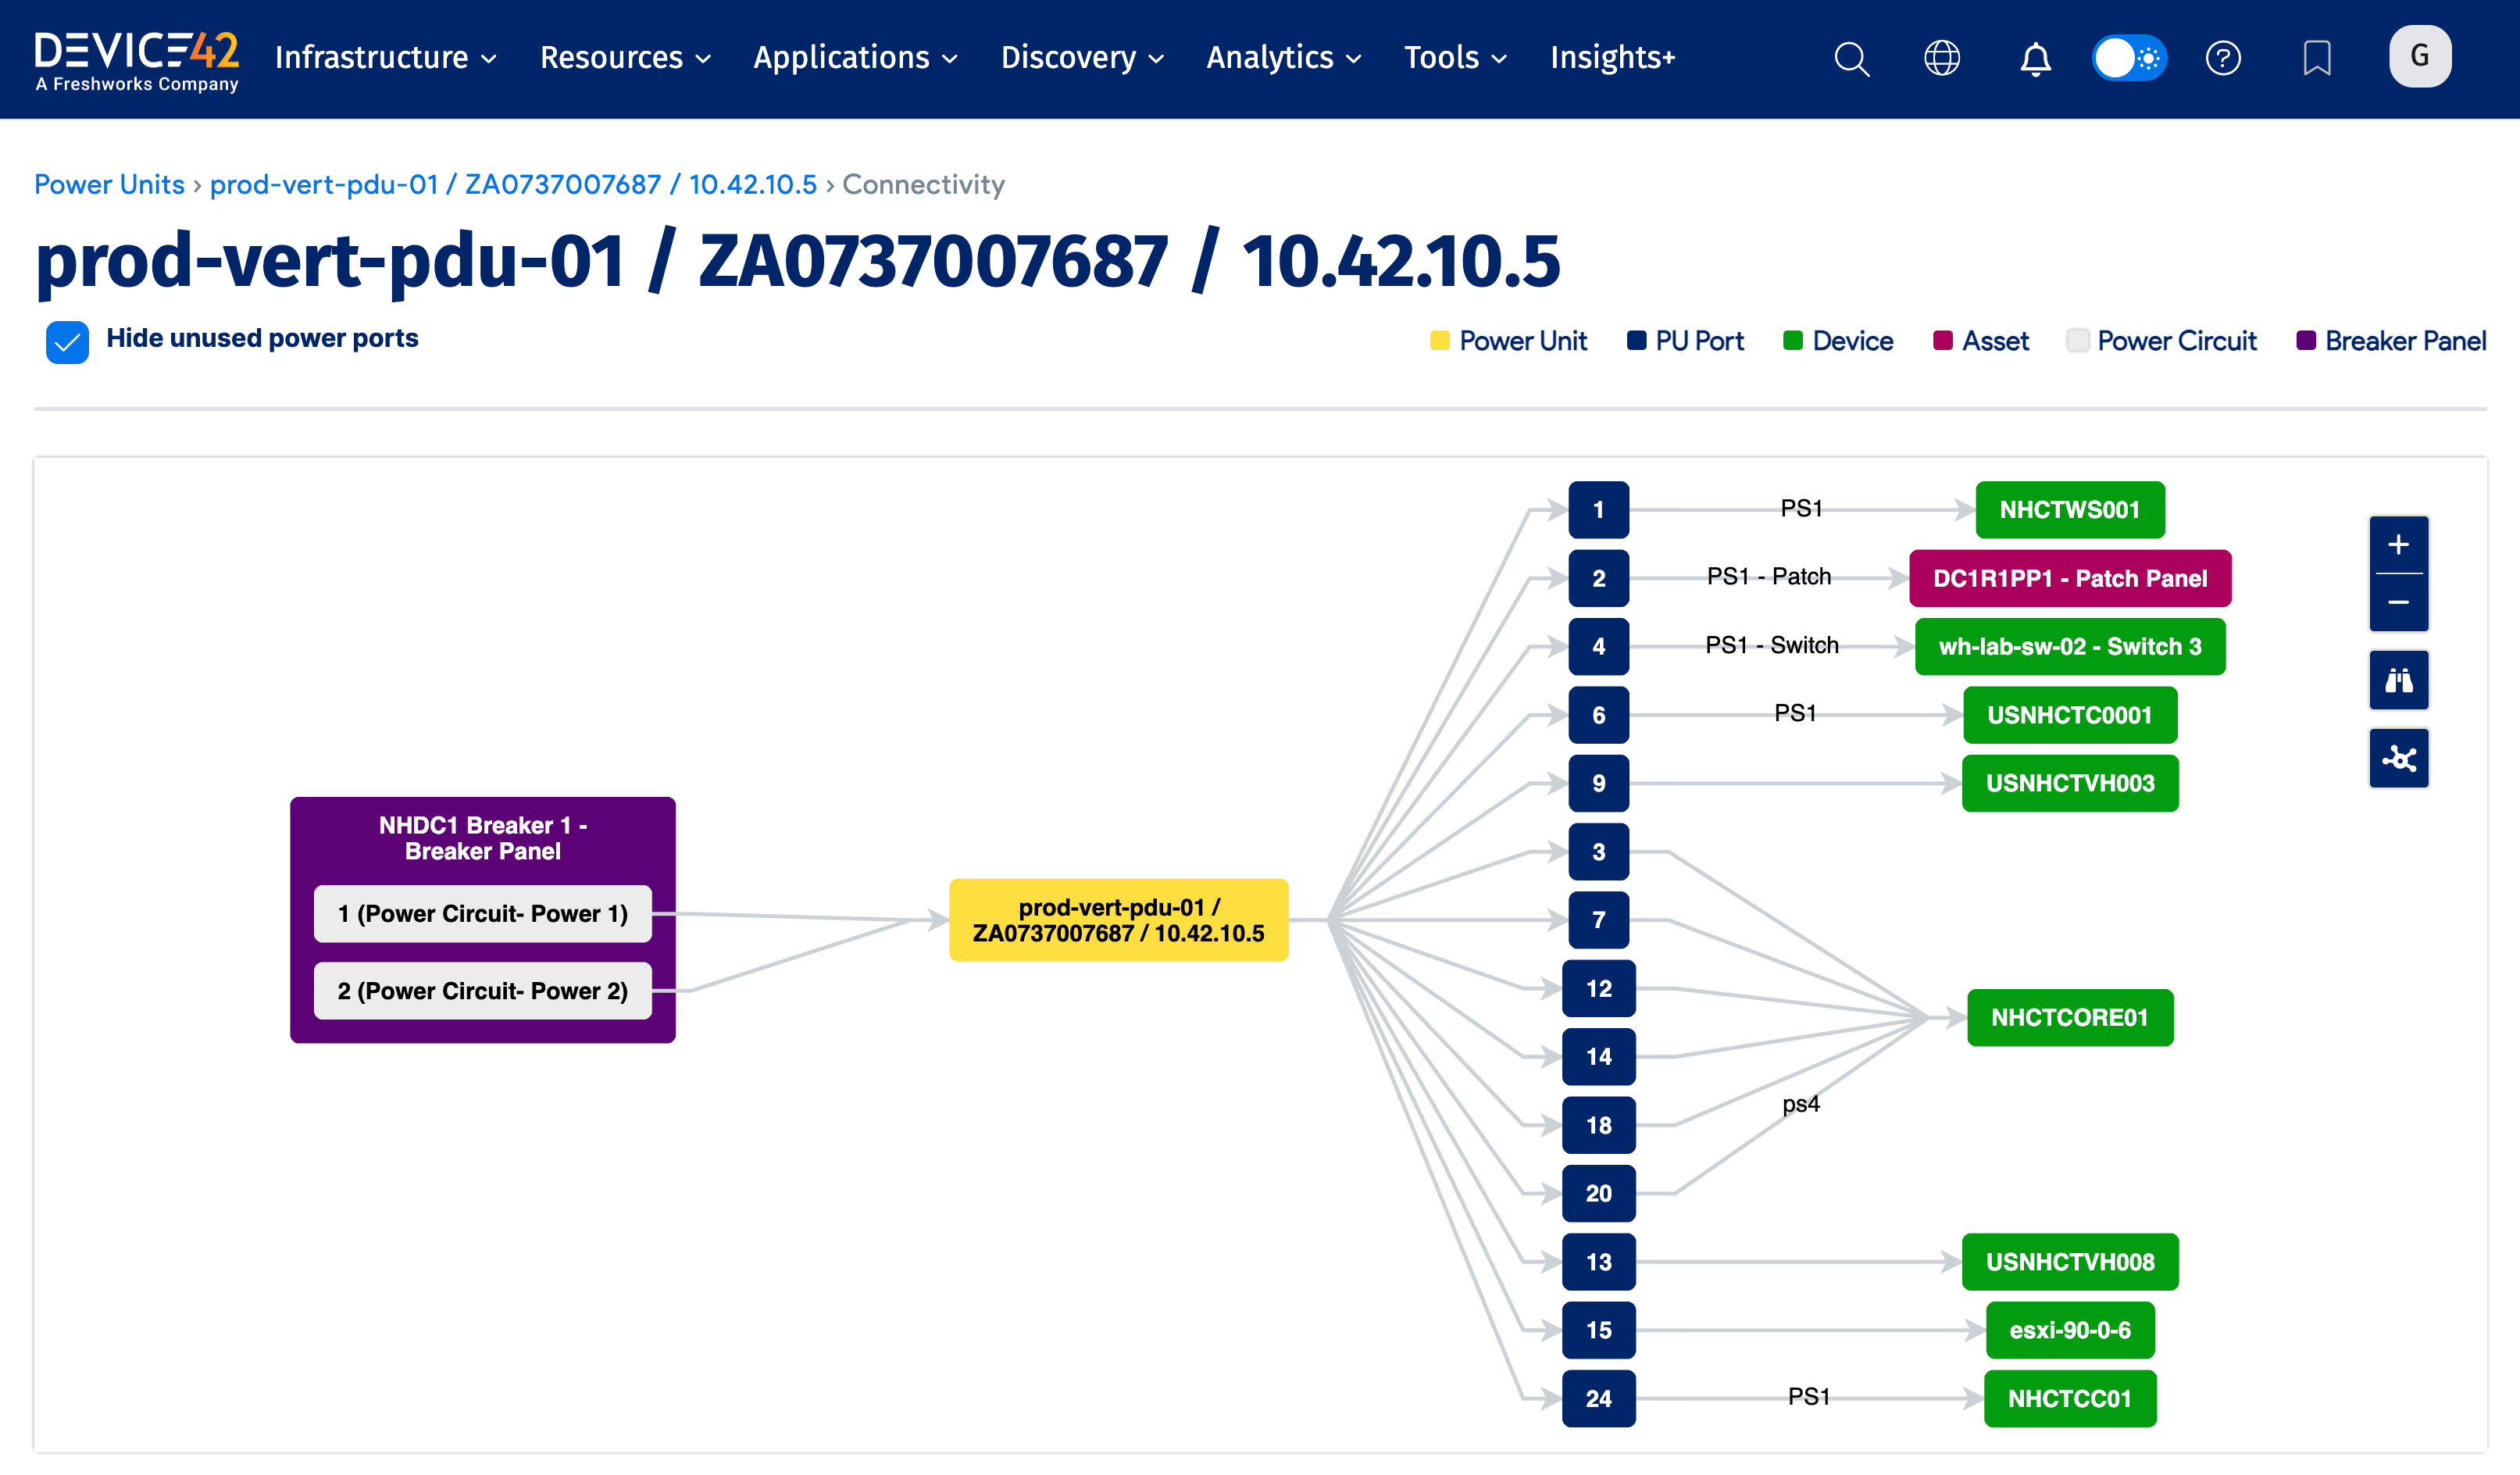
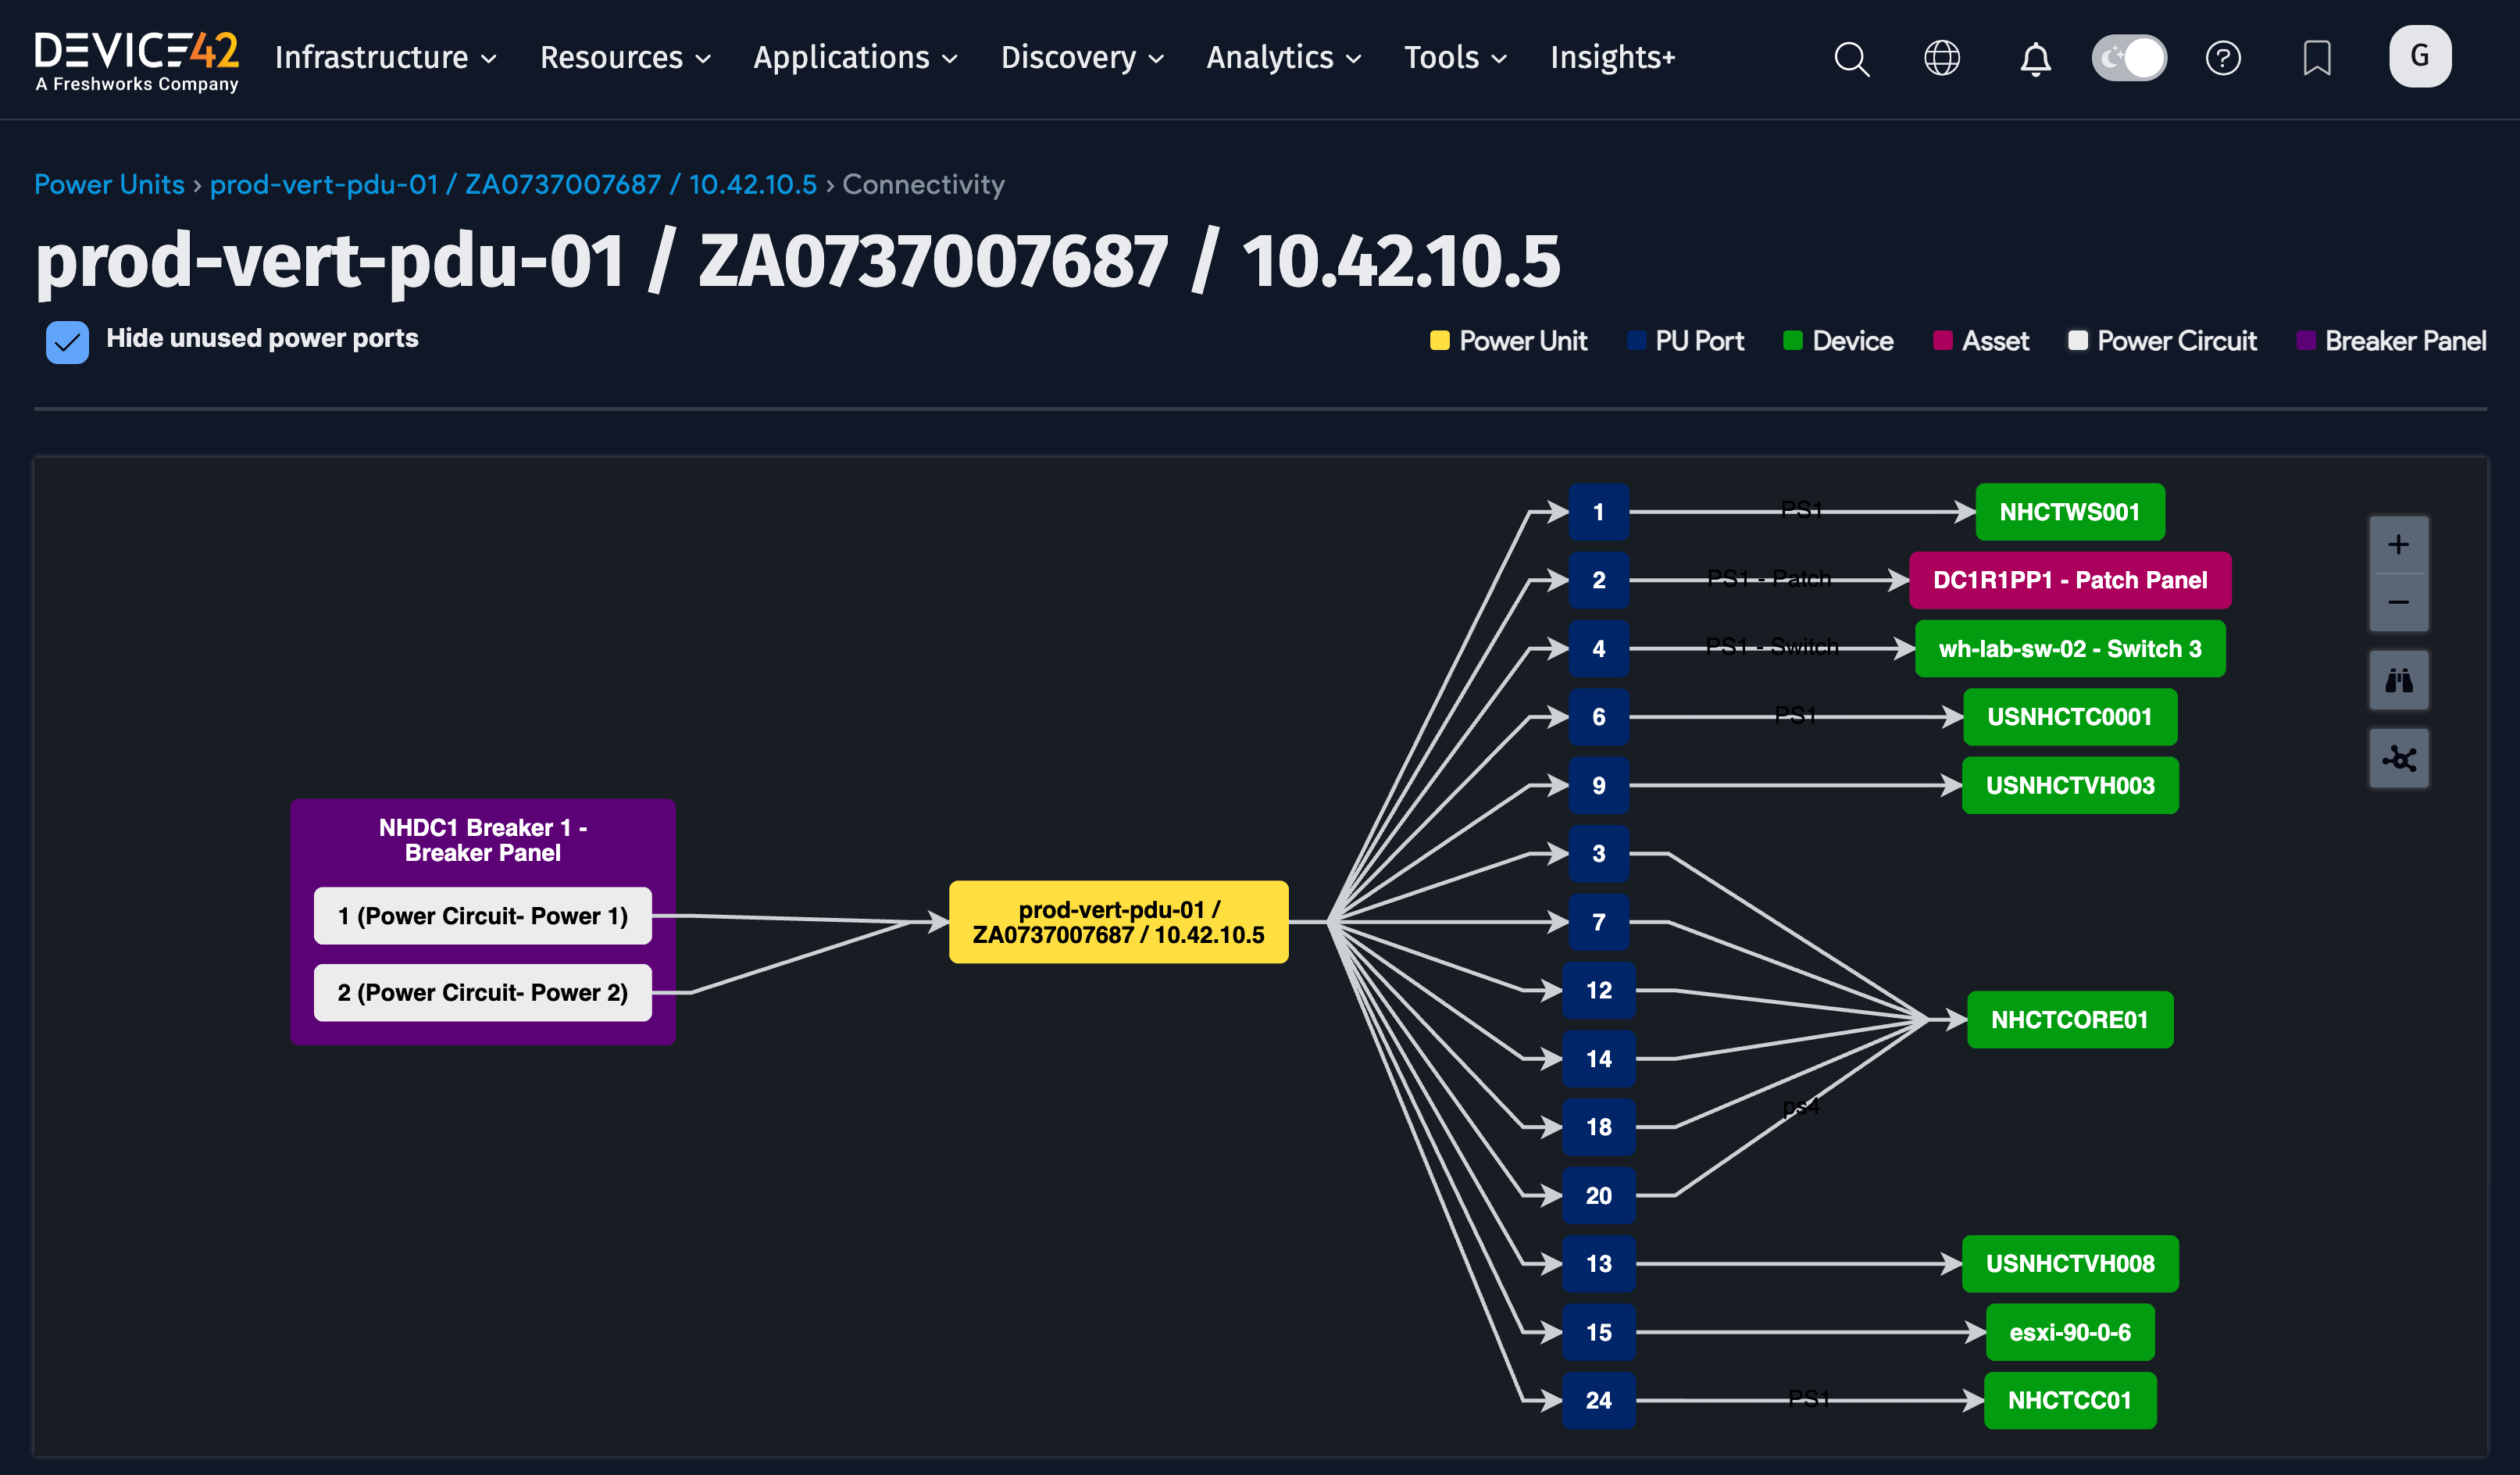
For each infeed and each outlet, you can see a Power Draw. This is the amount of power that was drawn by the infeed or outlet the last time the PDU was polled via SNMP. As mentioned earlier, you can set the polling interval via the Device42 main menu, Discovery > SNMP.
For the infeeds, the Rated Power is autodiscovered.
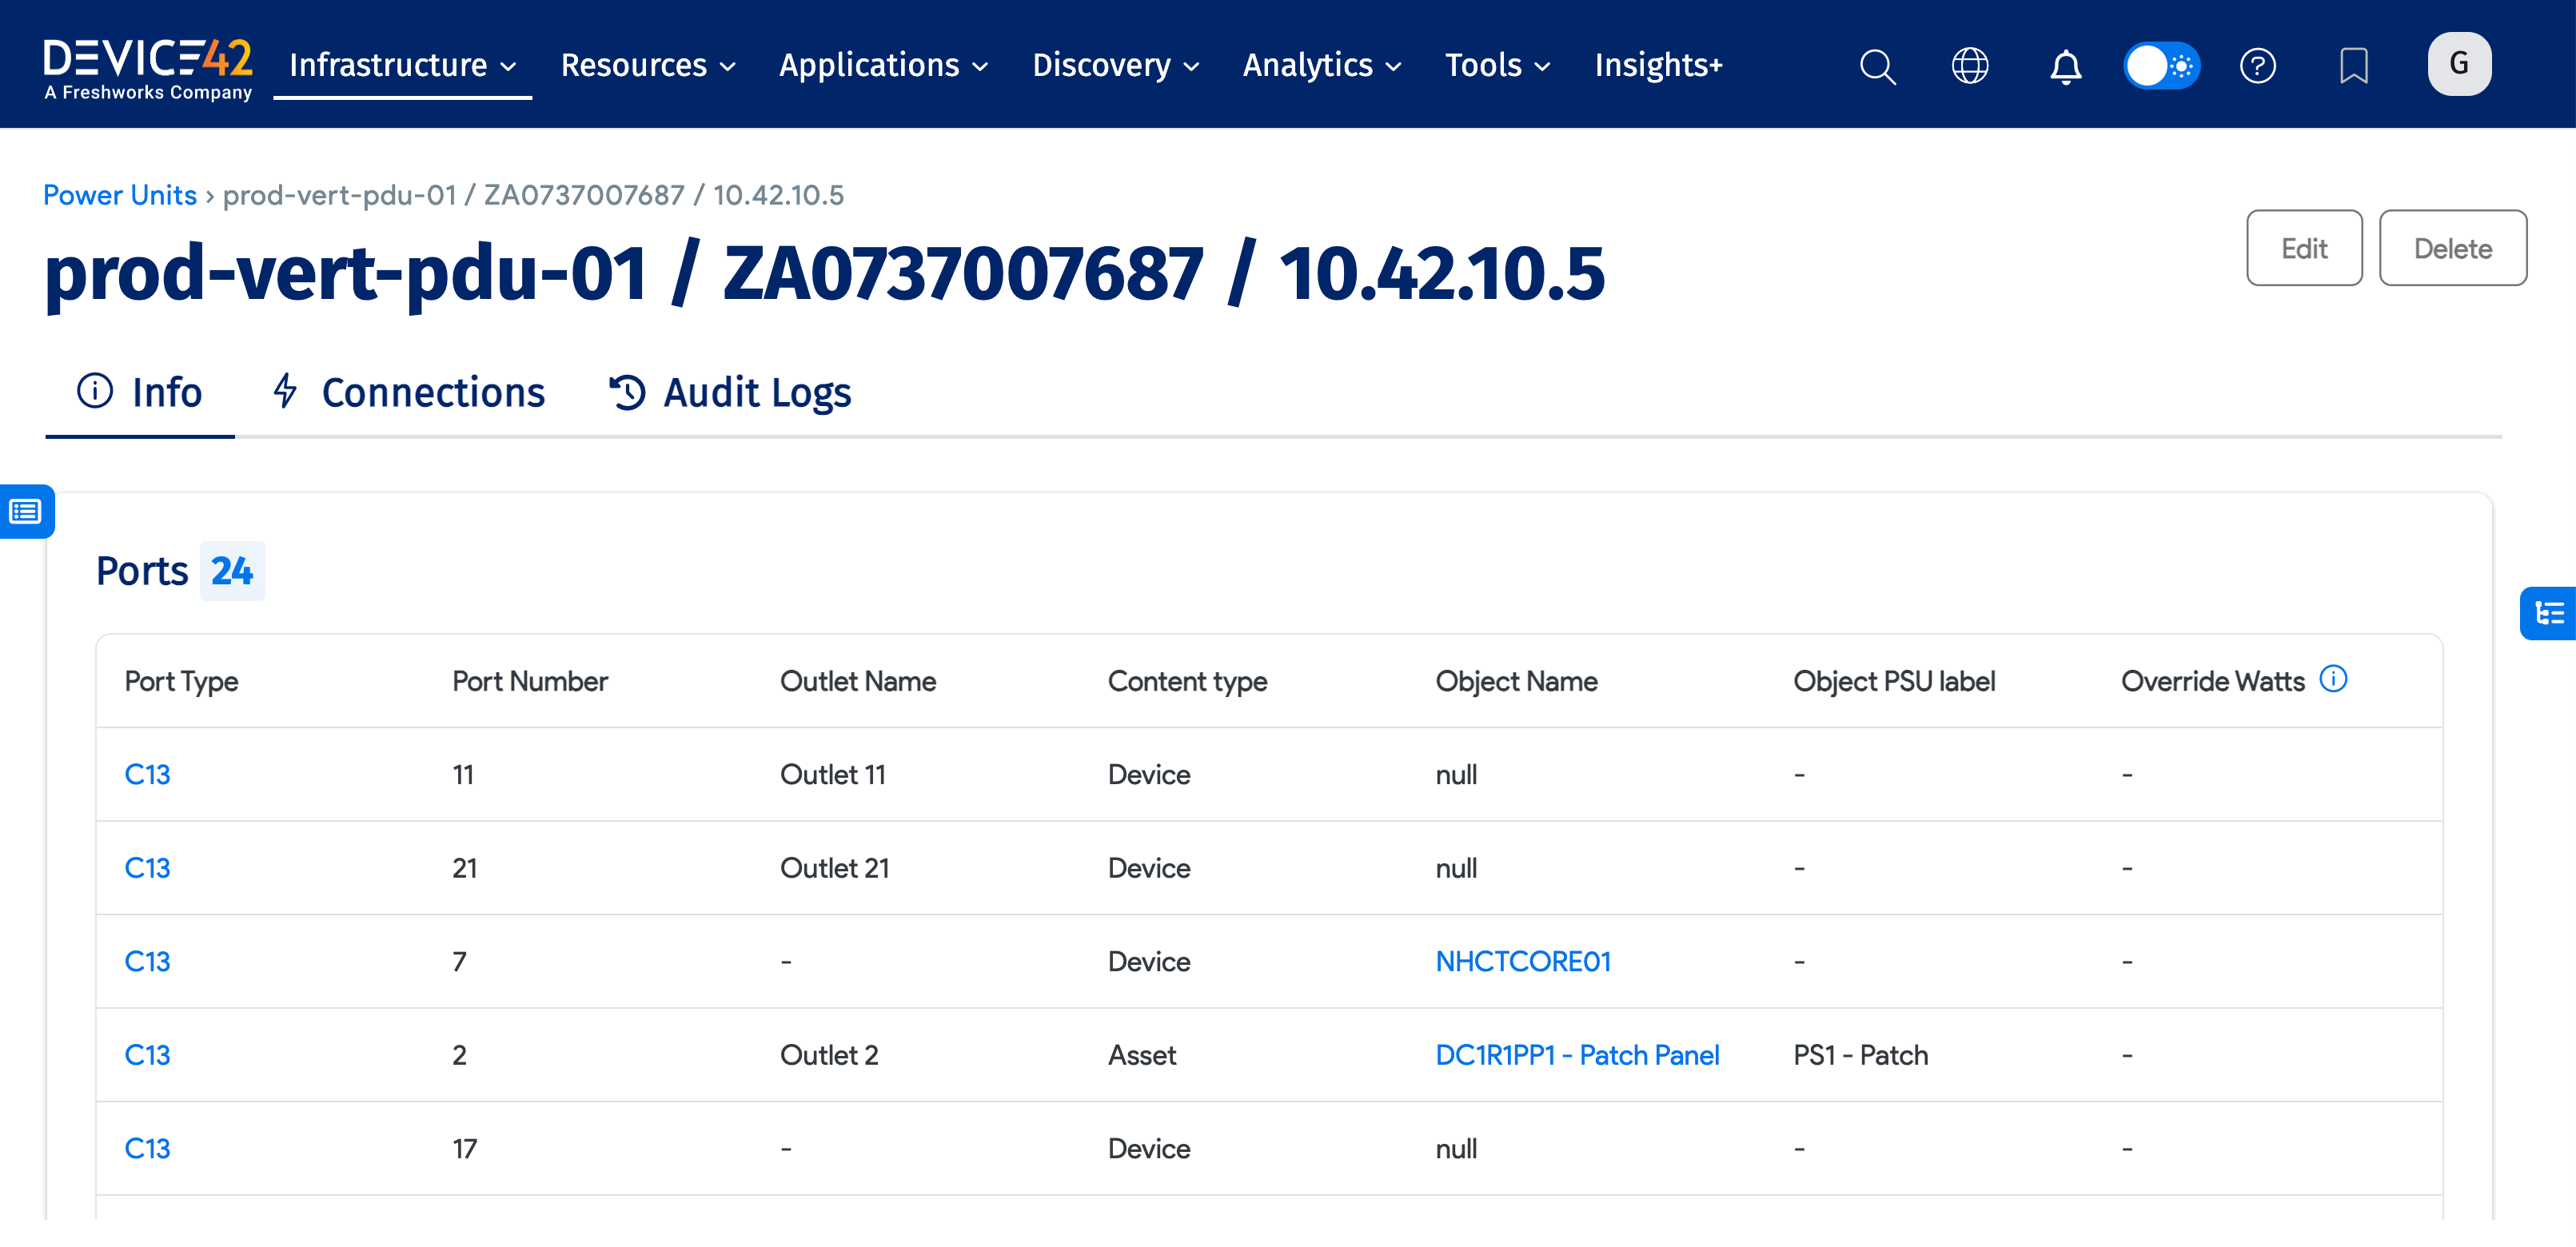
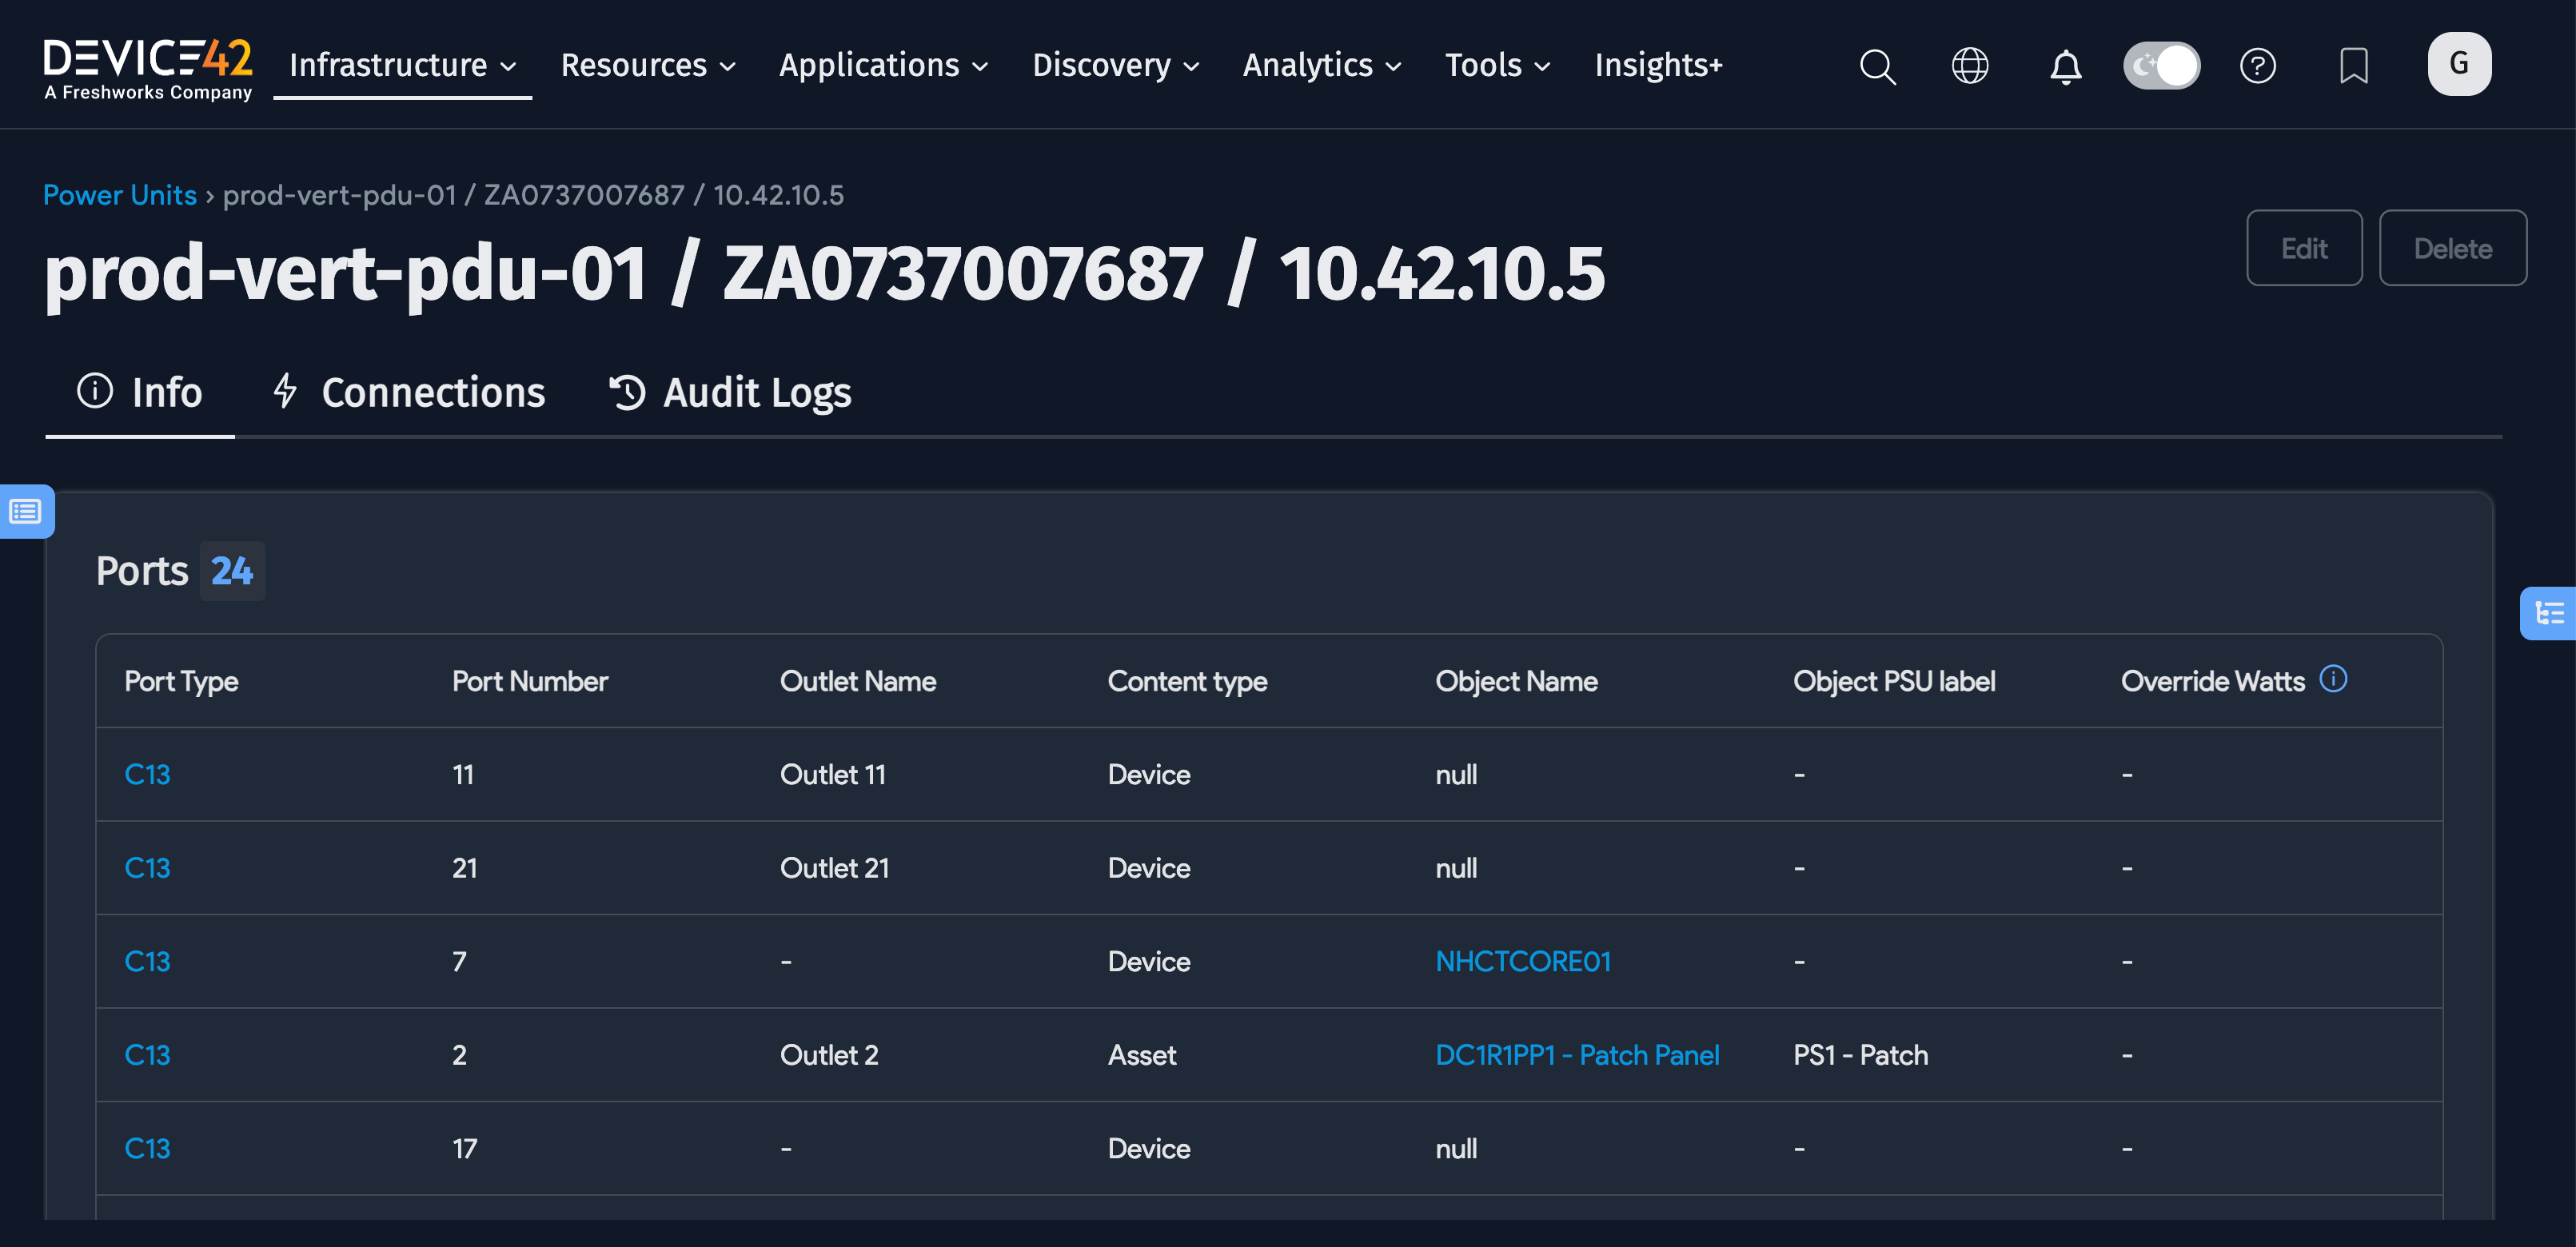
For each outlet, you can see the Override Watts and the Bootstrap Power, in addition to the Power Draw. The Bootstrap Power column shows the power required for this outlet at boot time. In the PDU header section at the top, the Bootstrap Power for the PDU is the sum of the Bootstrap Power for each of the outlets.
By default, the Bootstrap Power column will be empty if there is no device connected. If there is a device connected, by default, the Bootstrap Power will show the nameplate watts of the hardware model of the device. Sometimes, however, you may wish to use a different number for the Bootstrap Power. If so, you would enter that number in the Override Watts field. In the example above, the user has entered 30 watts as the Override Watts for each of the outlets above. There are no connected devices in the above example; however, even if there were connected devices, Override Watts would still be the value used for the Bootstrap Power column. You can also have a mix of outlets, where some outlets get their Bootstrap Power from the device hardware model and some have an Override Watts value.
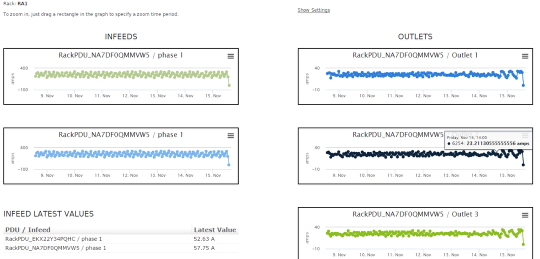
If you click the Power tab for the PDU, you will see tables and graphs showing the historical power details for the in-feeds and outlets.
For the rack detail power page discussed above, you can click Show Settings to see historical charts and the minimum, maximum, and average calculations.