Advanced Reporting
We are primarily invested in Standard Reports and Insights+ and encourage customers to use those first.
Advanced Reporting Engine Overview
Device42's Advanced Reporting engine is a quantum leap forward in functionality. It is a fully incorporated, schedulable BI or reporting platform that lets you create both ad-hoc reports that may include visualizations, and export the output in different formats as desired. A changing selection of predefined reports is included with Advanced Reporting, while an unlimited number may be added under User-Defined reports, exported, imported, and shared!
Head to Analytics > Reports > Advanced Reporting to get started:
Device42's Advanced Reporting engine is extremely flexible, and you can use it to take your reporting to the next level, extracting insight and business intelligence from your infrastructure data.
In this section, you'll learn how to select data and build reports in advanced reporting. If you prefer a video, see this advanced reporting blog post for a quick advanced reporting walkthrough!
Running an existing report
Running an existing report in advanced reporting is fast and easy.
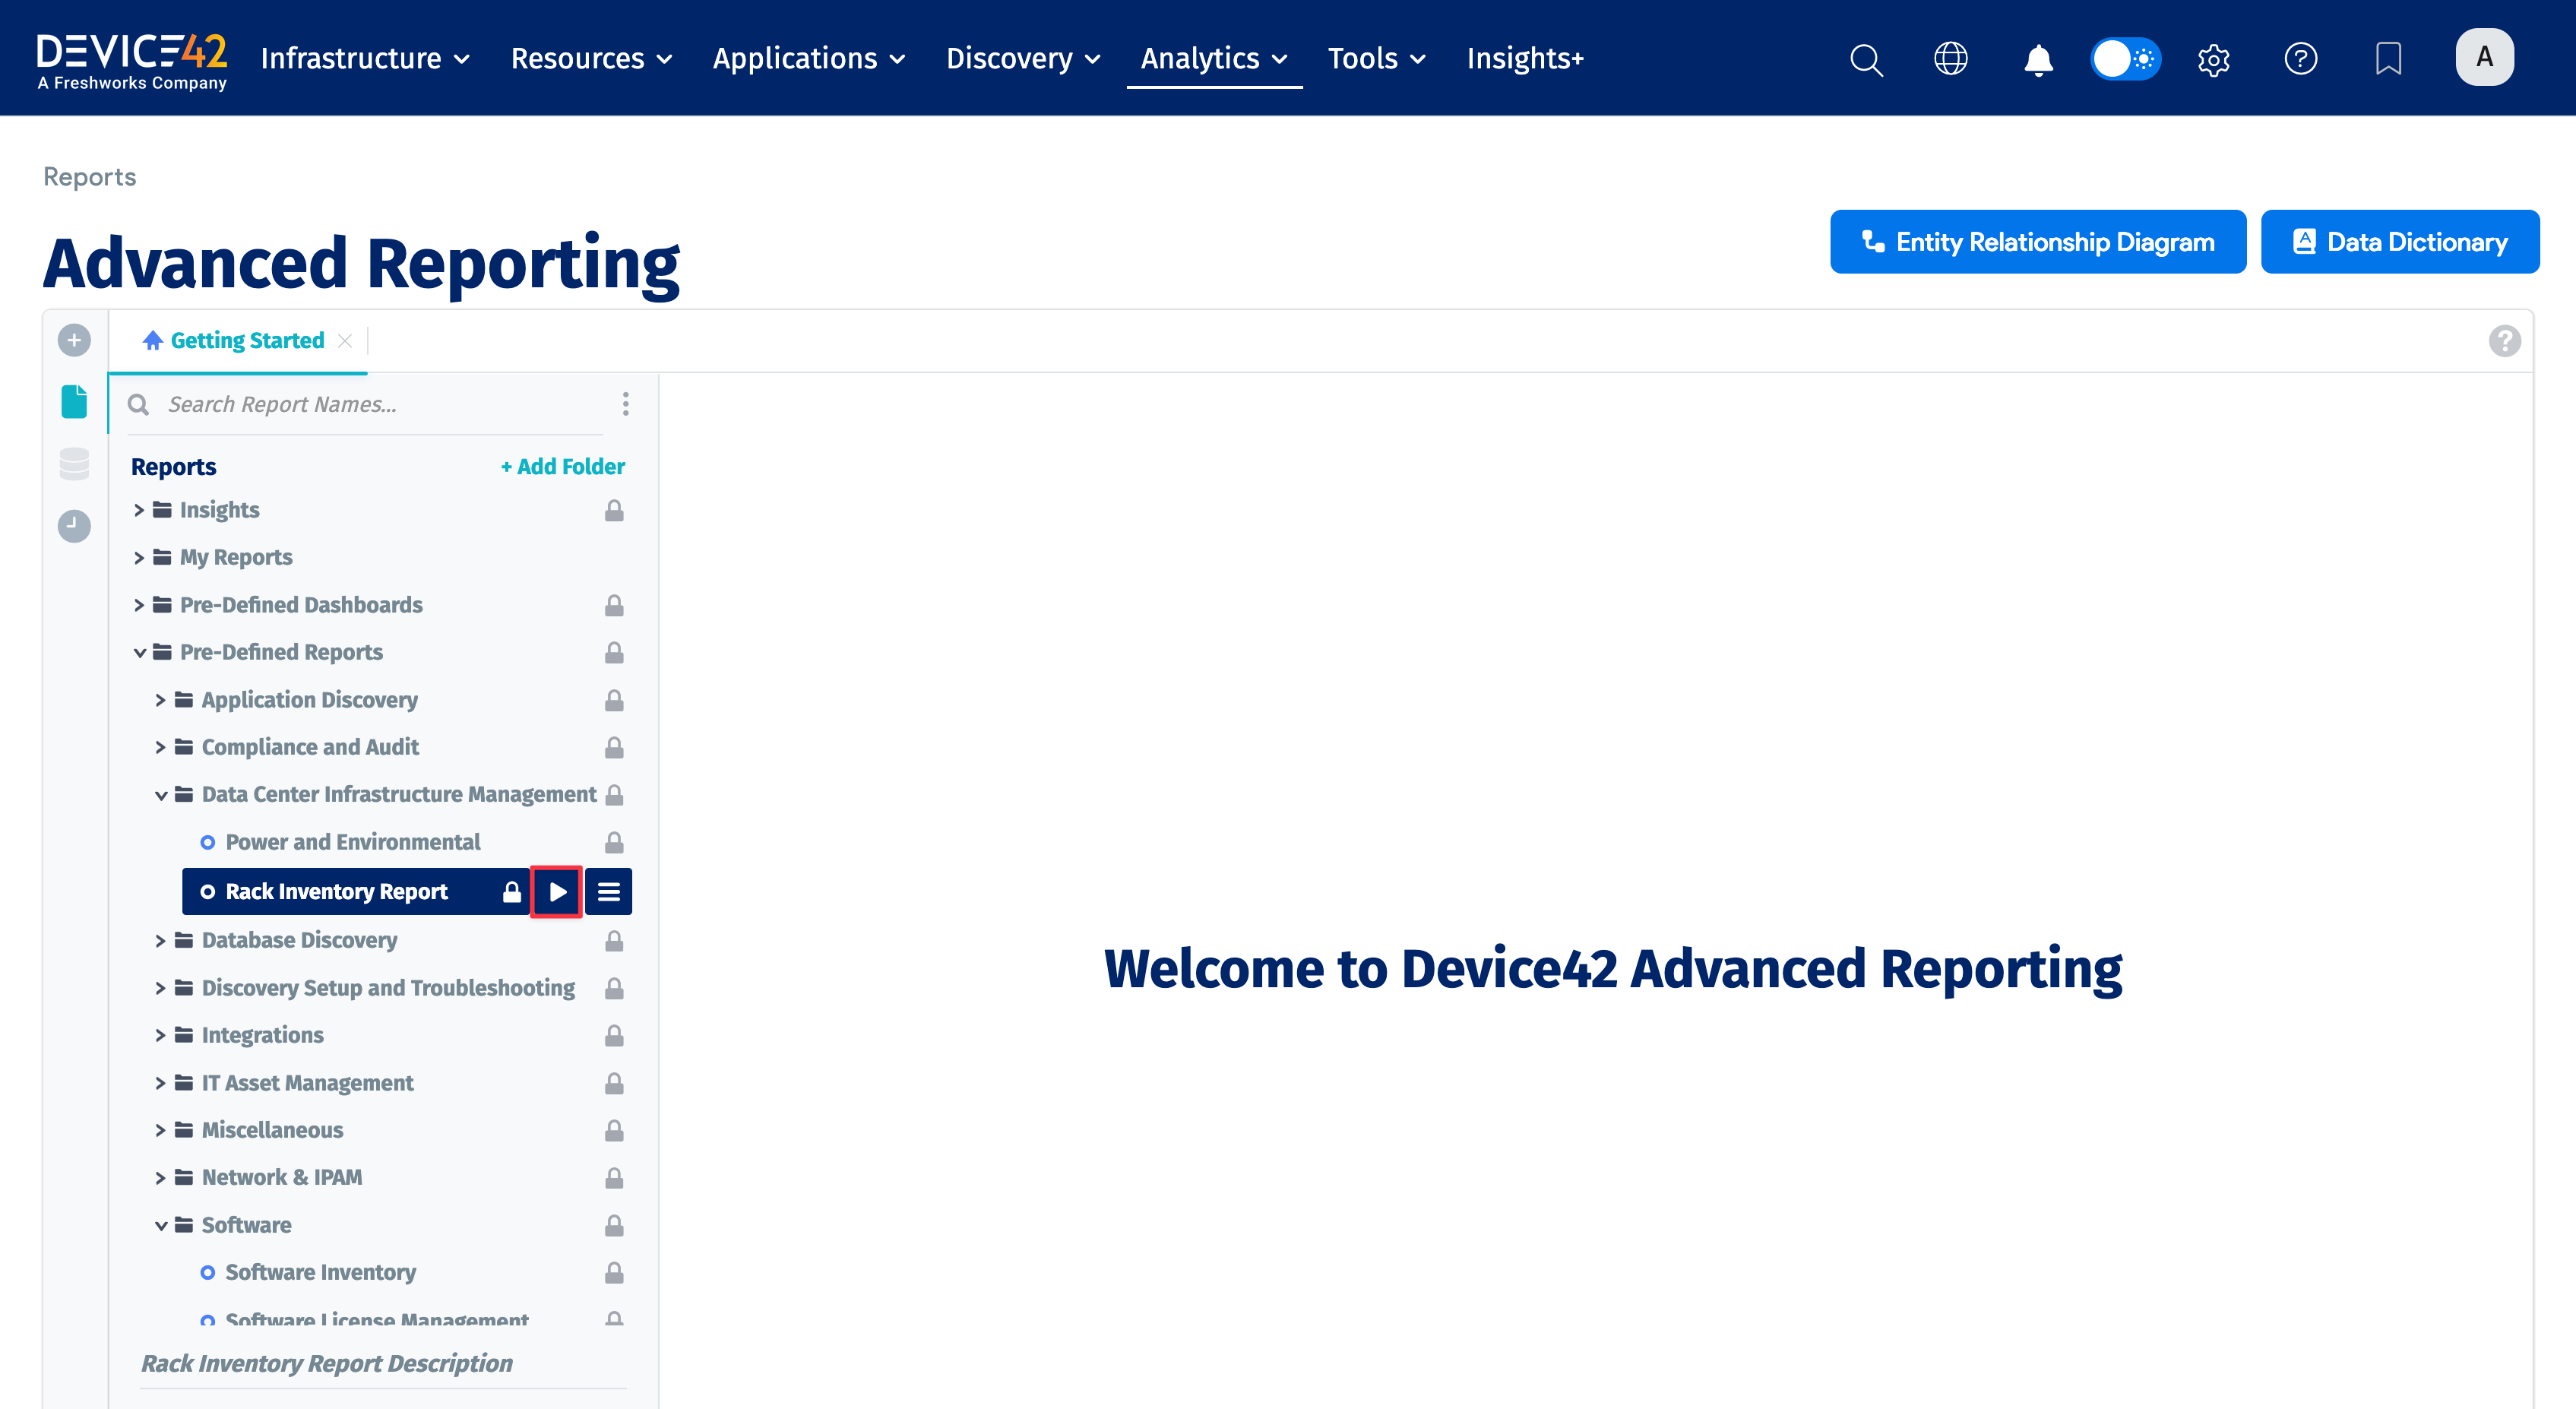
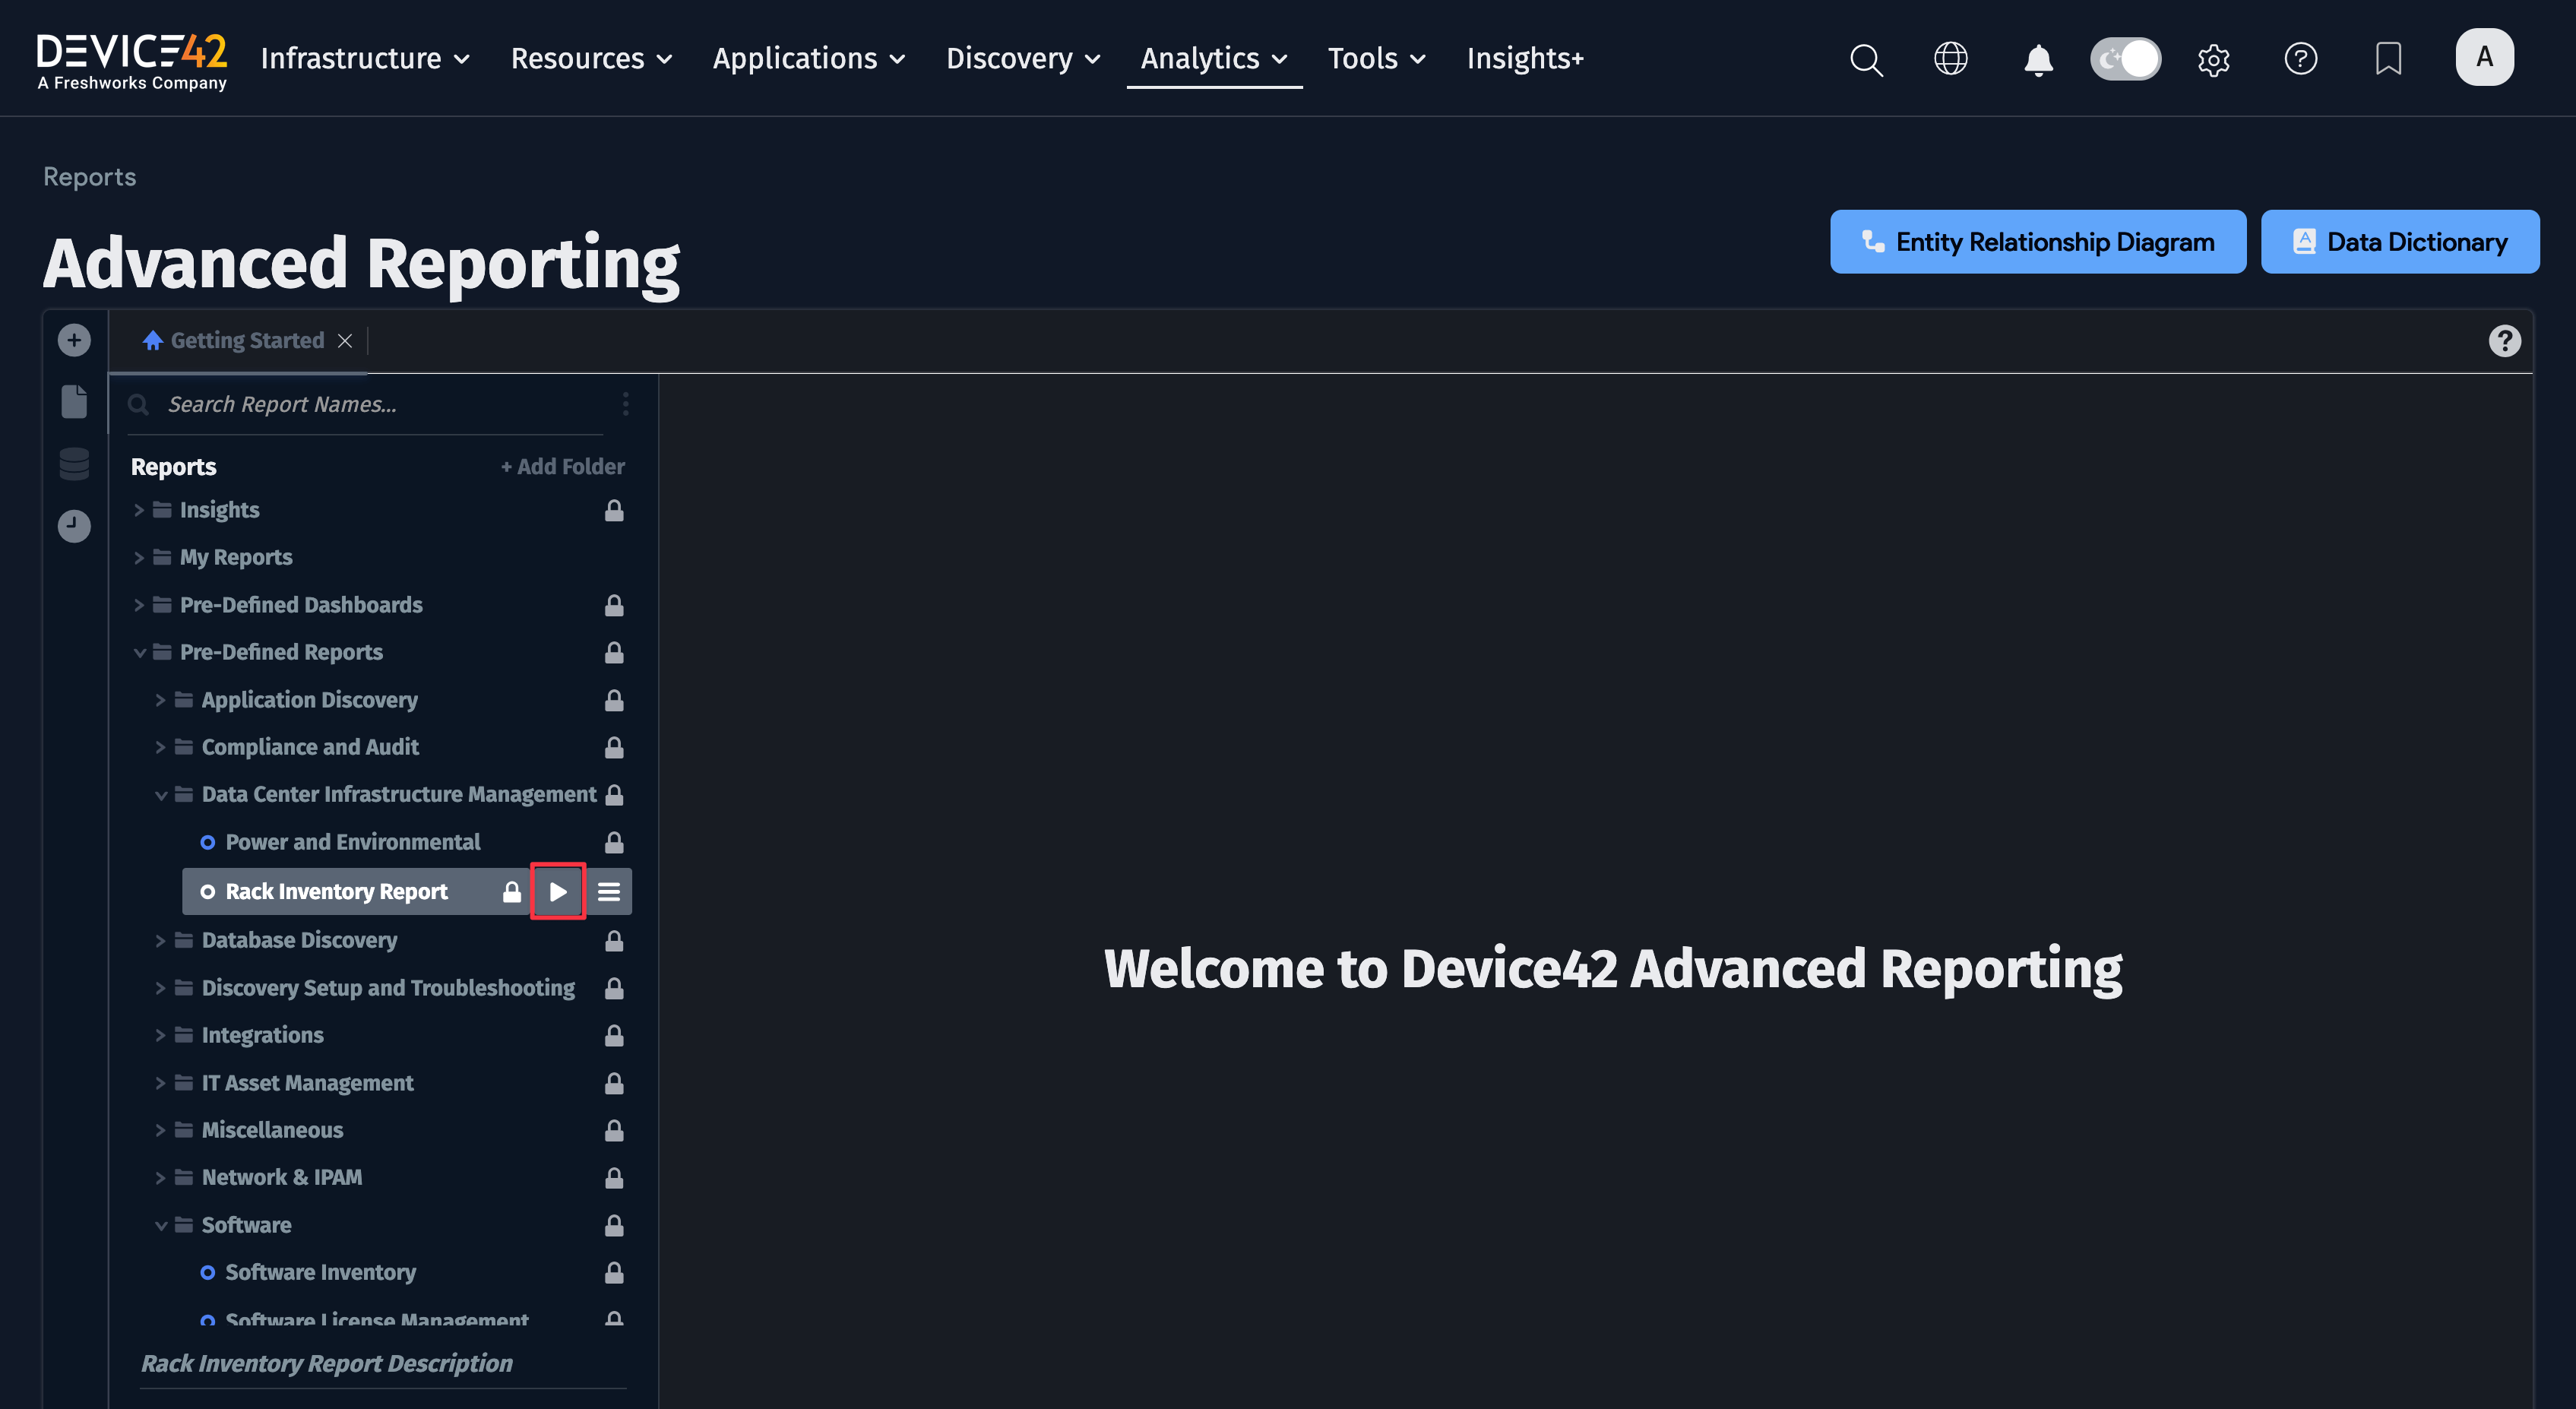
Head to Analytics > Reports > Advanced Reporting and expand Pre-defined reports on the left by clicking the arrow to show the list of existing reports.
-
Choose a report from the list, highlight it, and click the play icon to run the report.
-
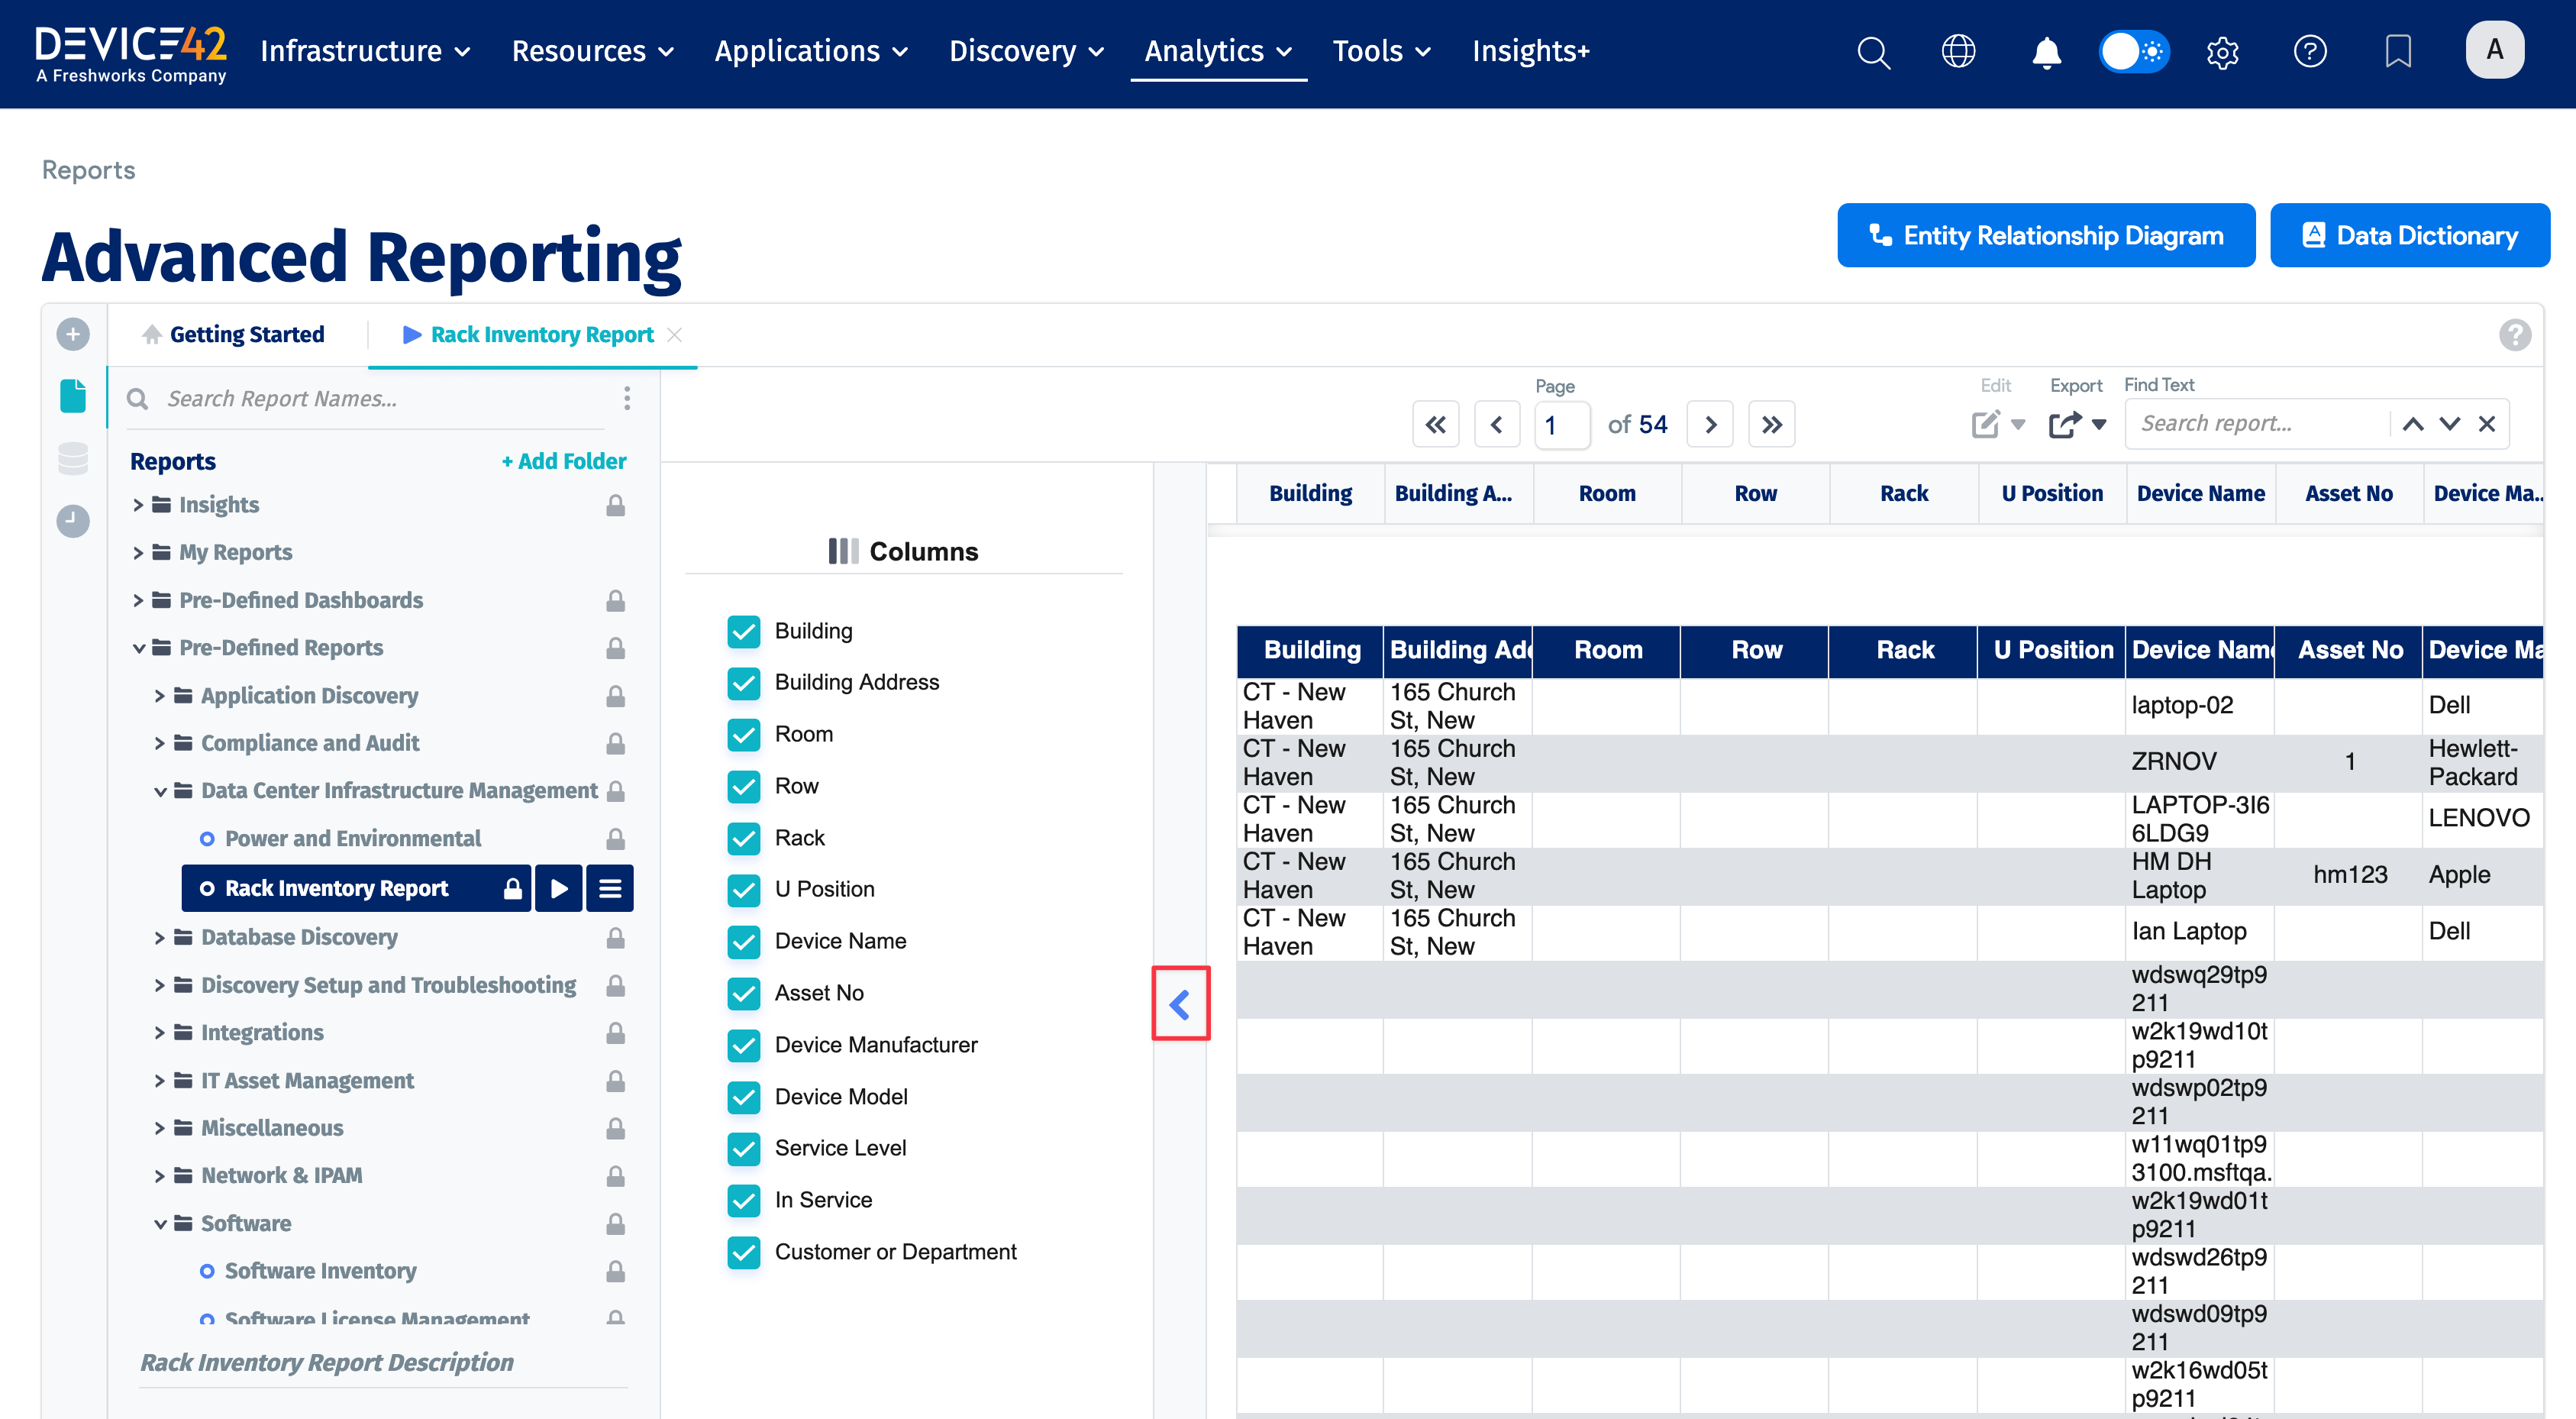
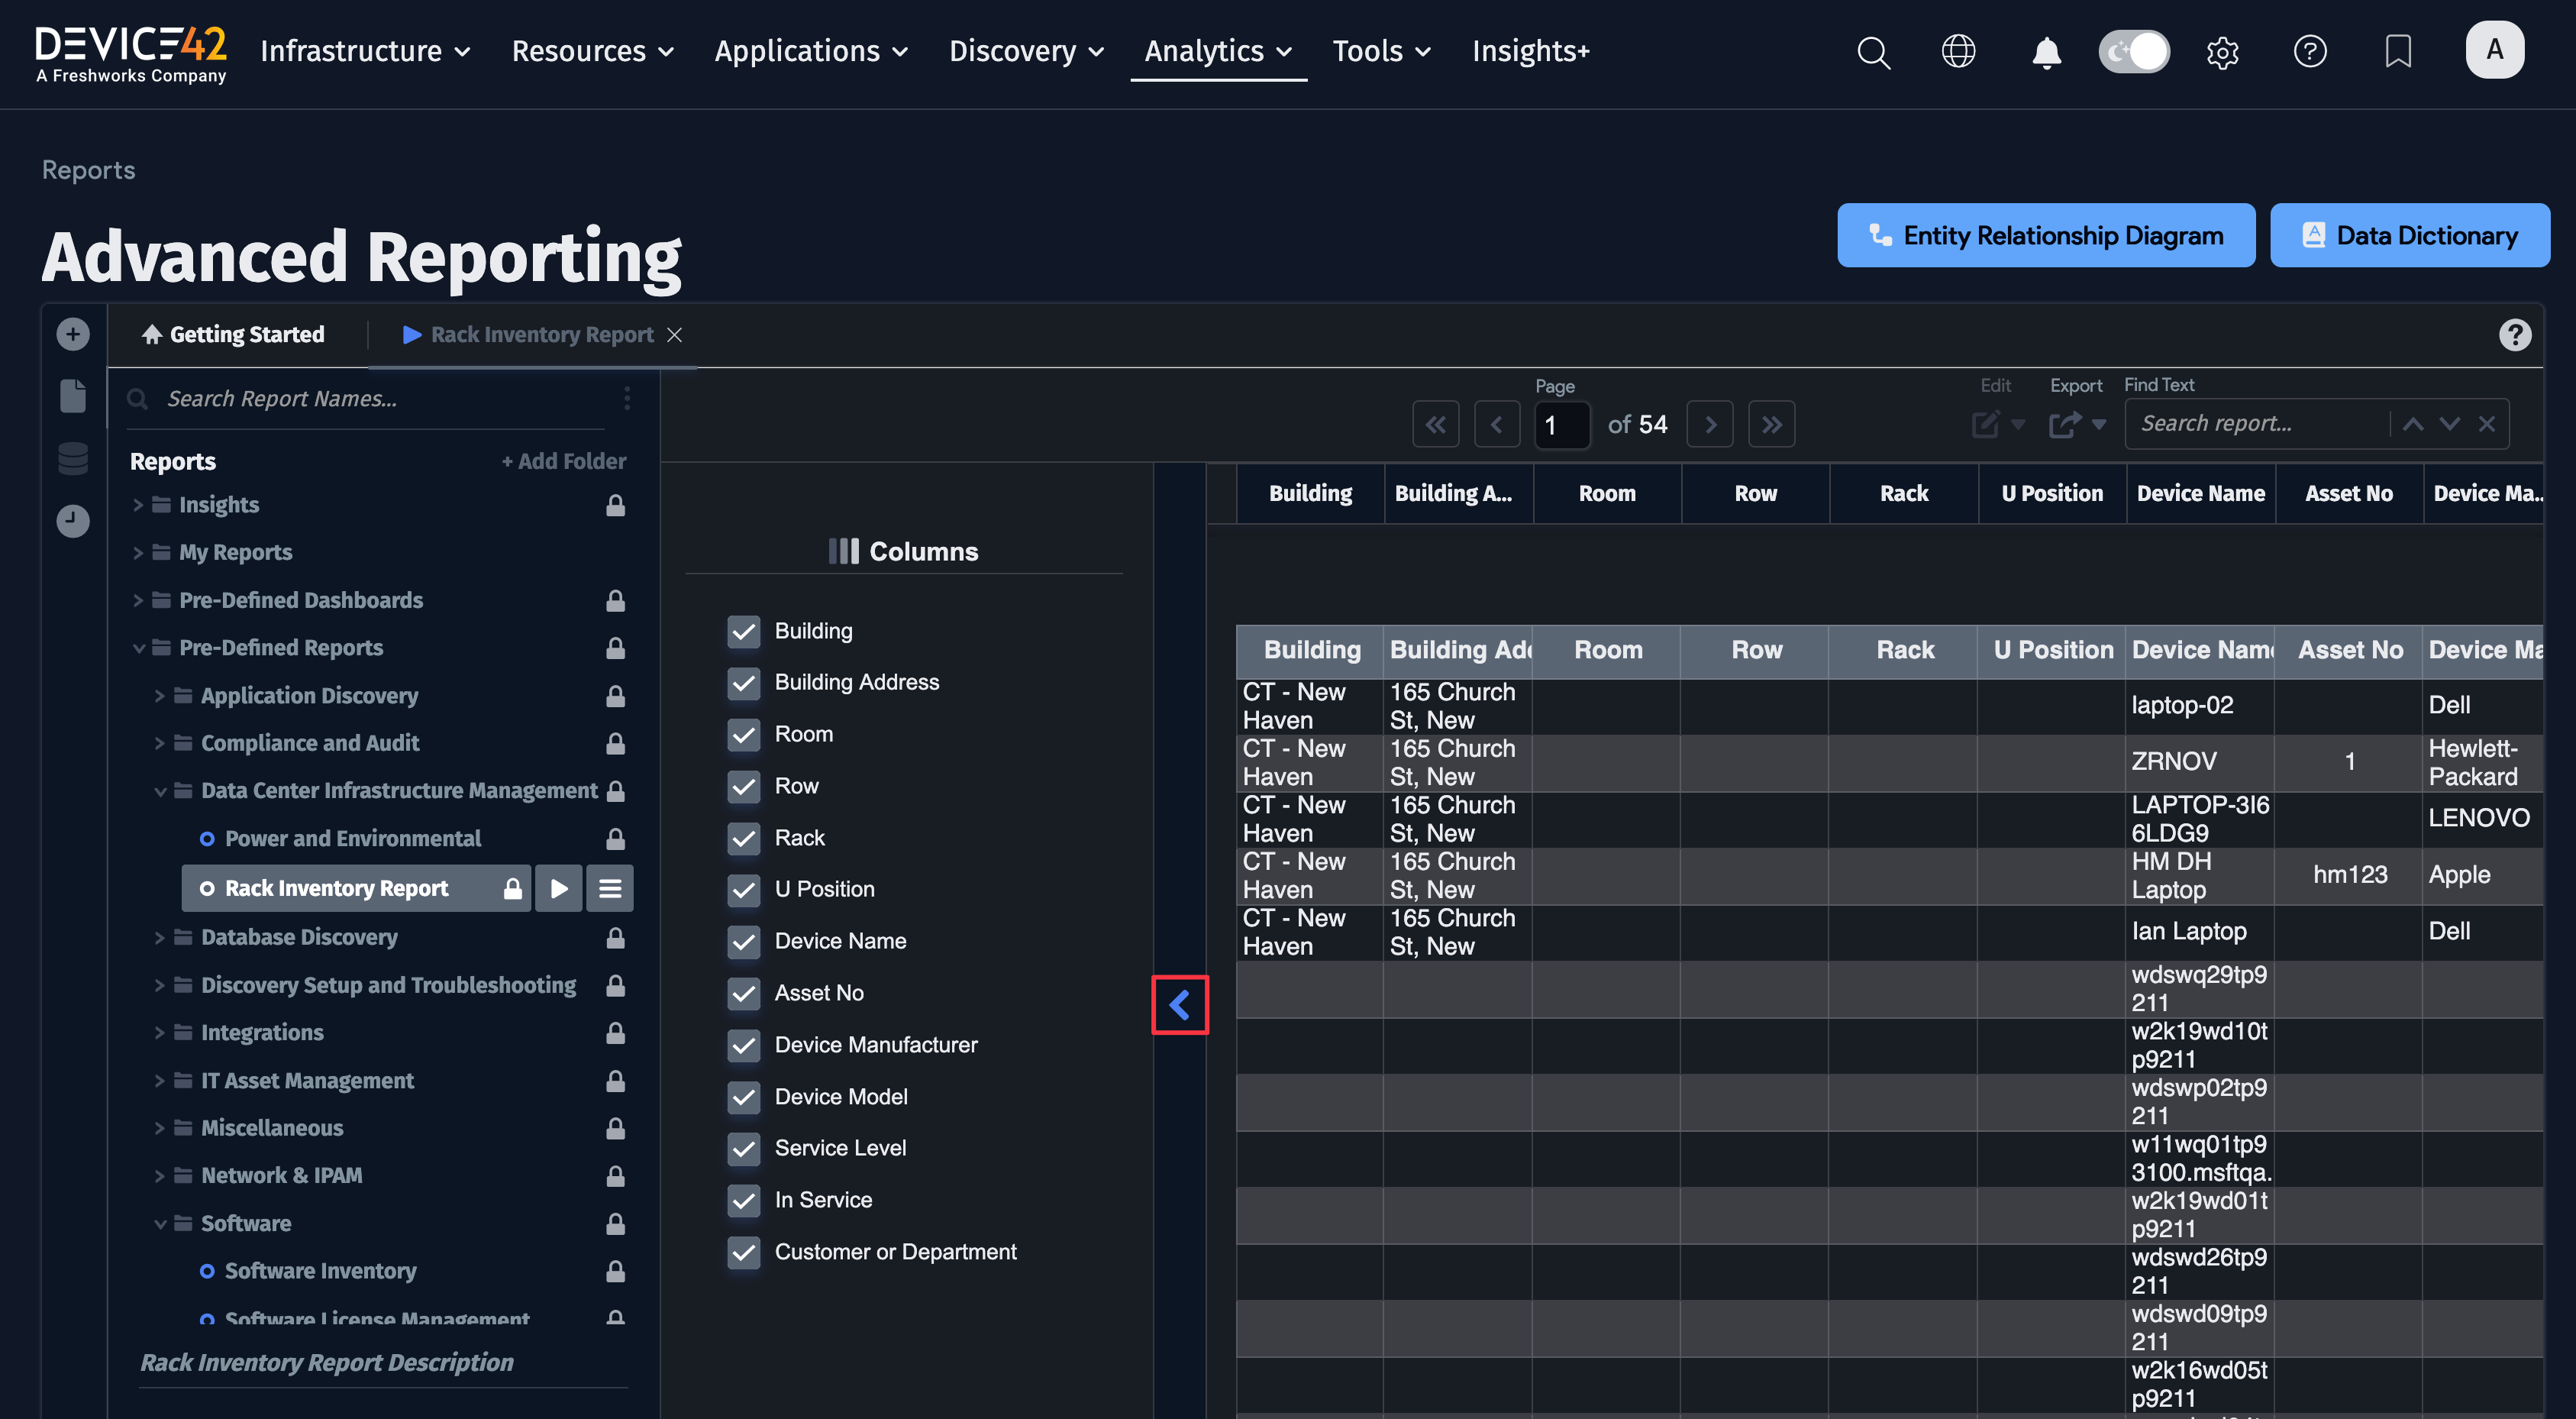
De-select columns from the predefined report by clicking the right arrow to reveal the column selection panel.
-
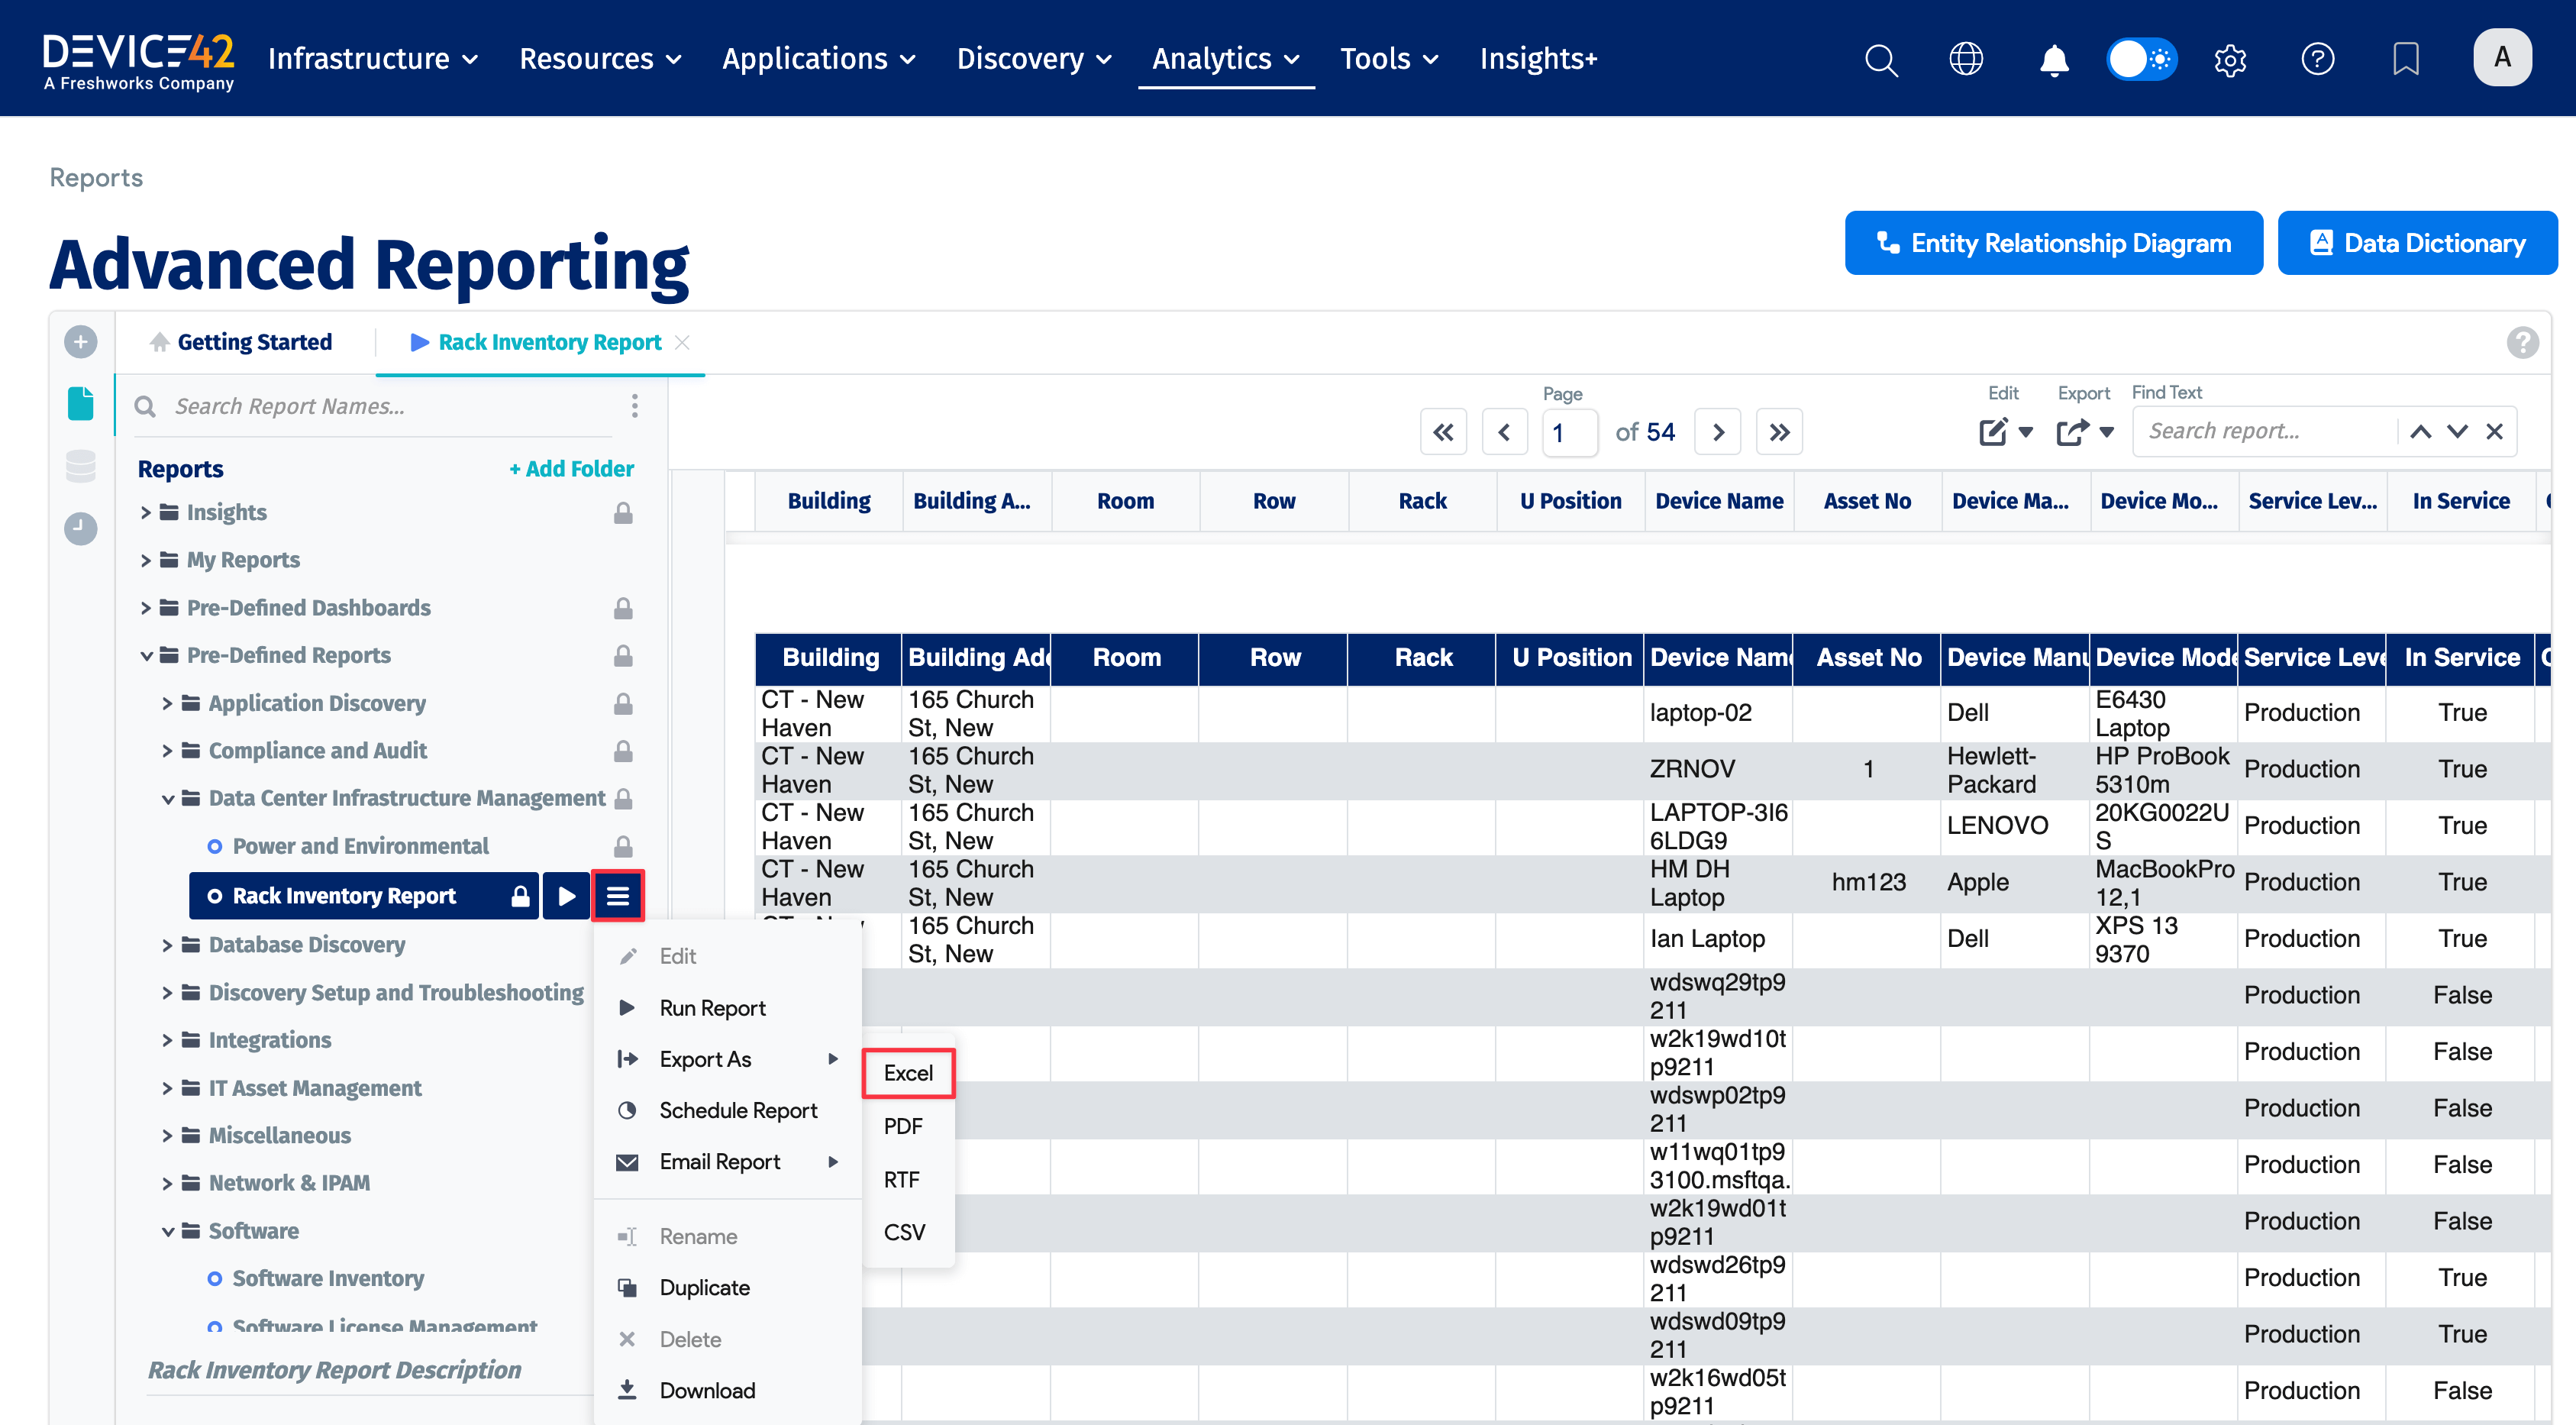
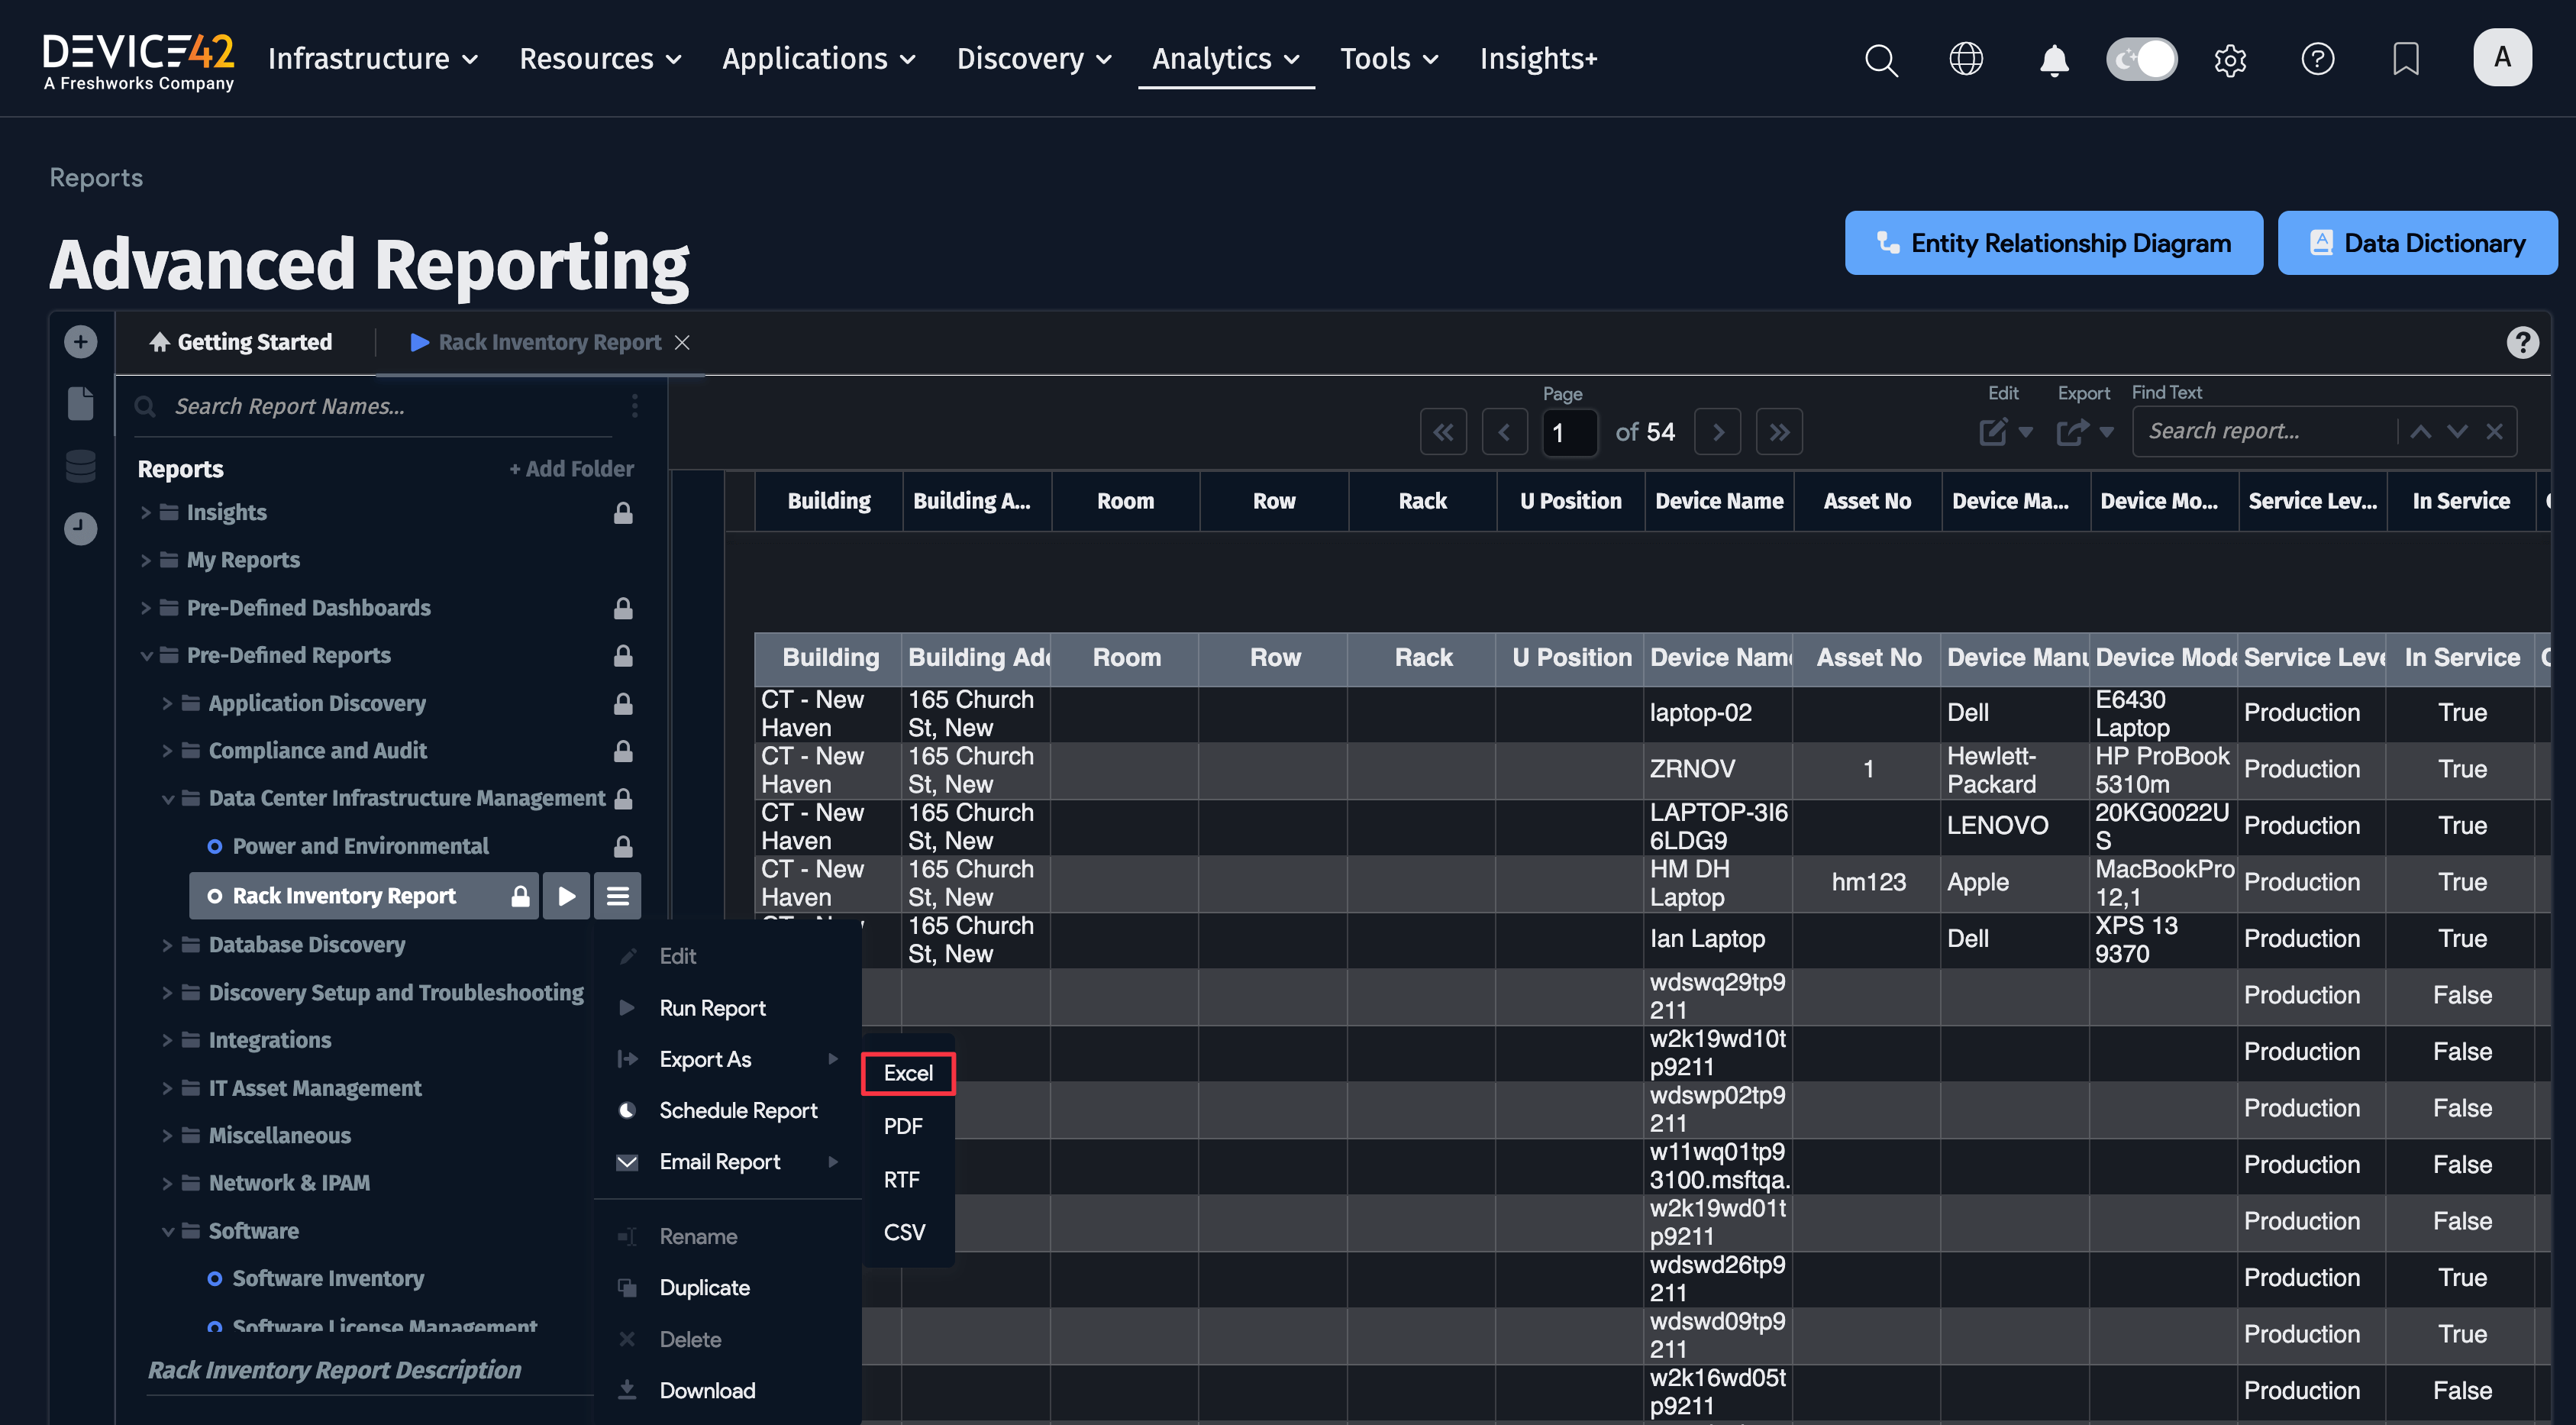
To have your report results exported in a Microsoft Excel (.xls) format spreadsheet, select the Export As > Excel from the hamburger menu (three horizontal lines).
Customizing an existing report
Customizing an existing report is easy! Simply make a copy and edit the copy, or double-click any user-created report to edit it directly.
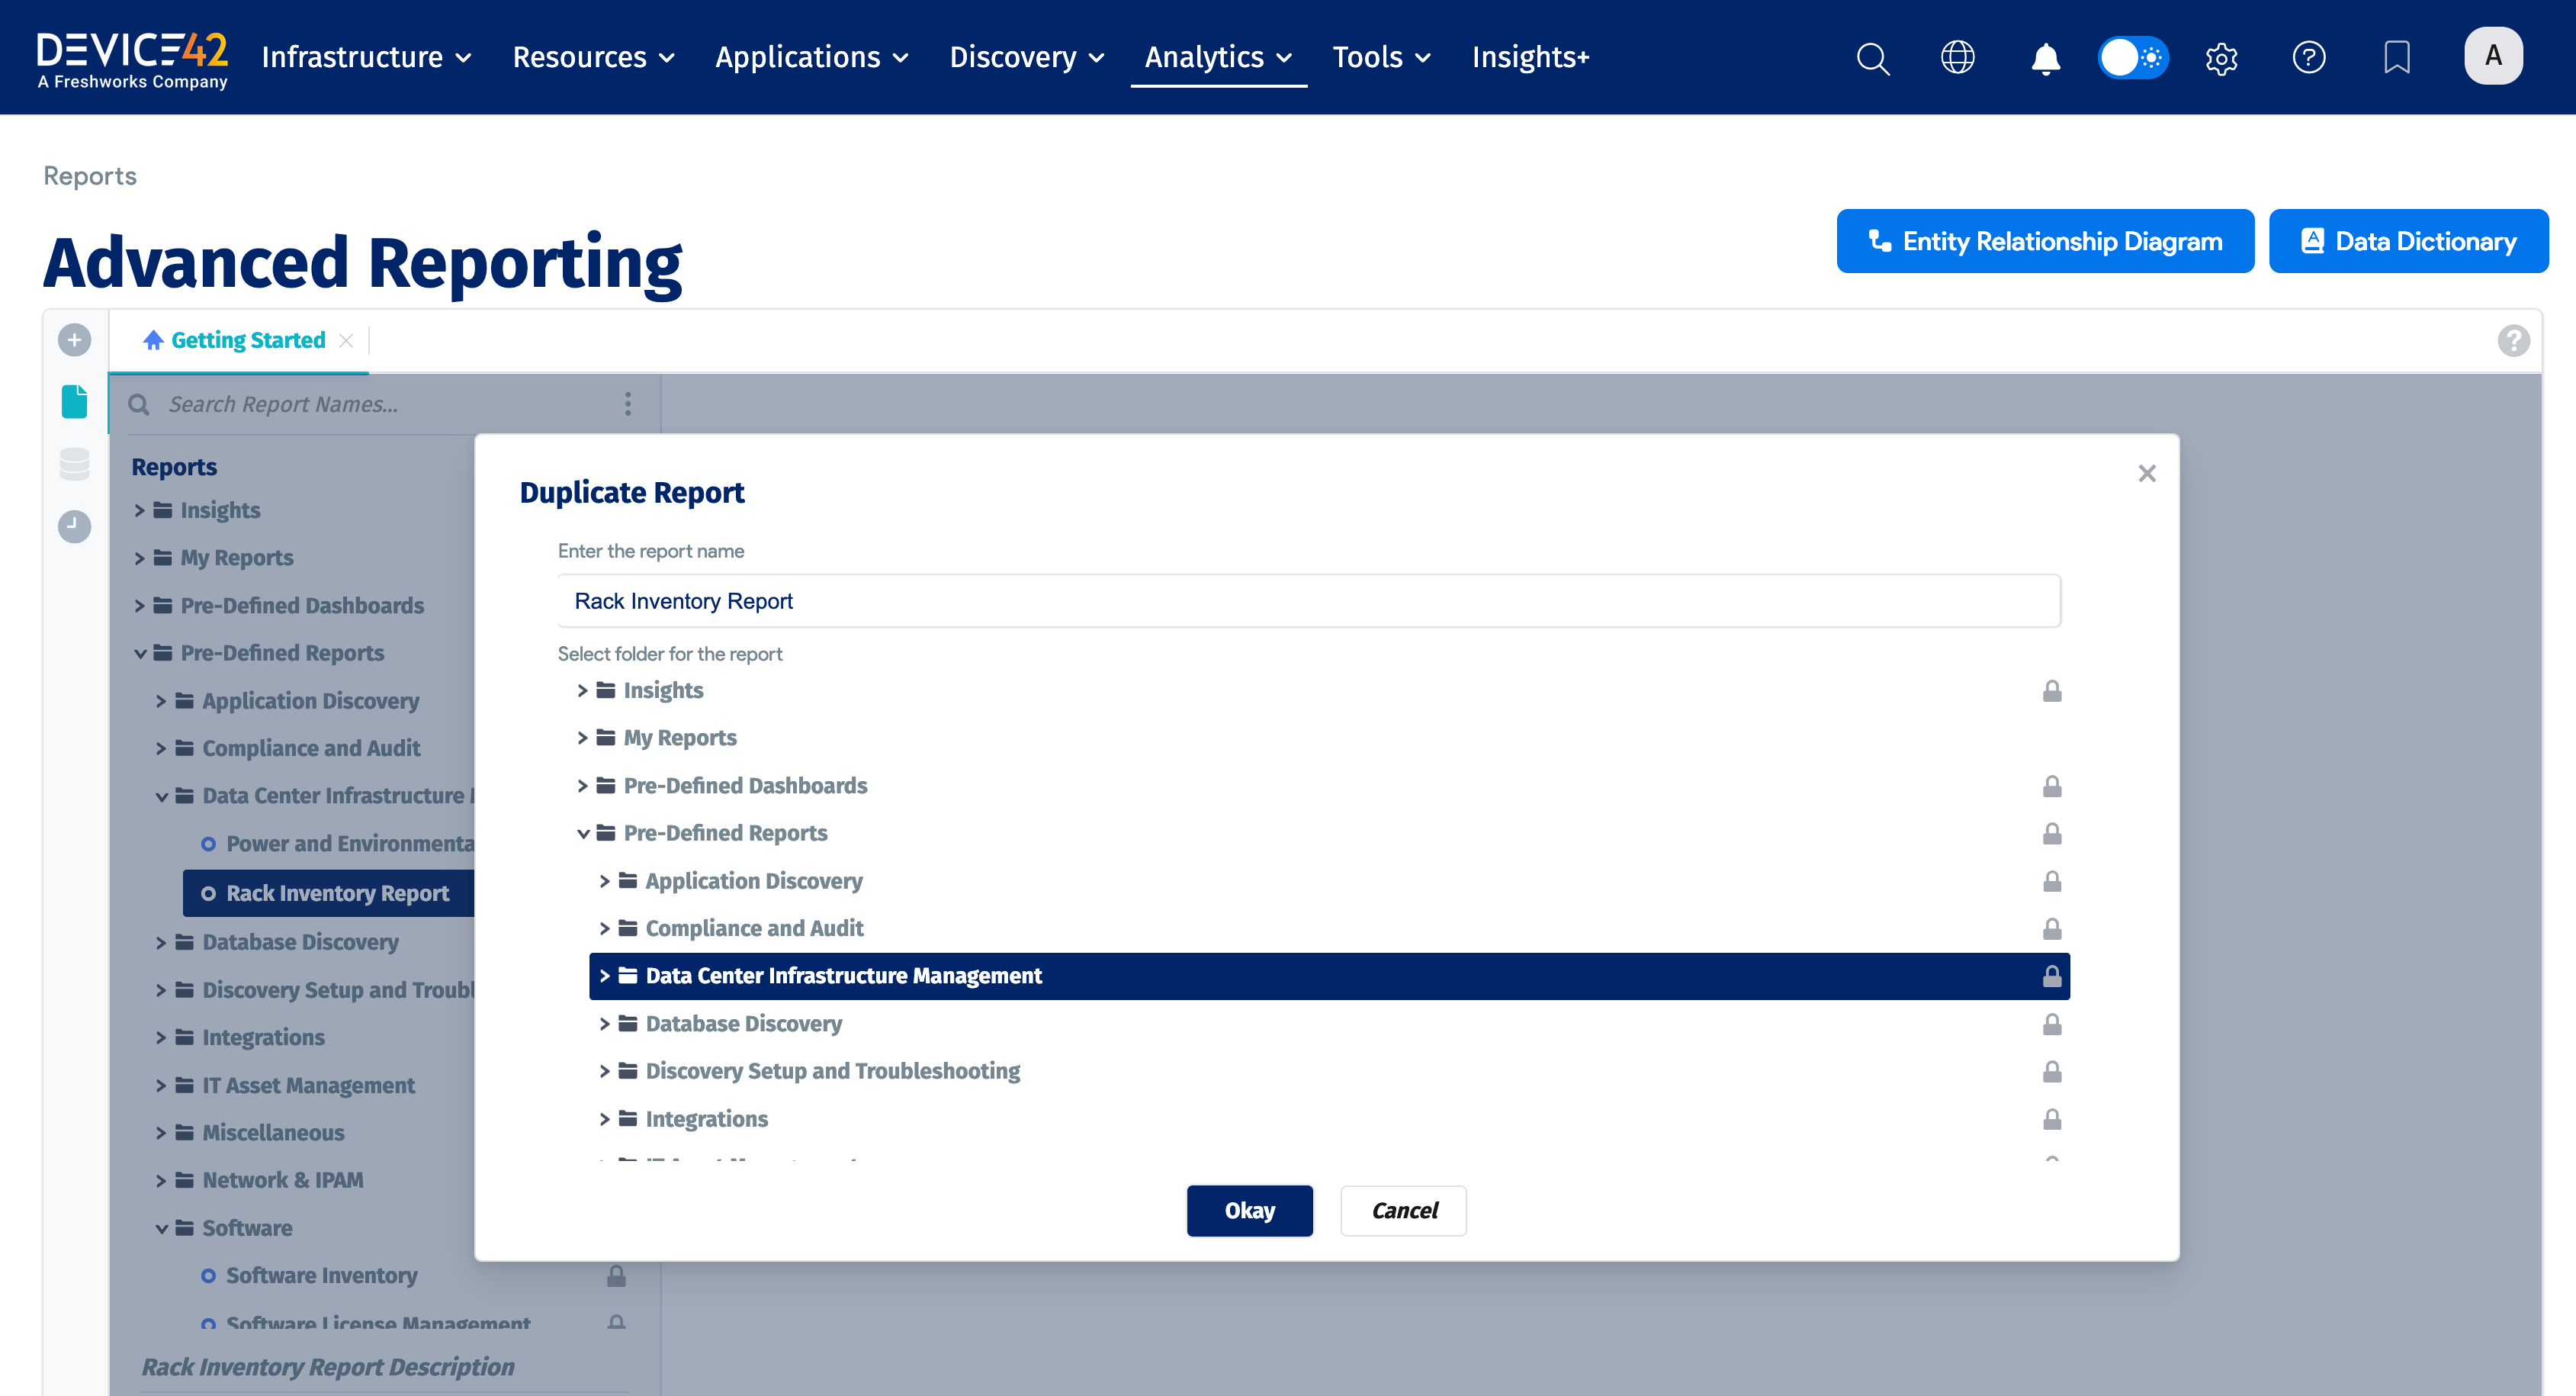
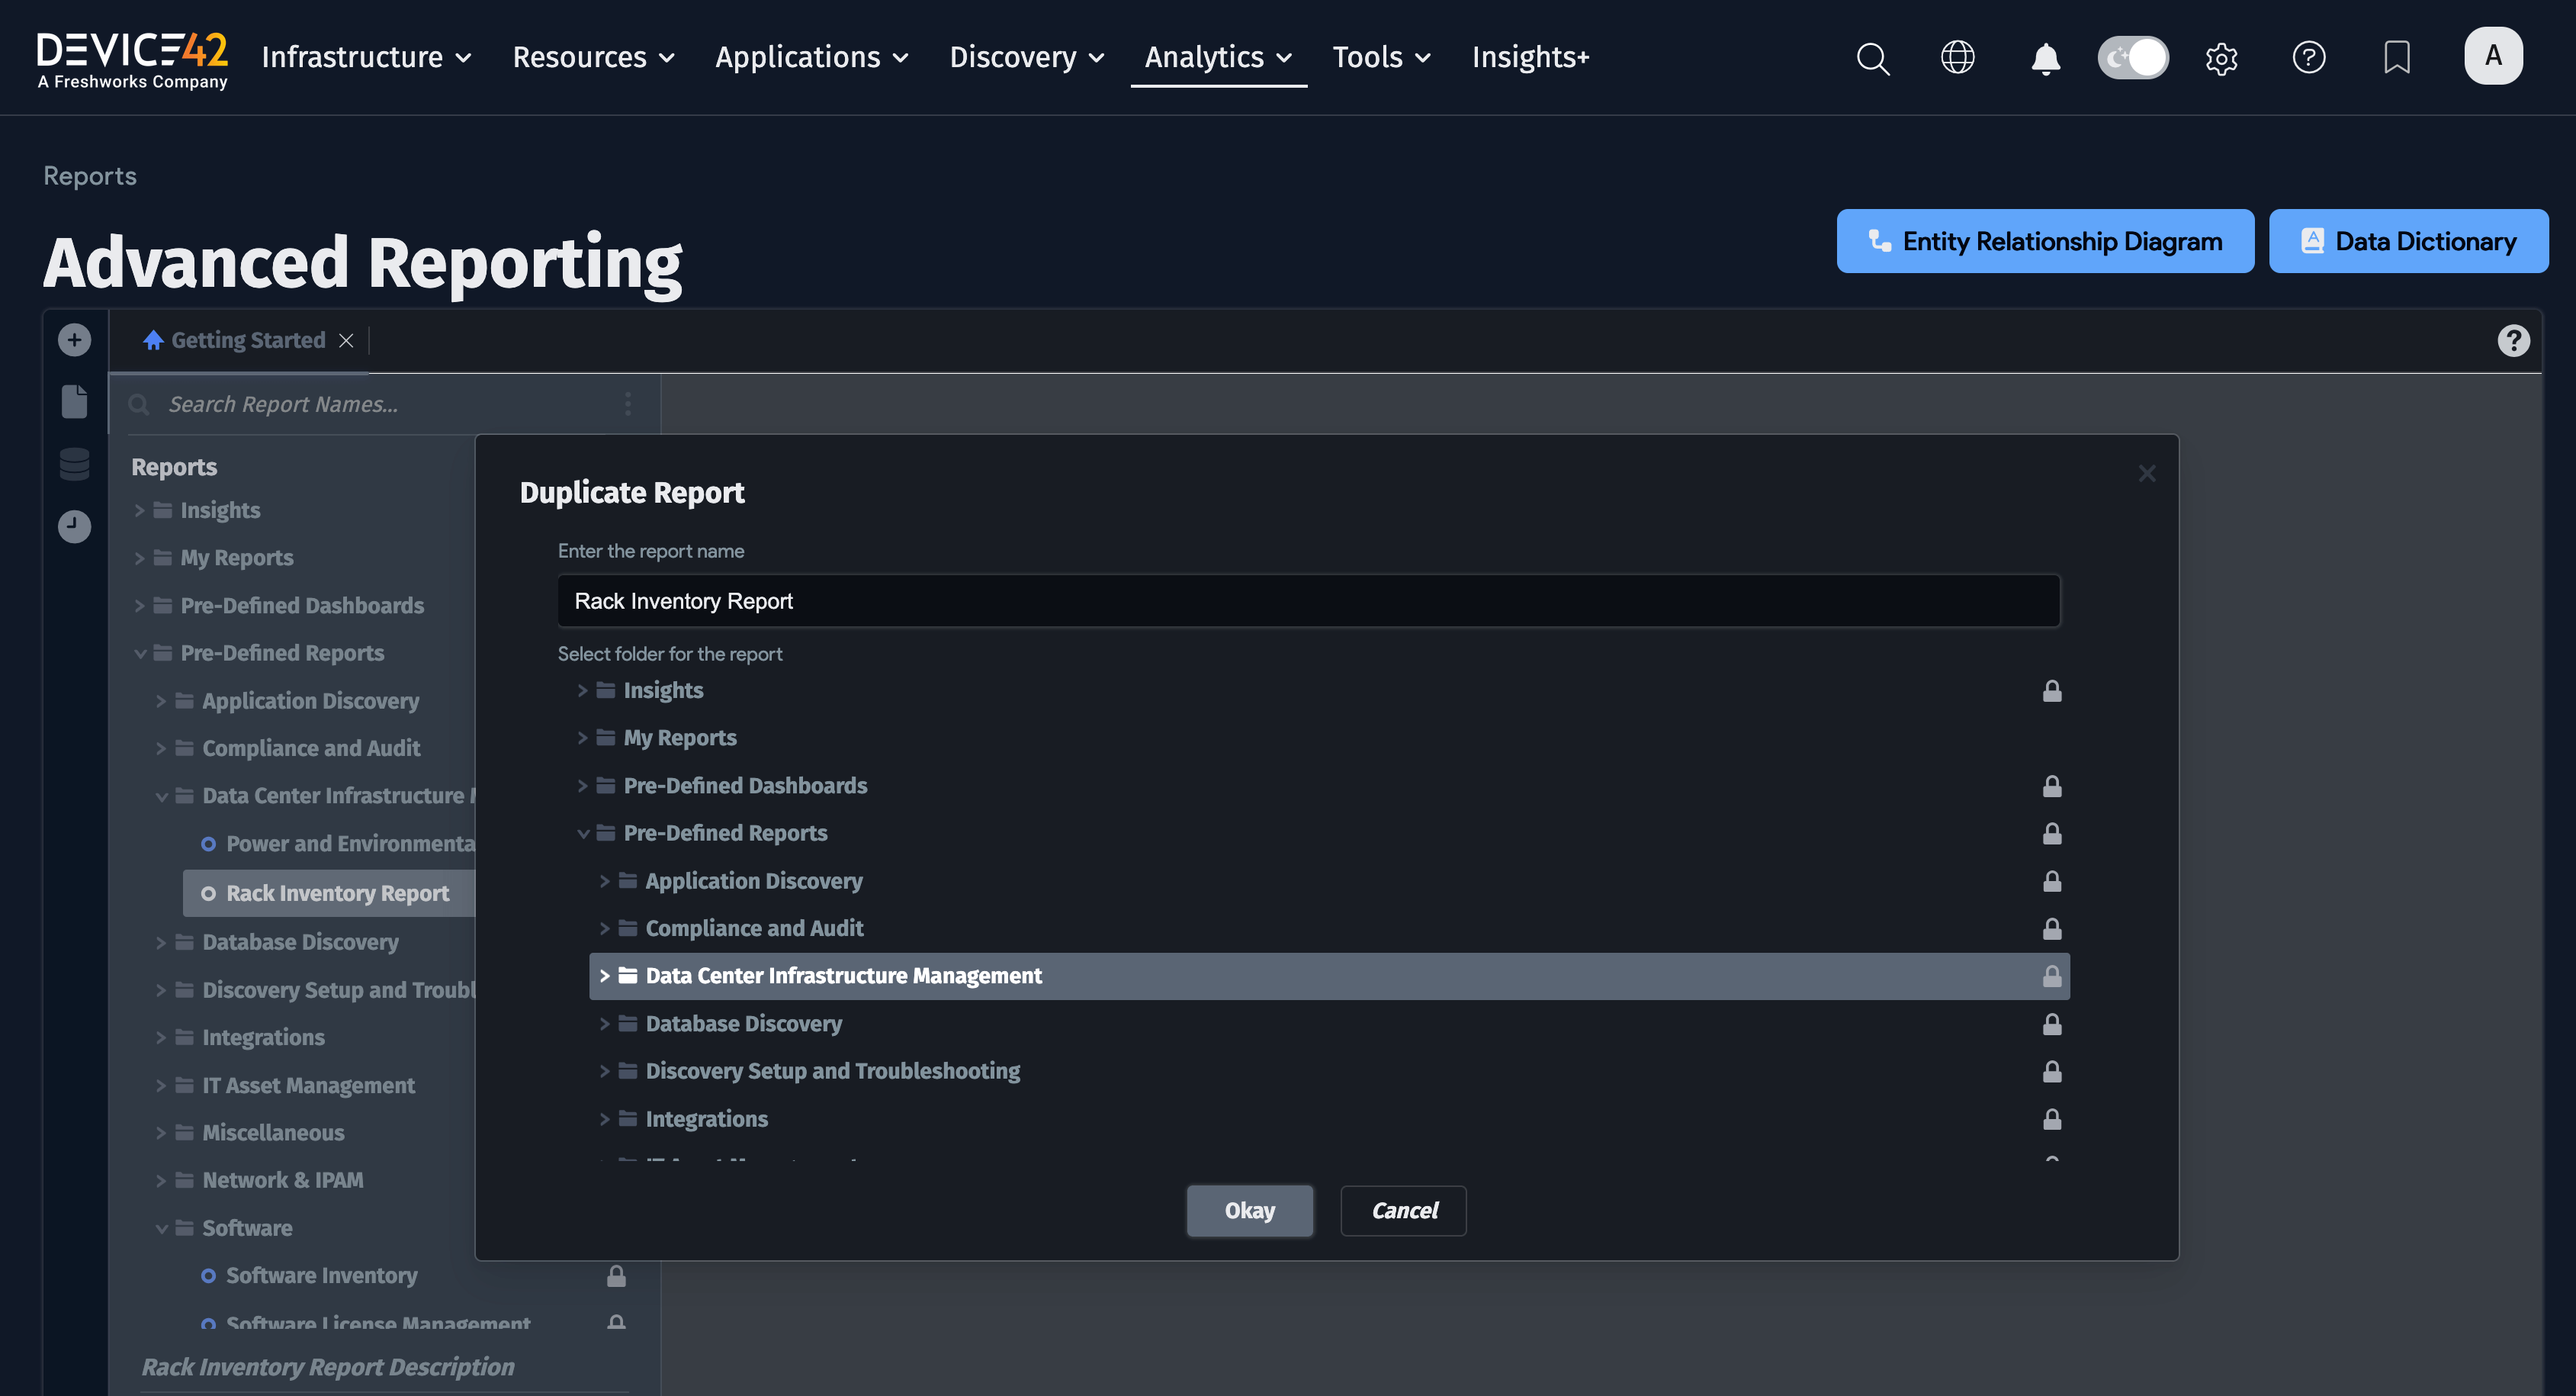
- To customize an existing report, either right-click or click on the hamburger menu and choose Duplicate to make a copy:
- Now, double-click the report you just copied, make your desired edits, and run as before.
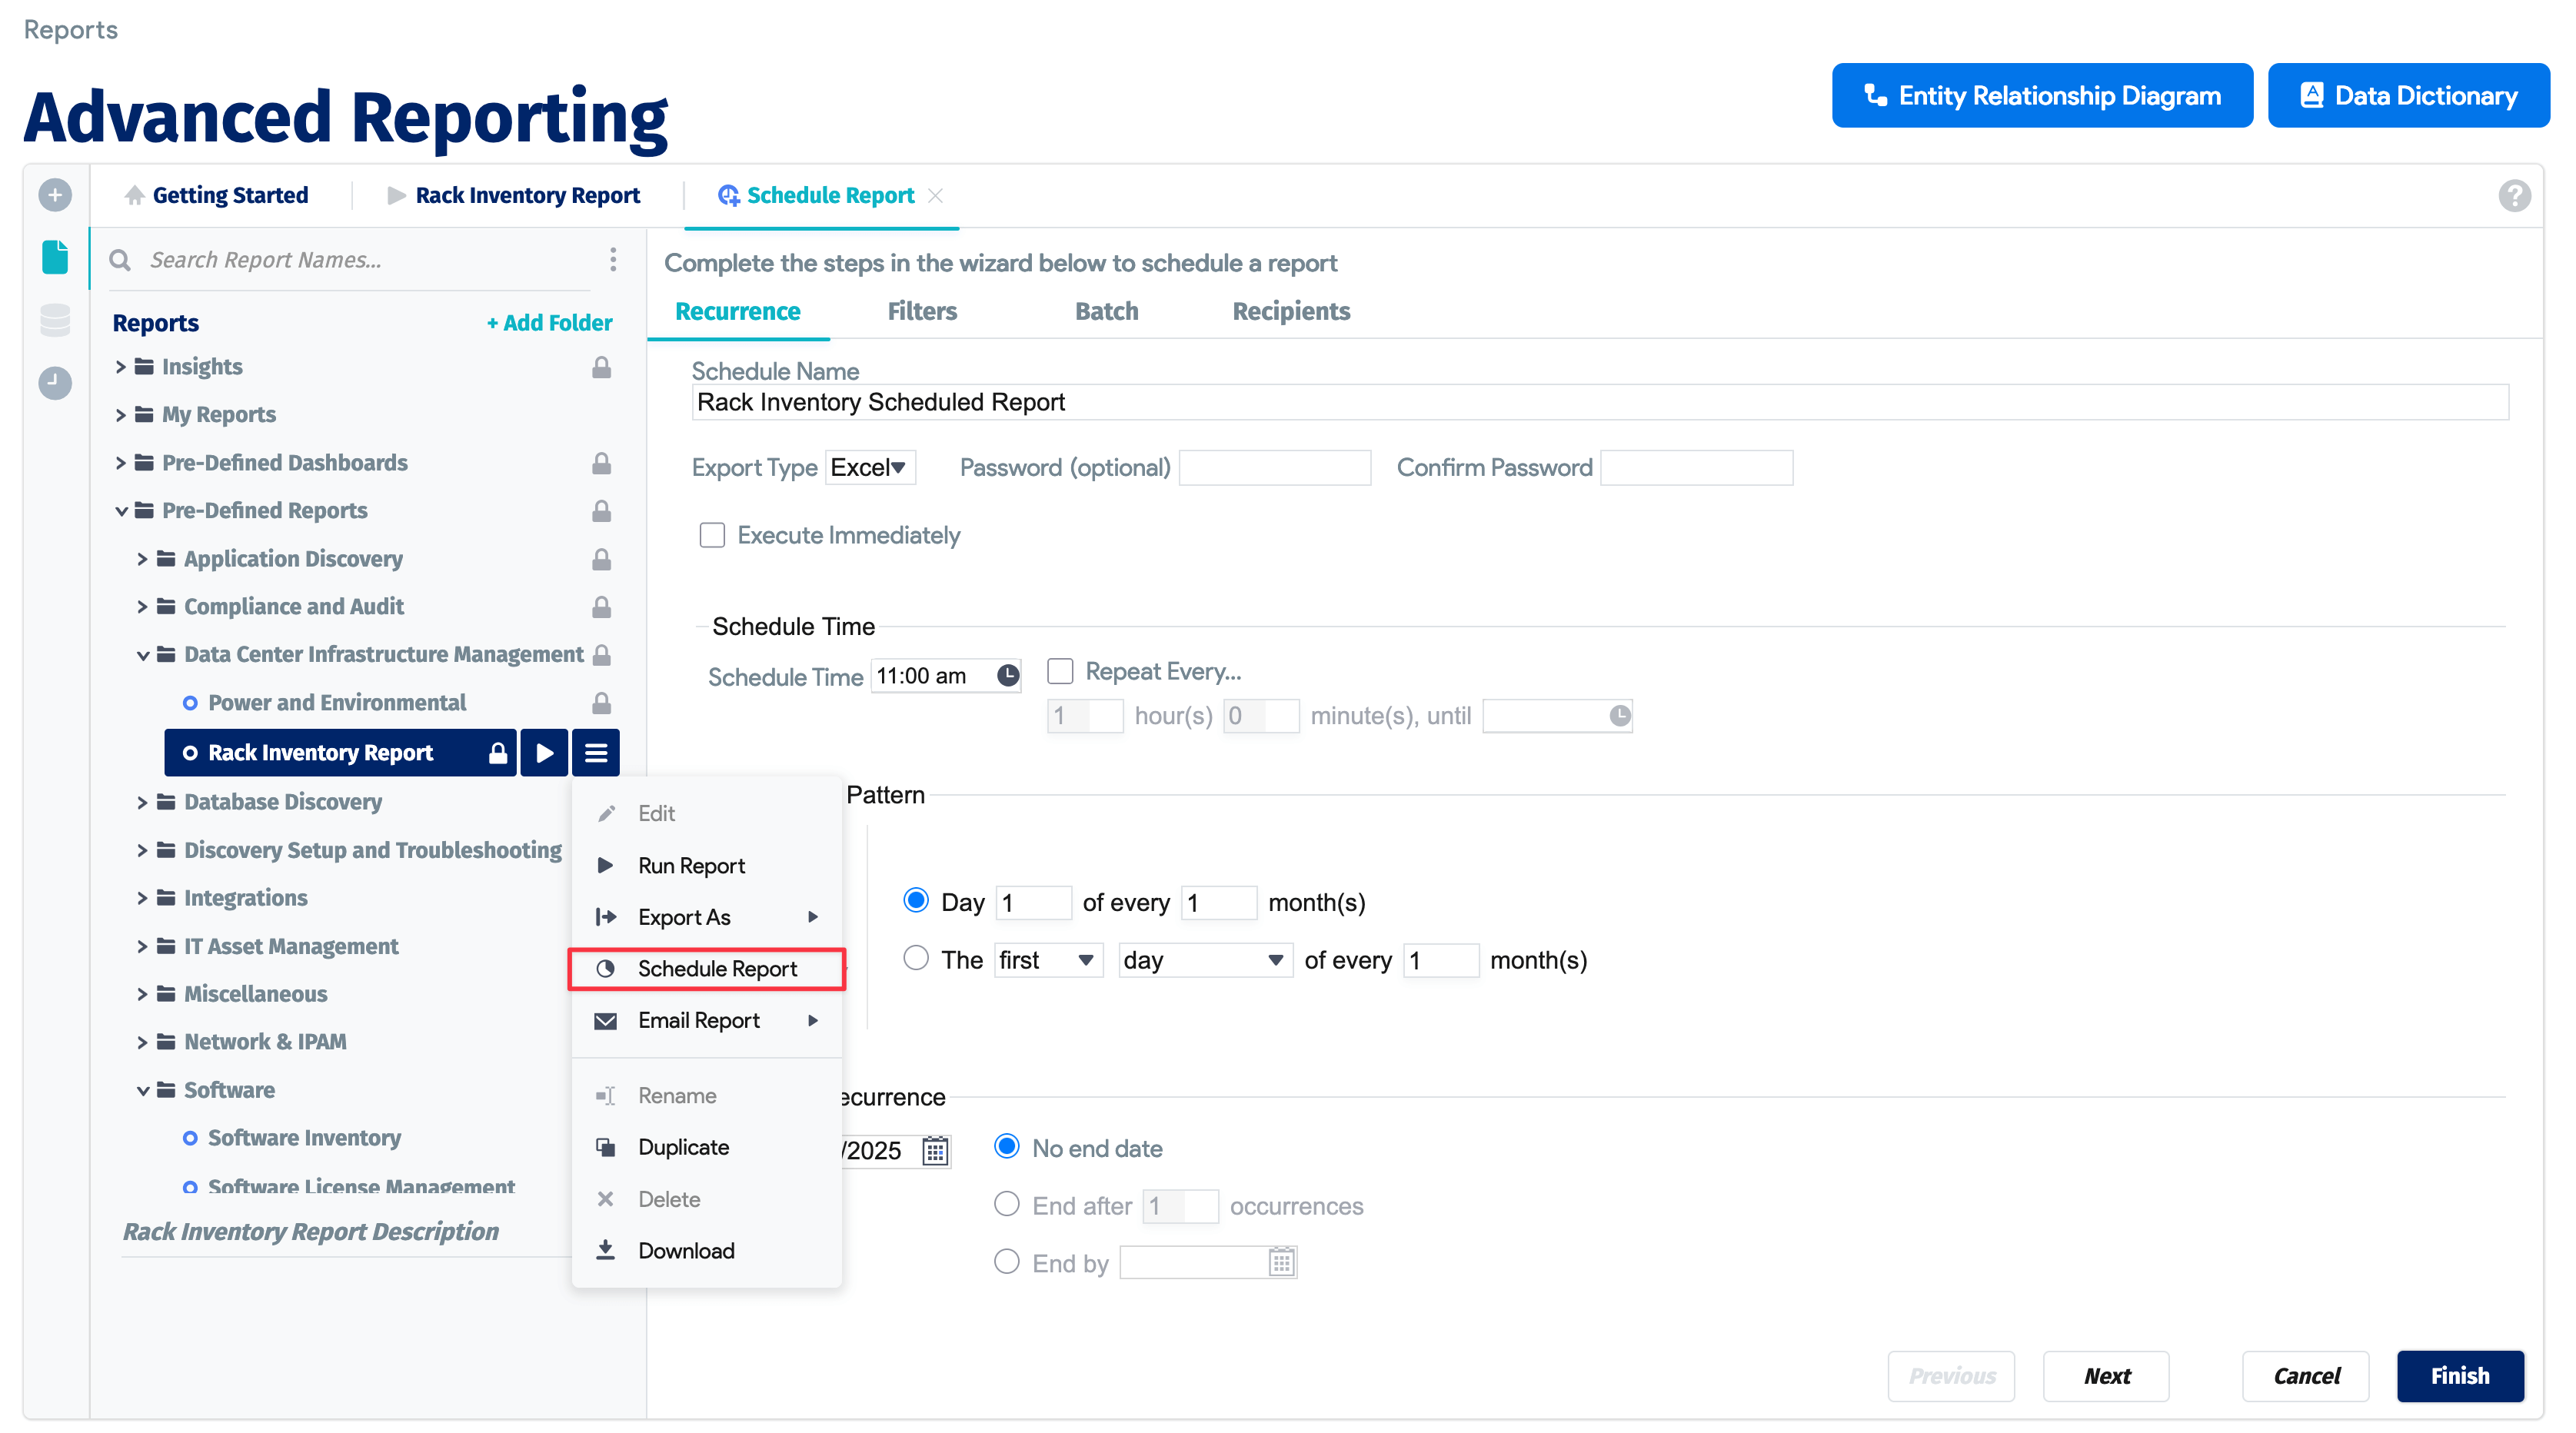
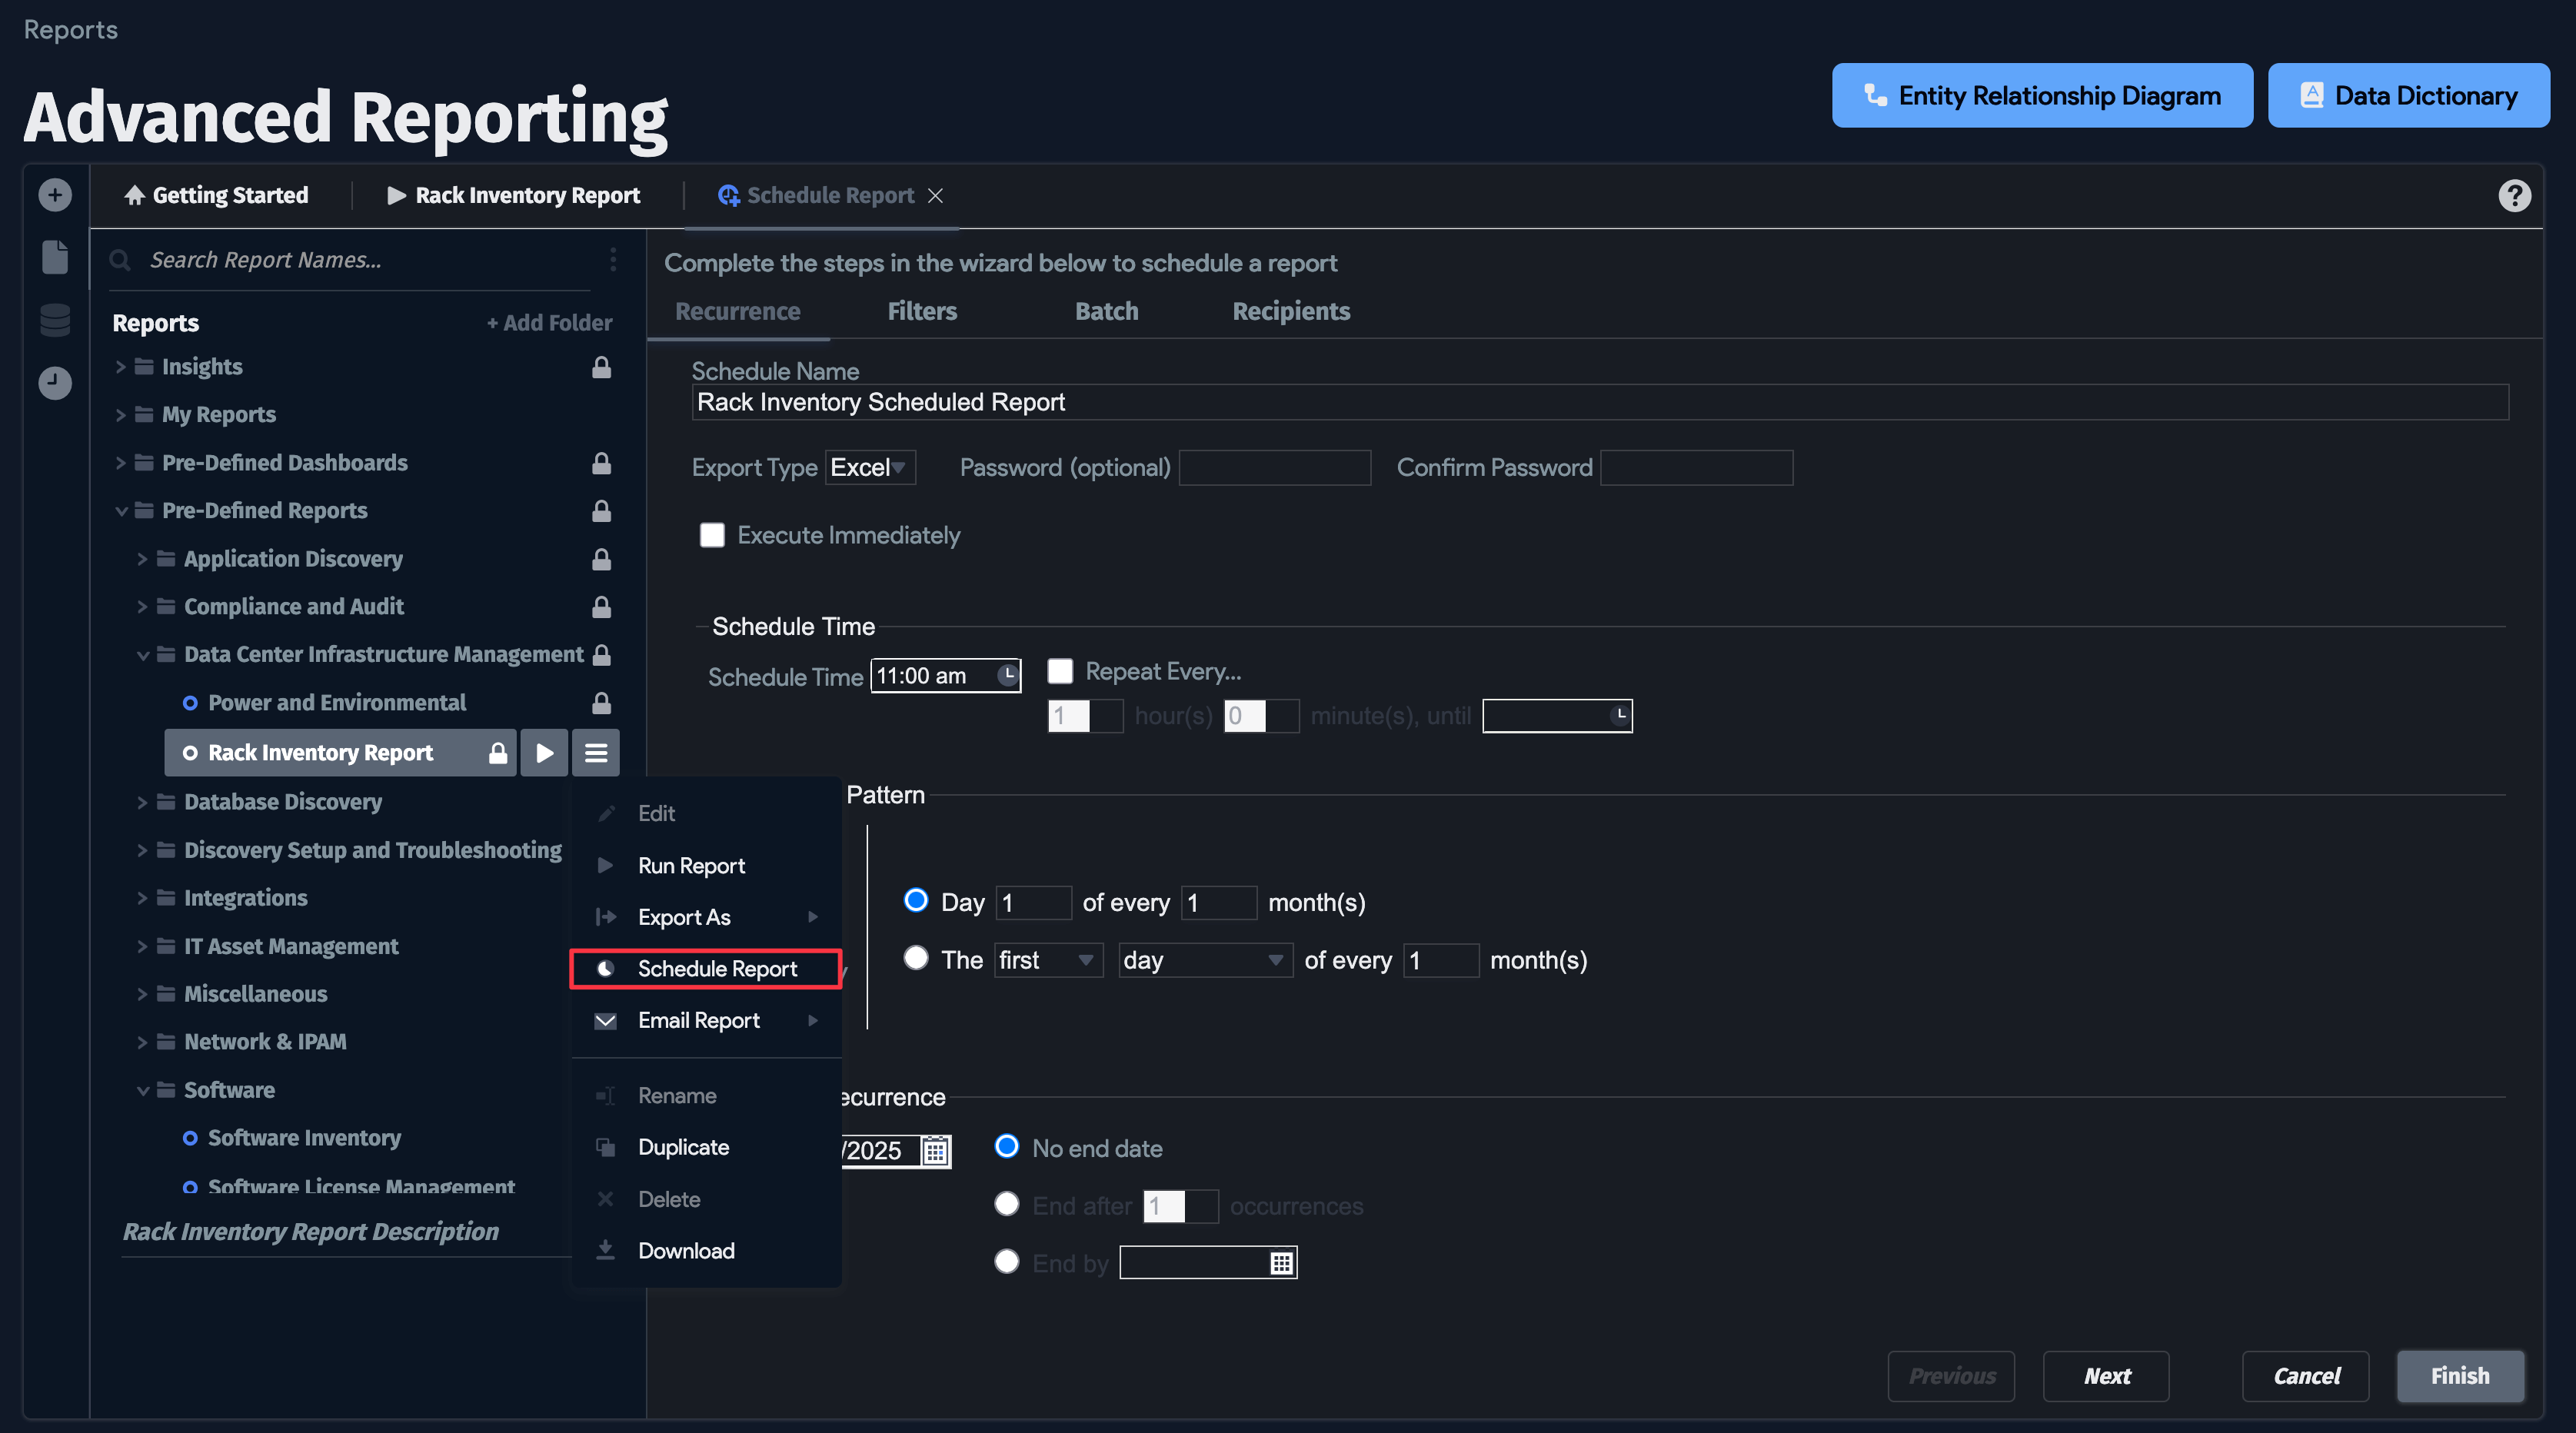
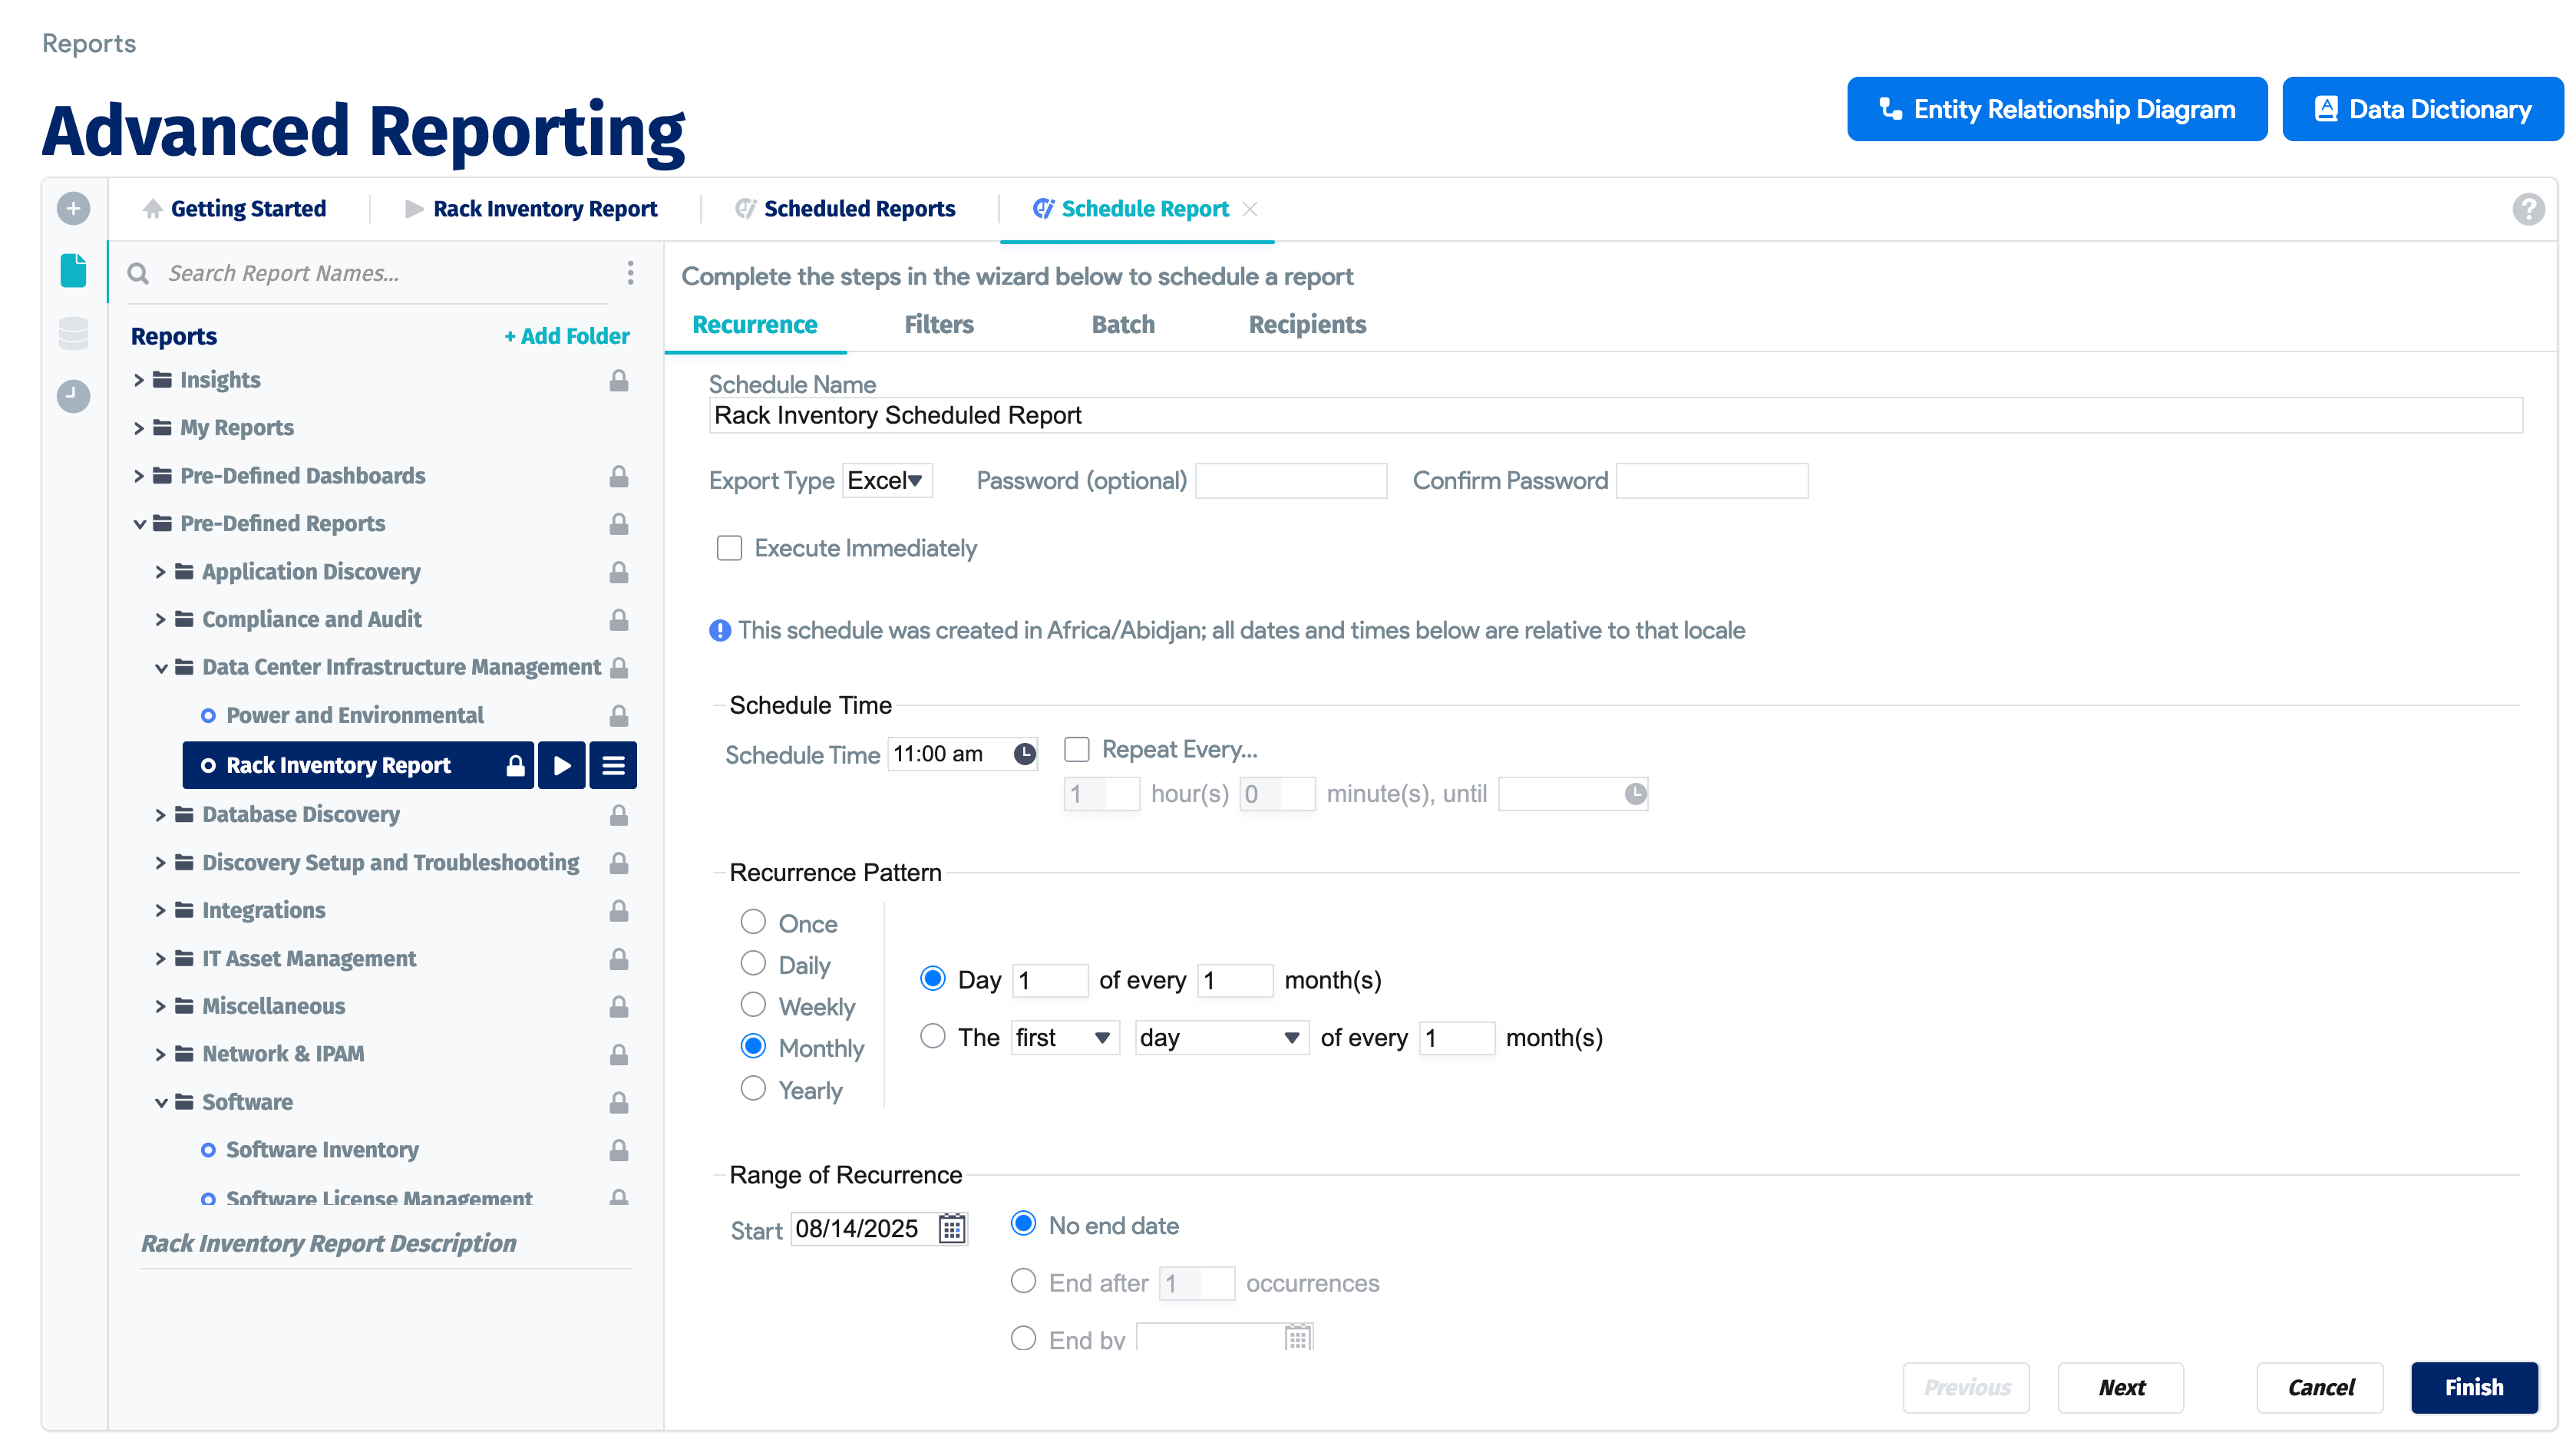
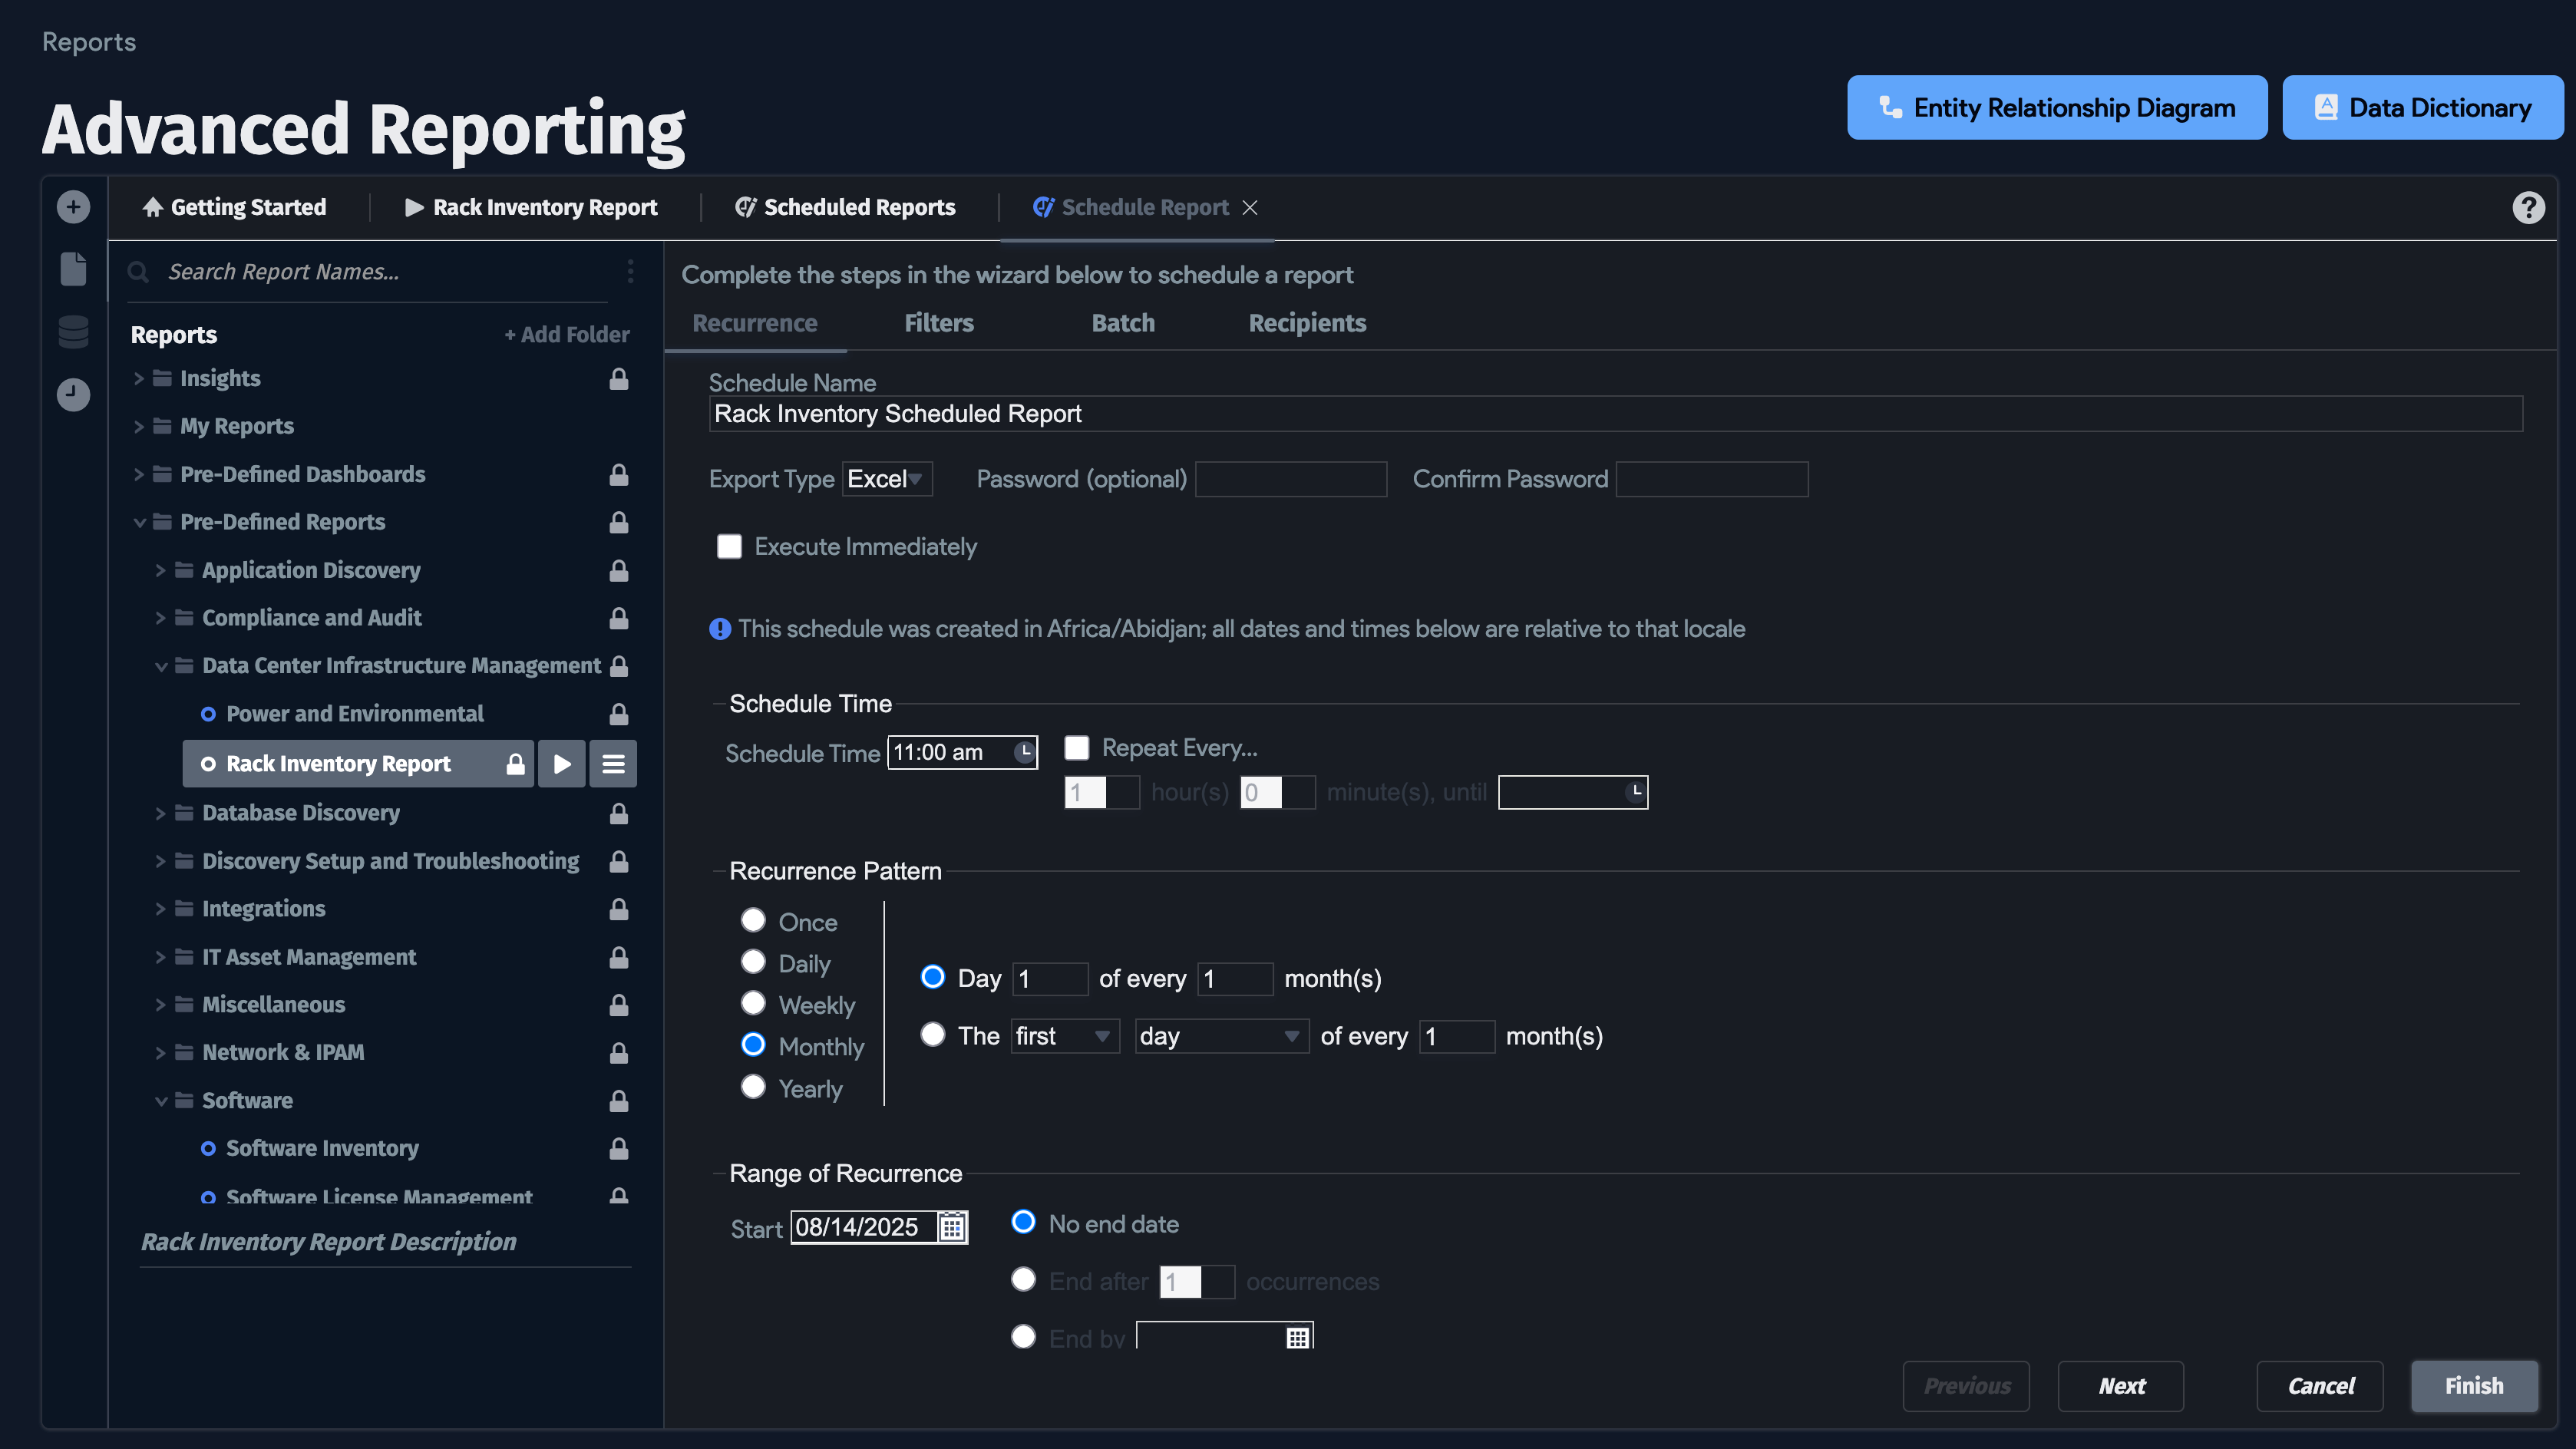
Scheduling Advanced Reports
Click the hamburger menu, select Schedule, and define the report to send out.
You can view all scheduled advanced reports, and edit their schedules, by clicking the clock icon on the left-hand panel of Advanced Reporting:
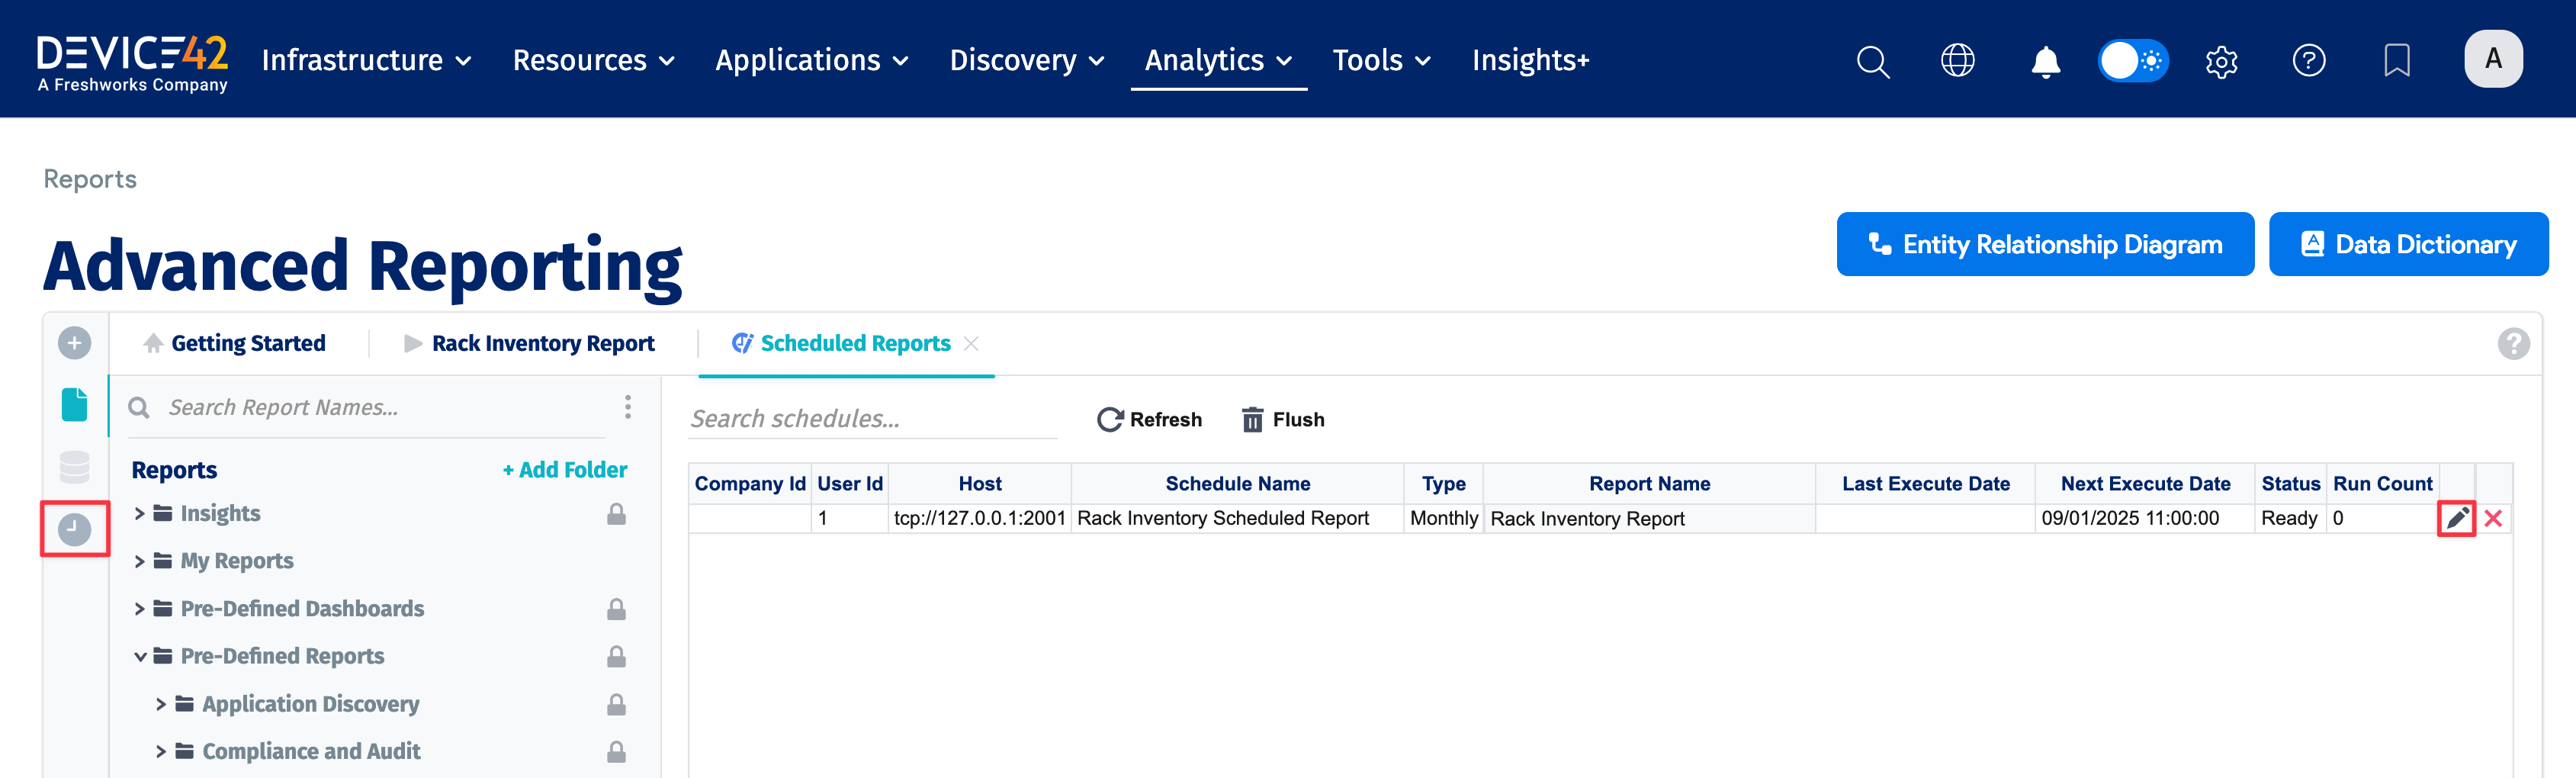
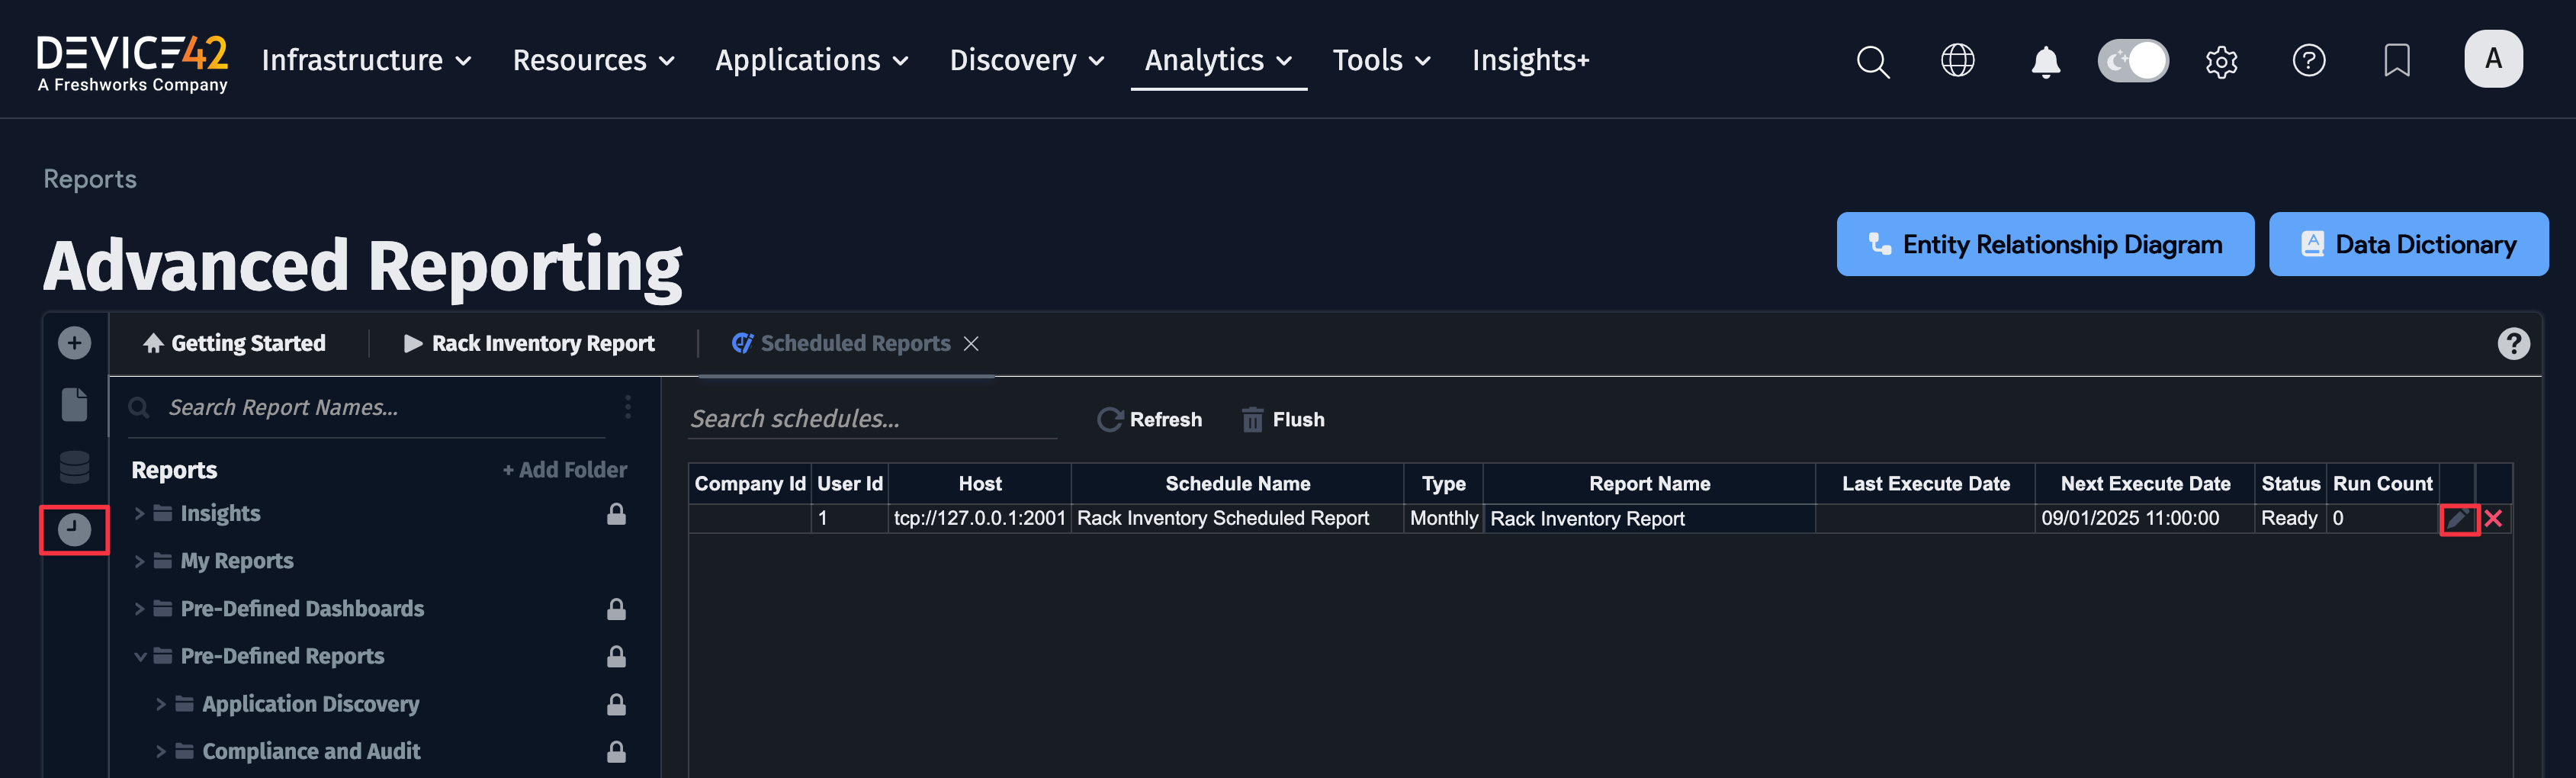
To edit the schedule of a report, click the pencil icon on the far right of each row. Upon clicking the pencil, you will see the edit schedule screen:
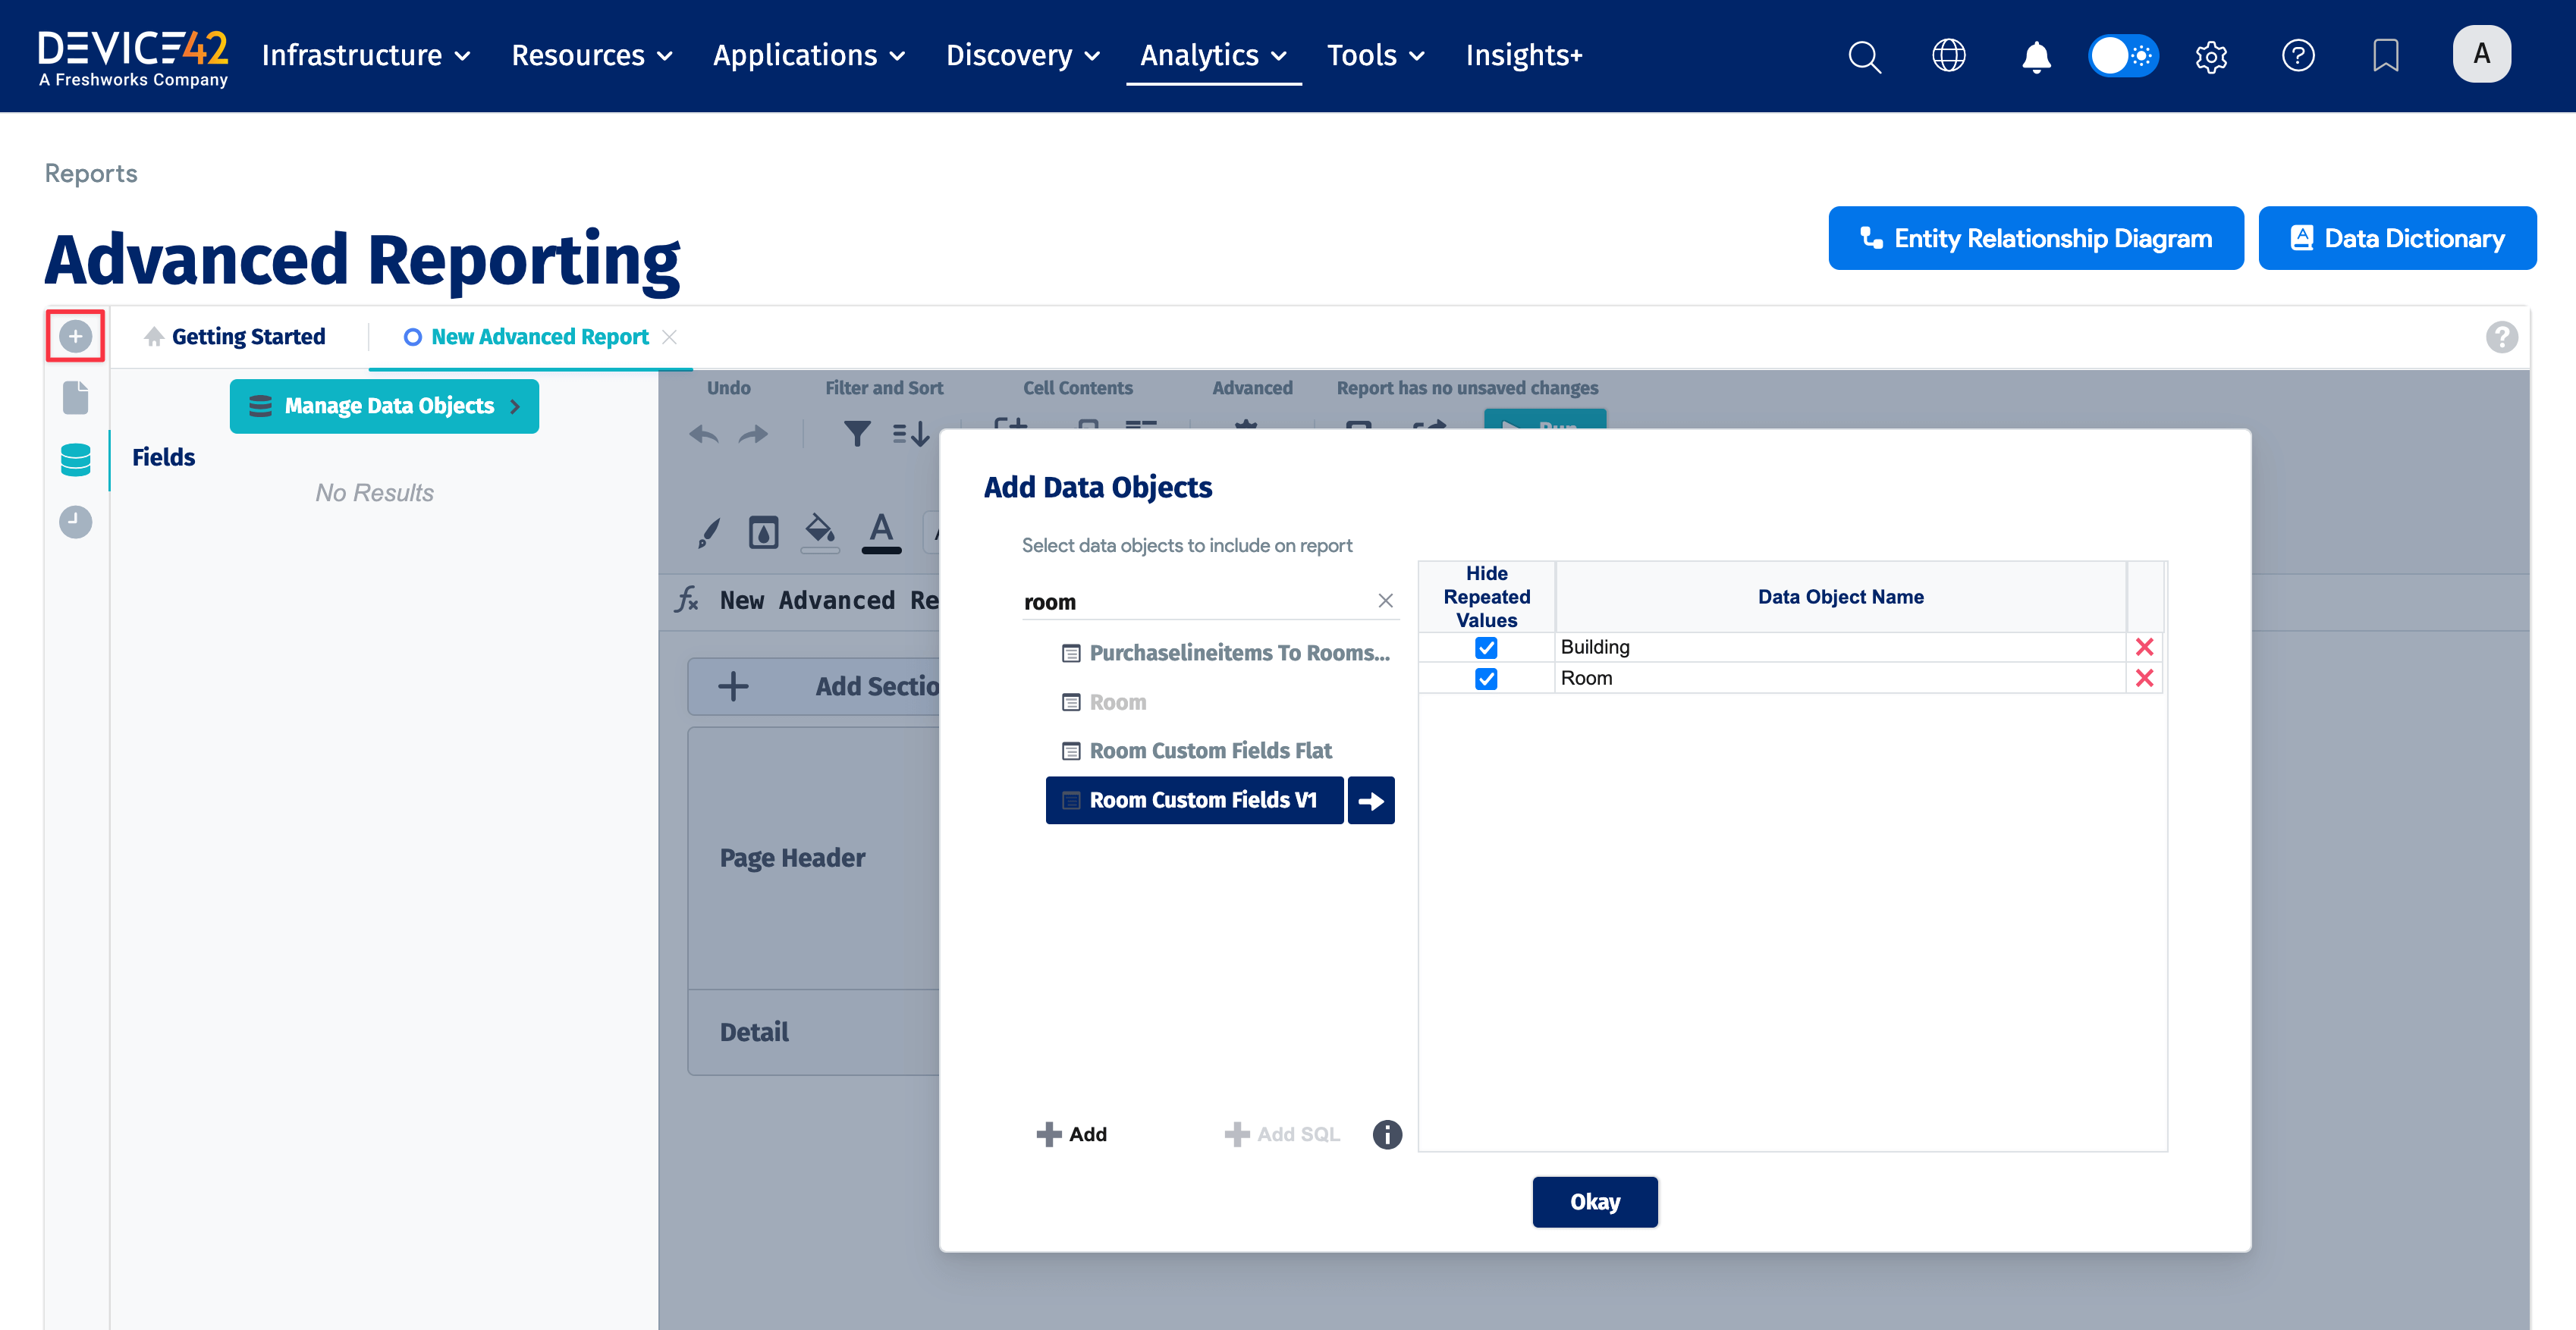
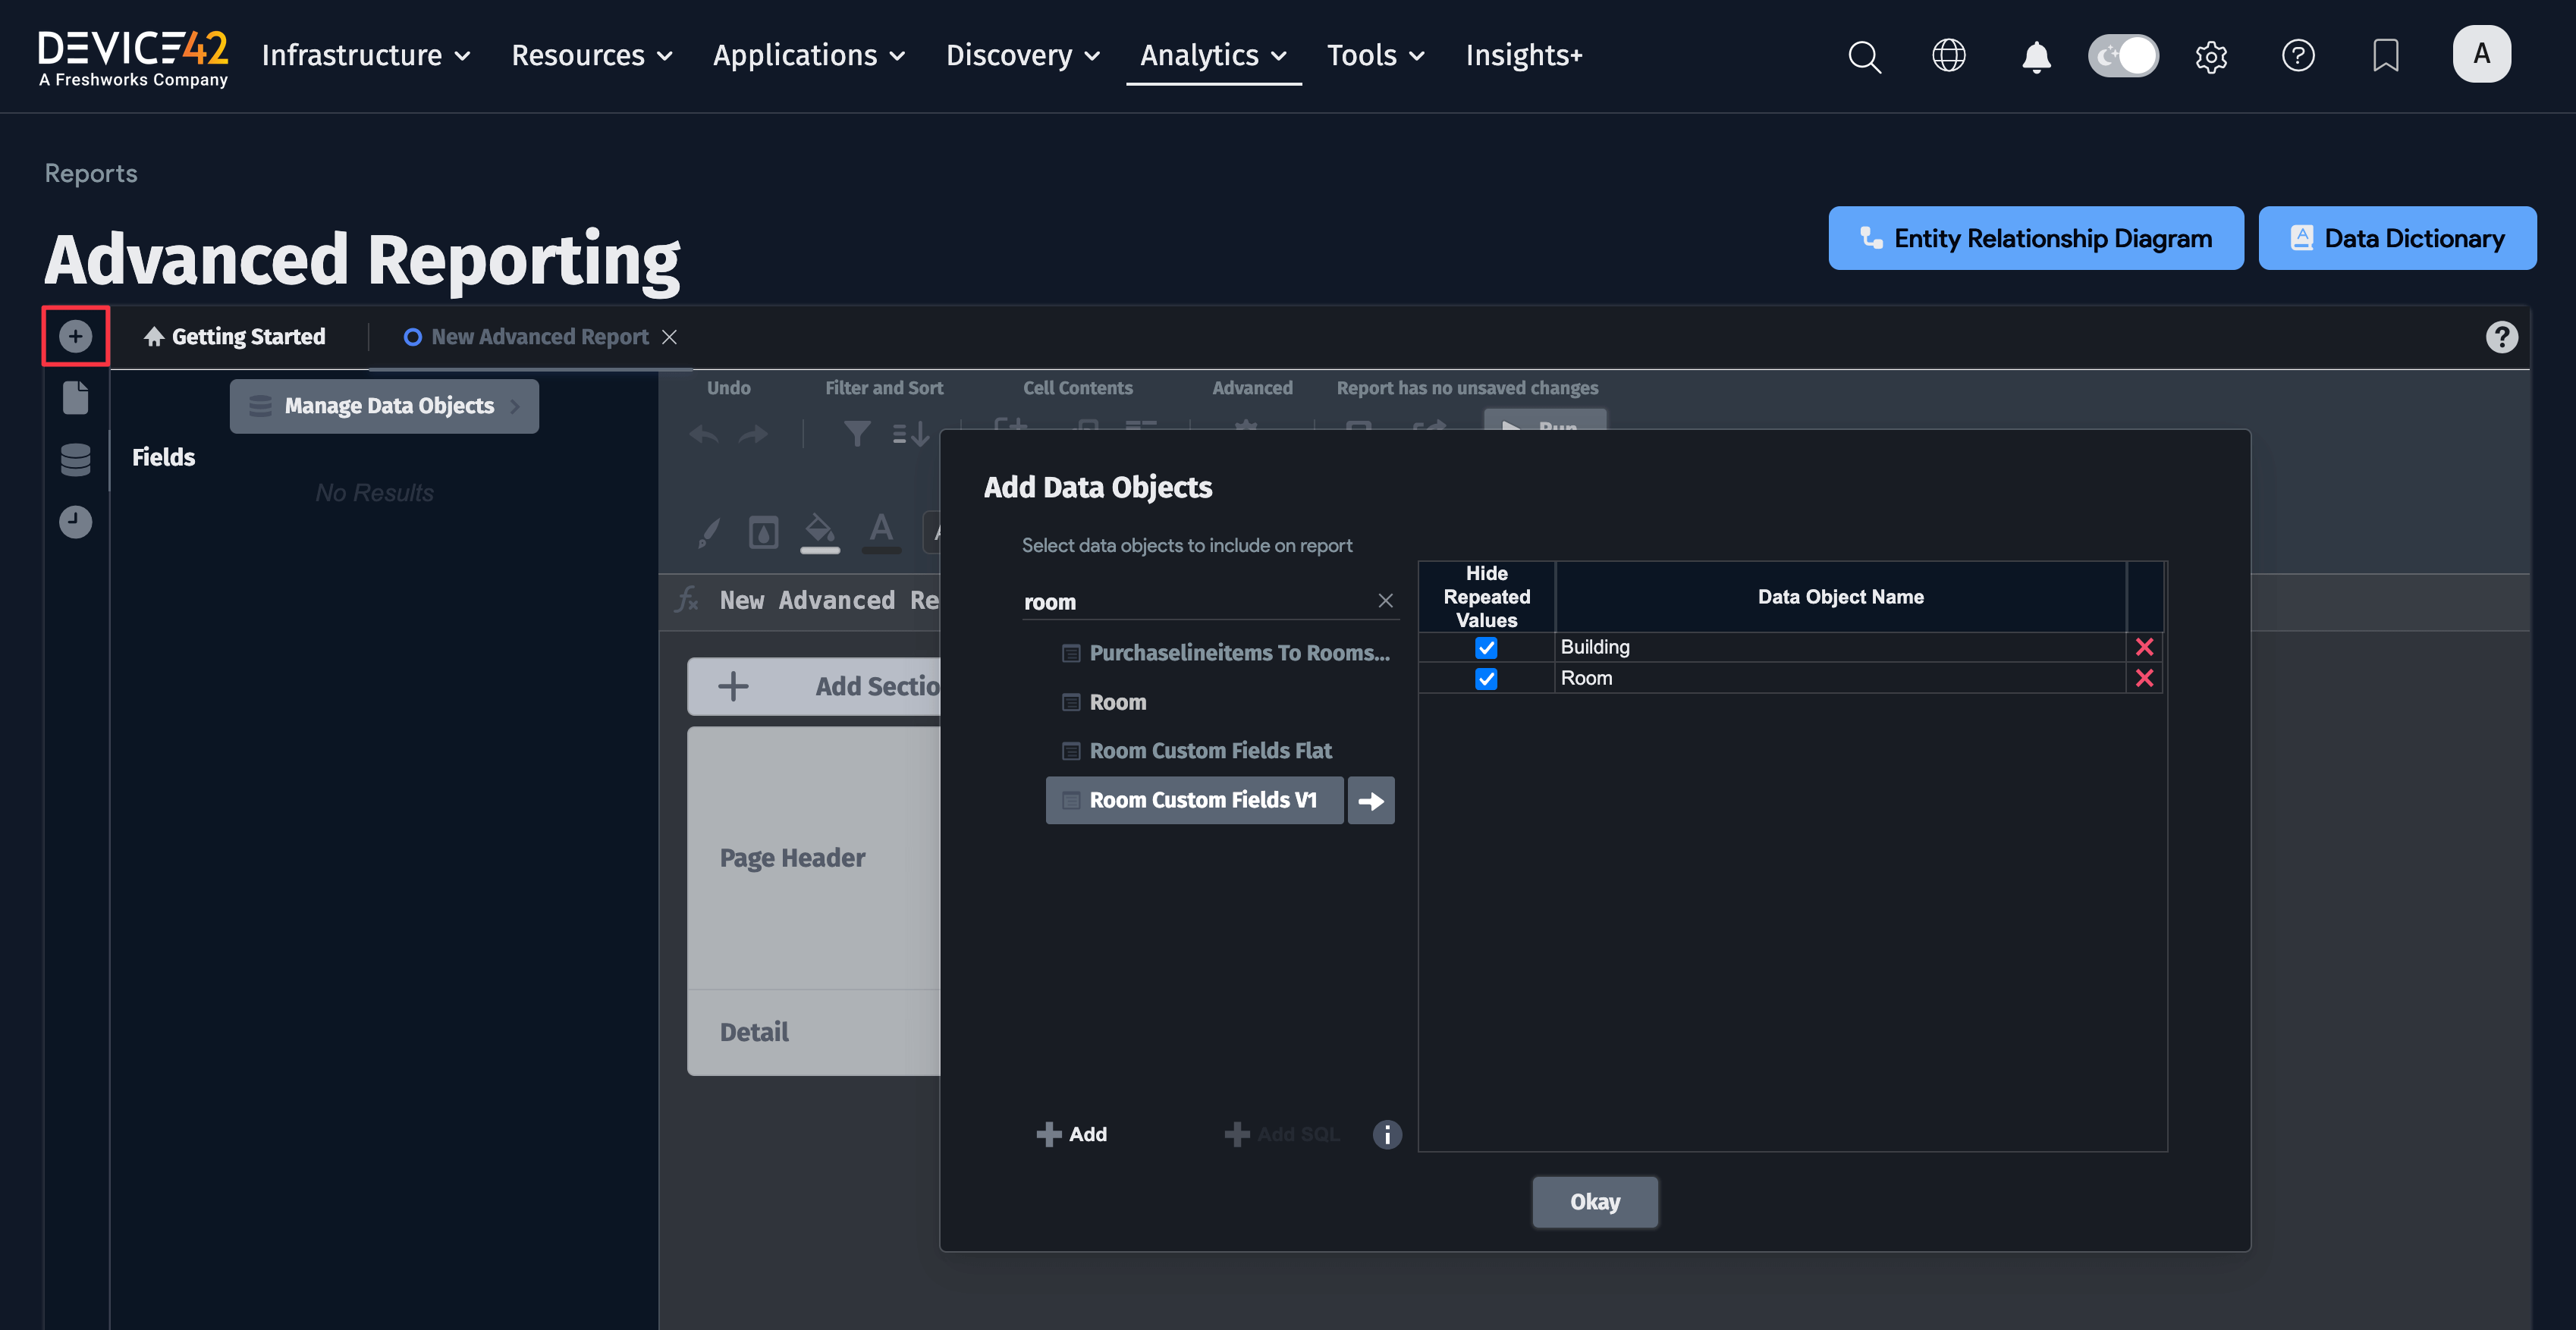
Building a Custom Advanced Report
The following is the basic flow for building an advanced report.
-
First, click the plus sign icon in the upper left to begin creating a new report. Choose Advanced Report to start.
-
Add data objects to the report. You will notice that certain categories are greyed out based on the data points you select; certain categories of data limit the other items that can be included in the report to related information.
-
Next, head to the Filter and sort tab to configure your sorting and to filter your data.
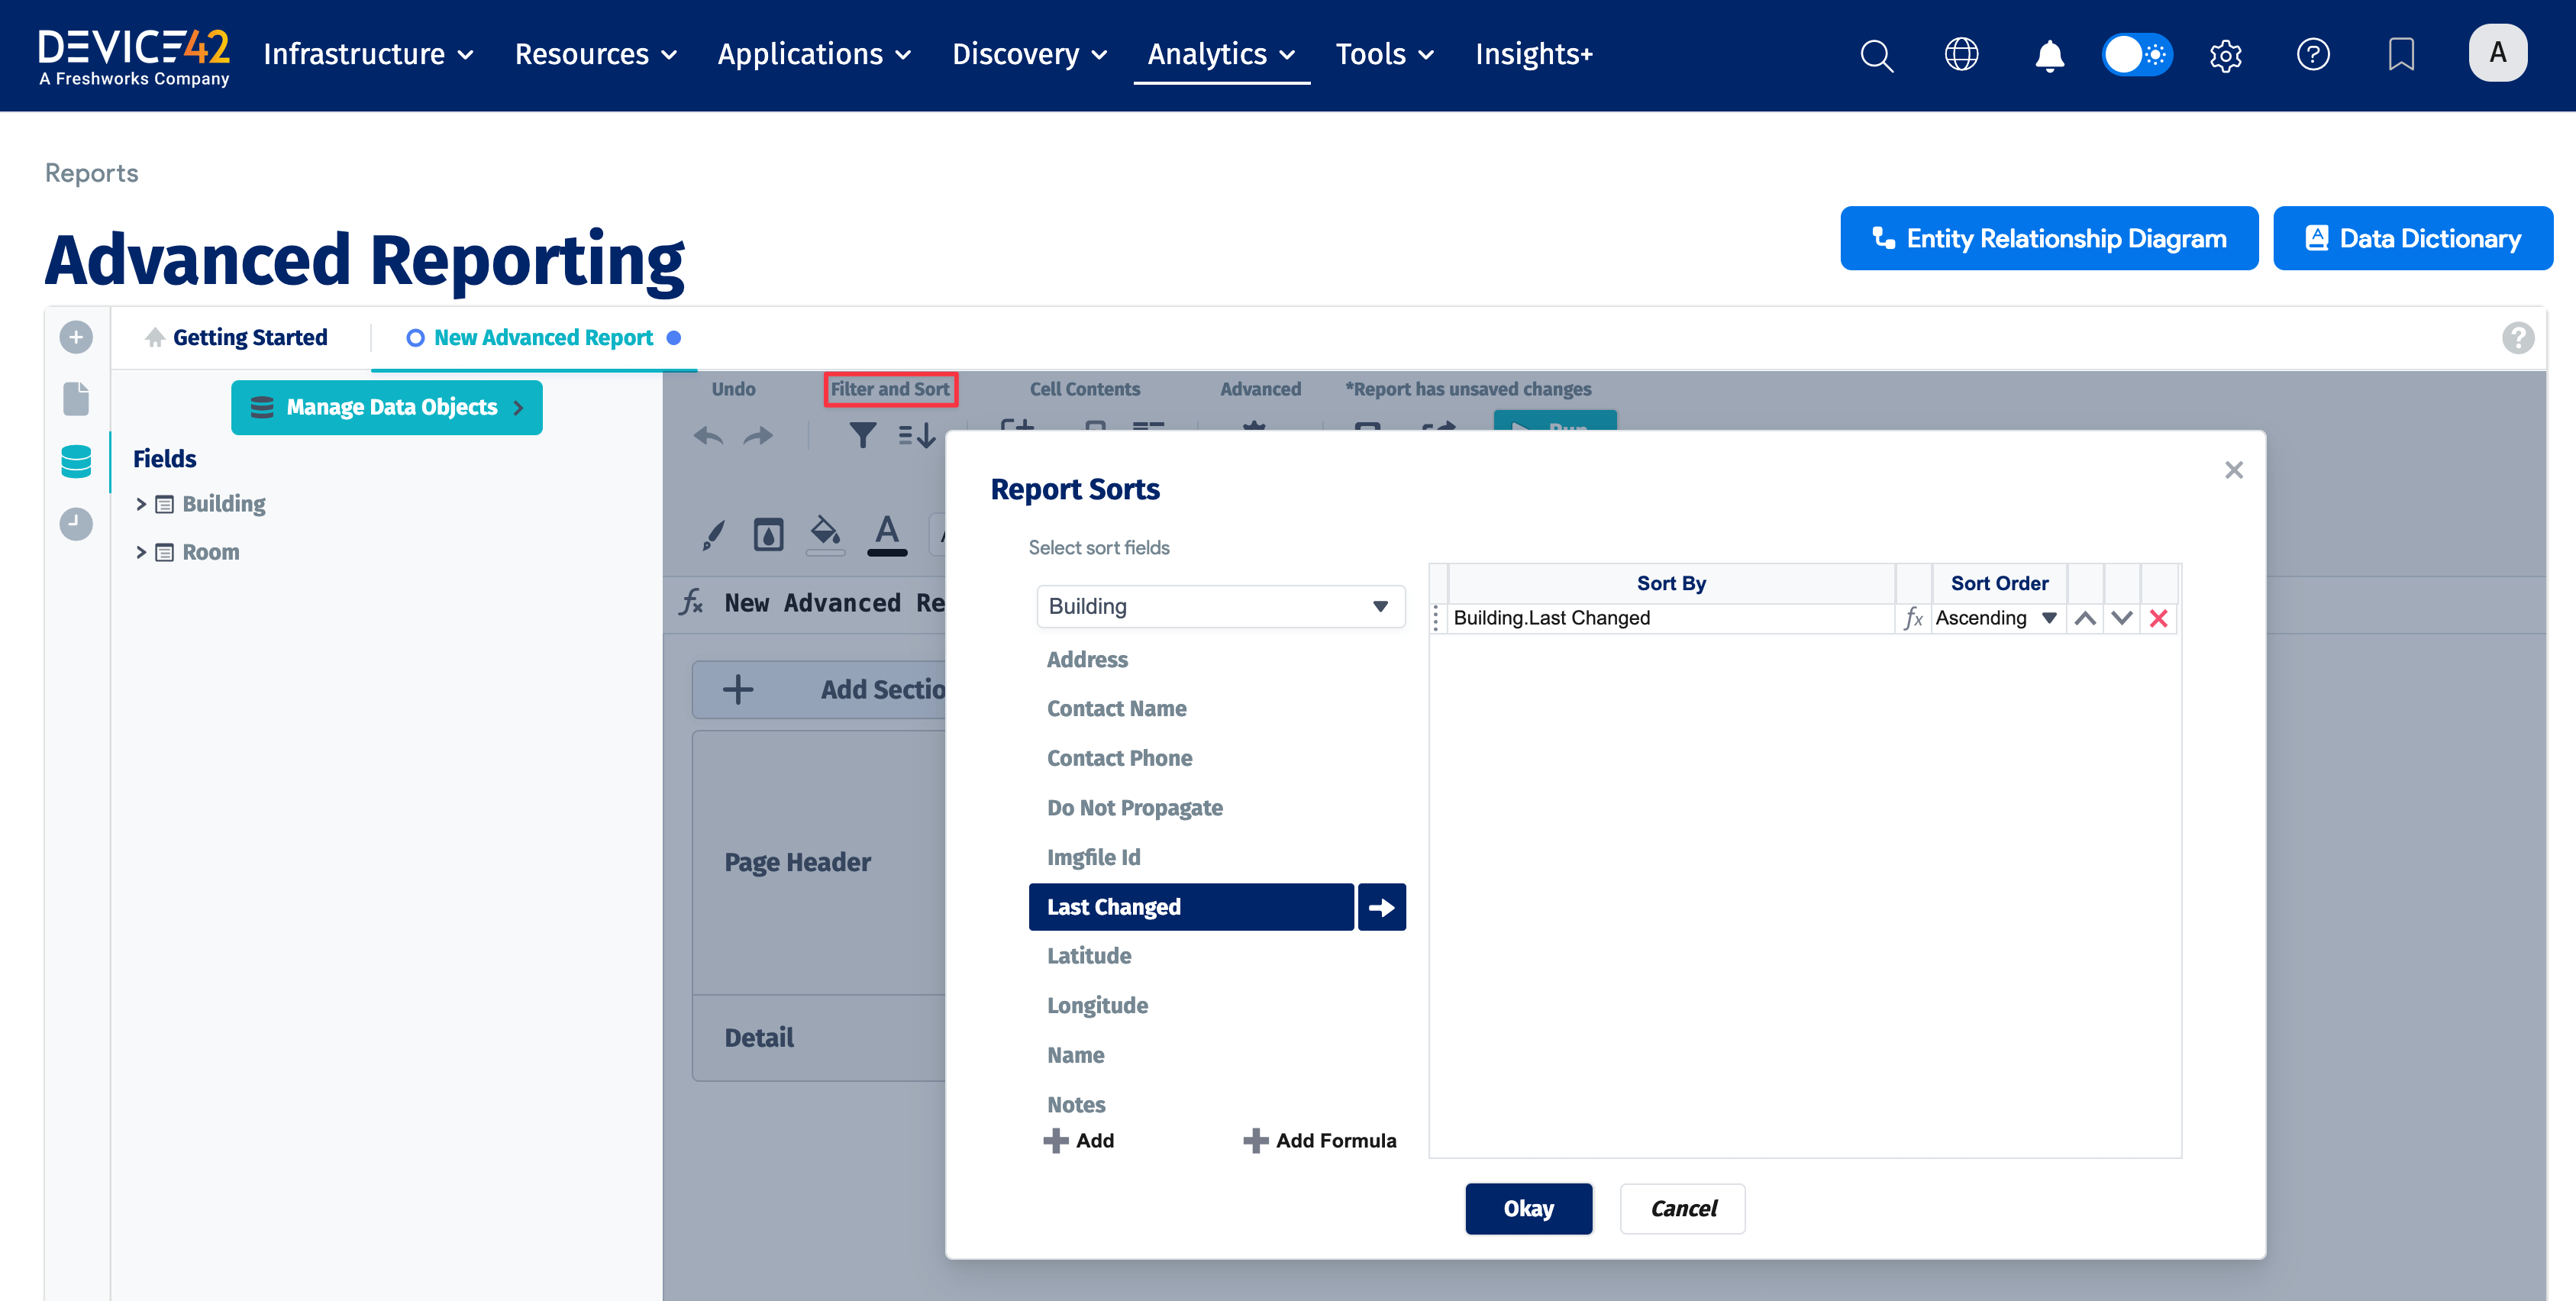
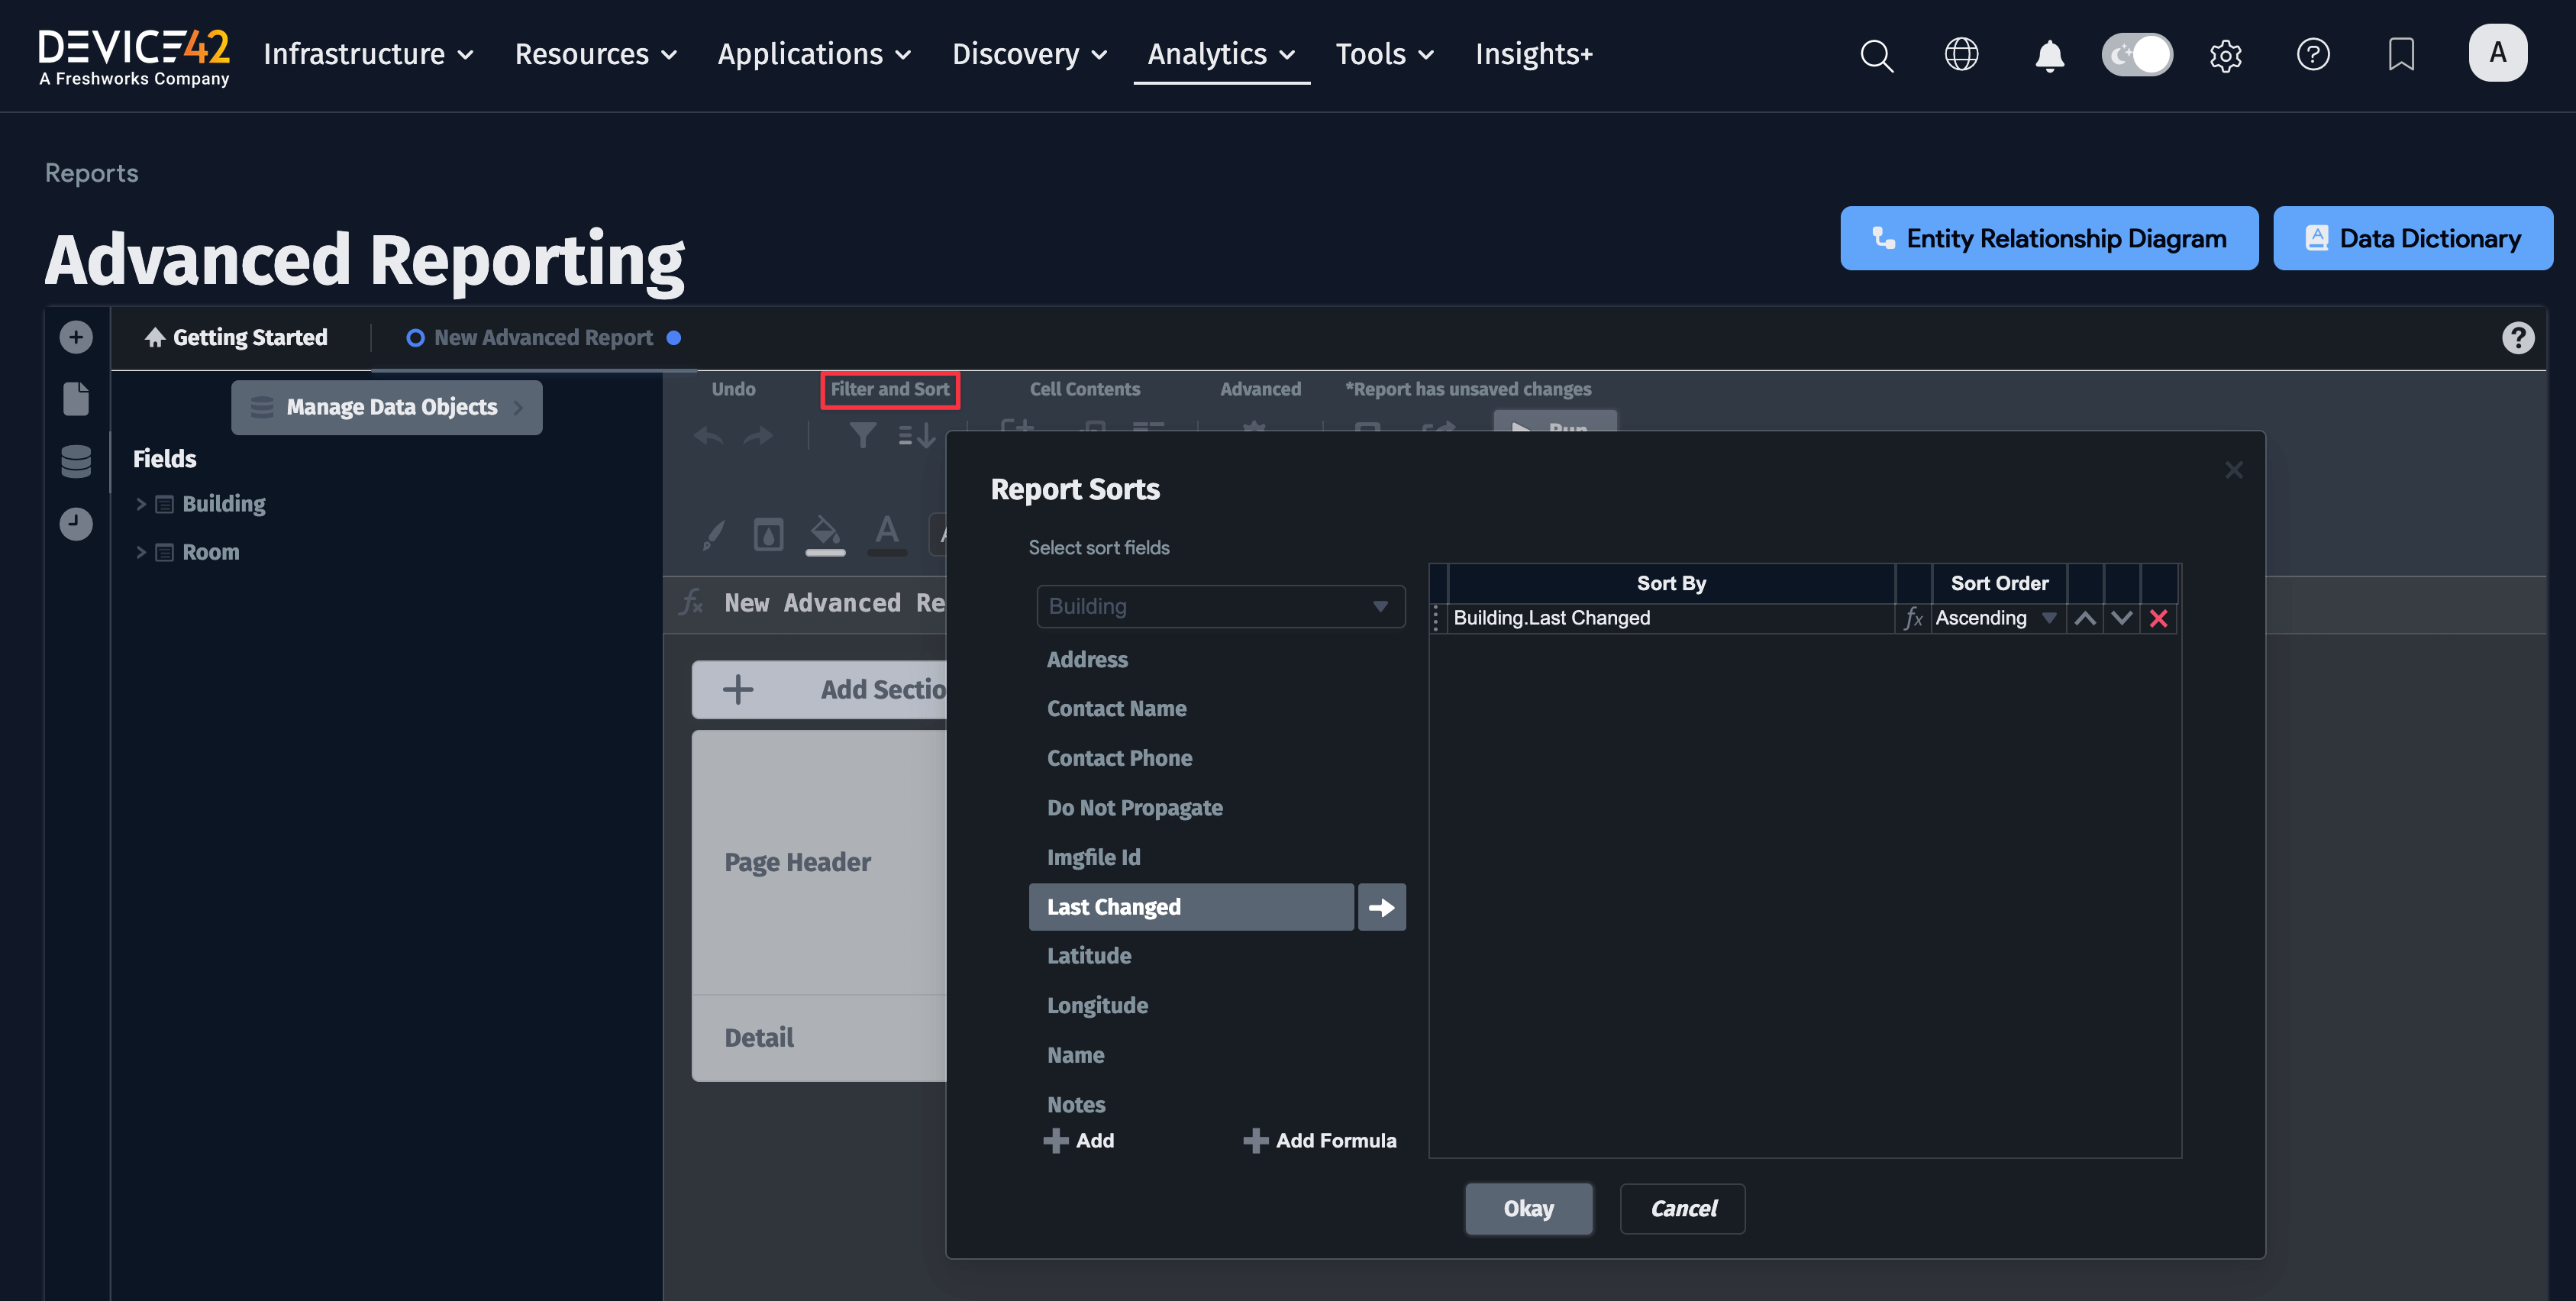
-
You can also sort and filter in Advanced Reporting using SQL joins. The Advanced Reporting GUI makes it very straightforward. Click the gear icon under Advanced and then select Joins:
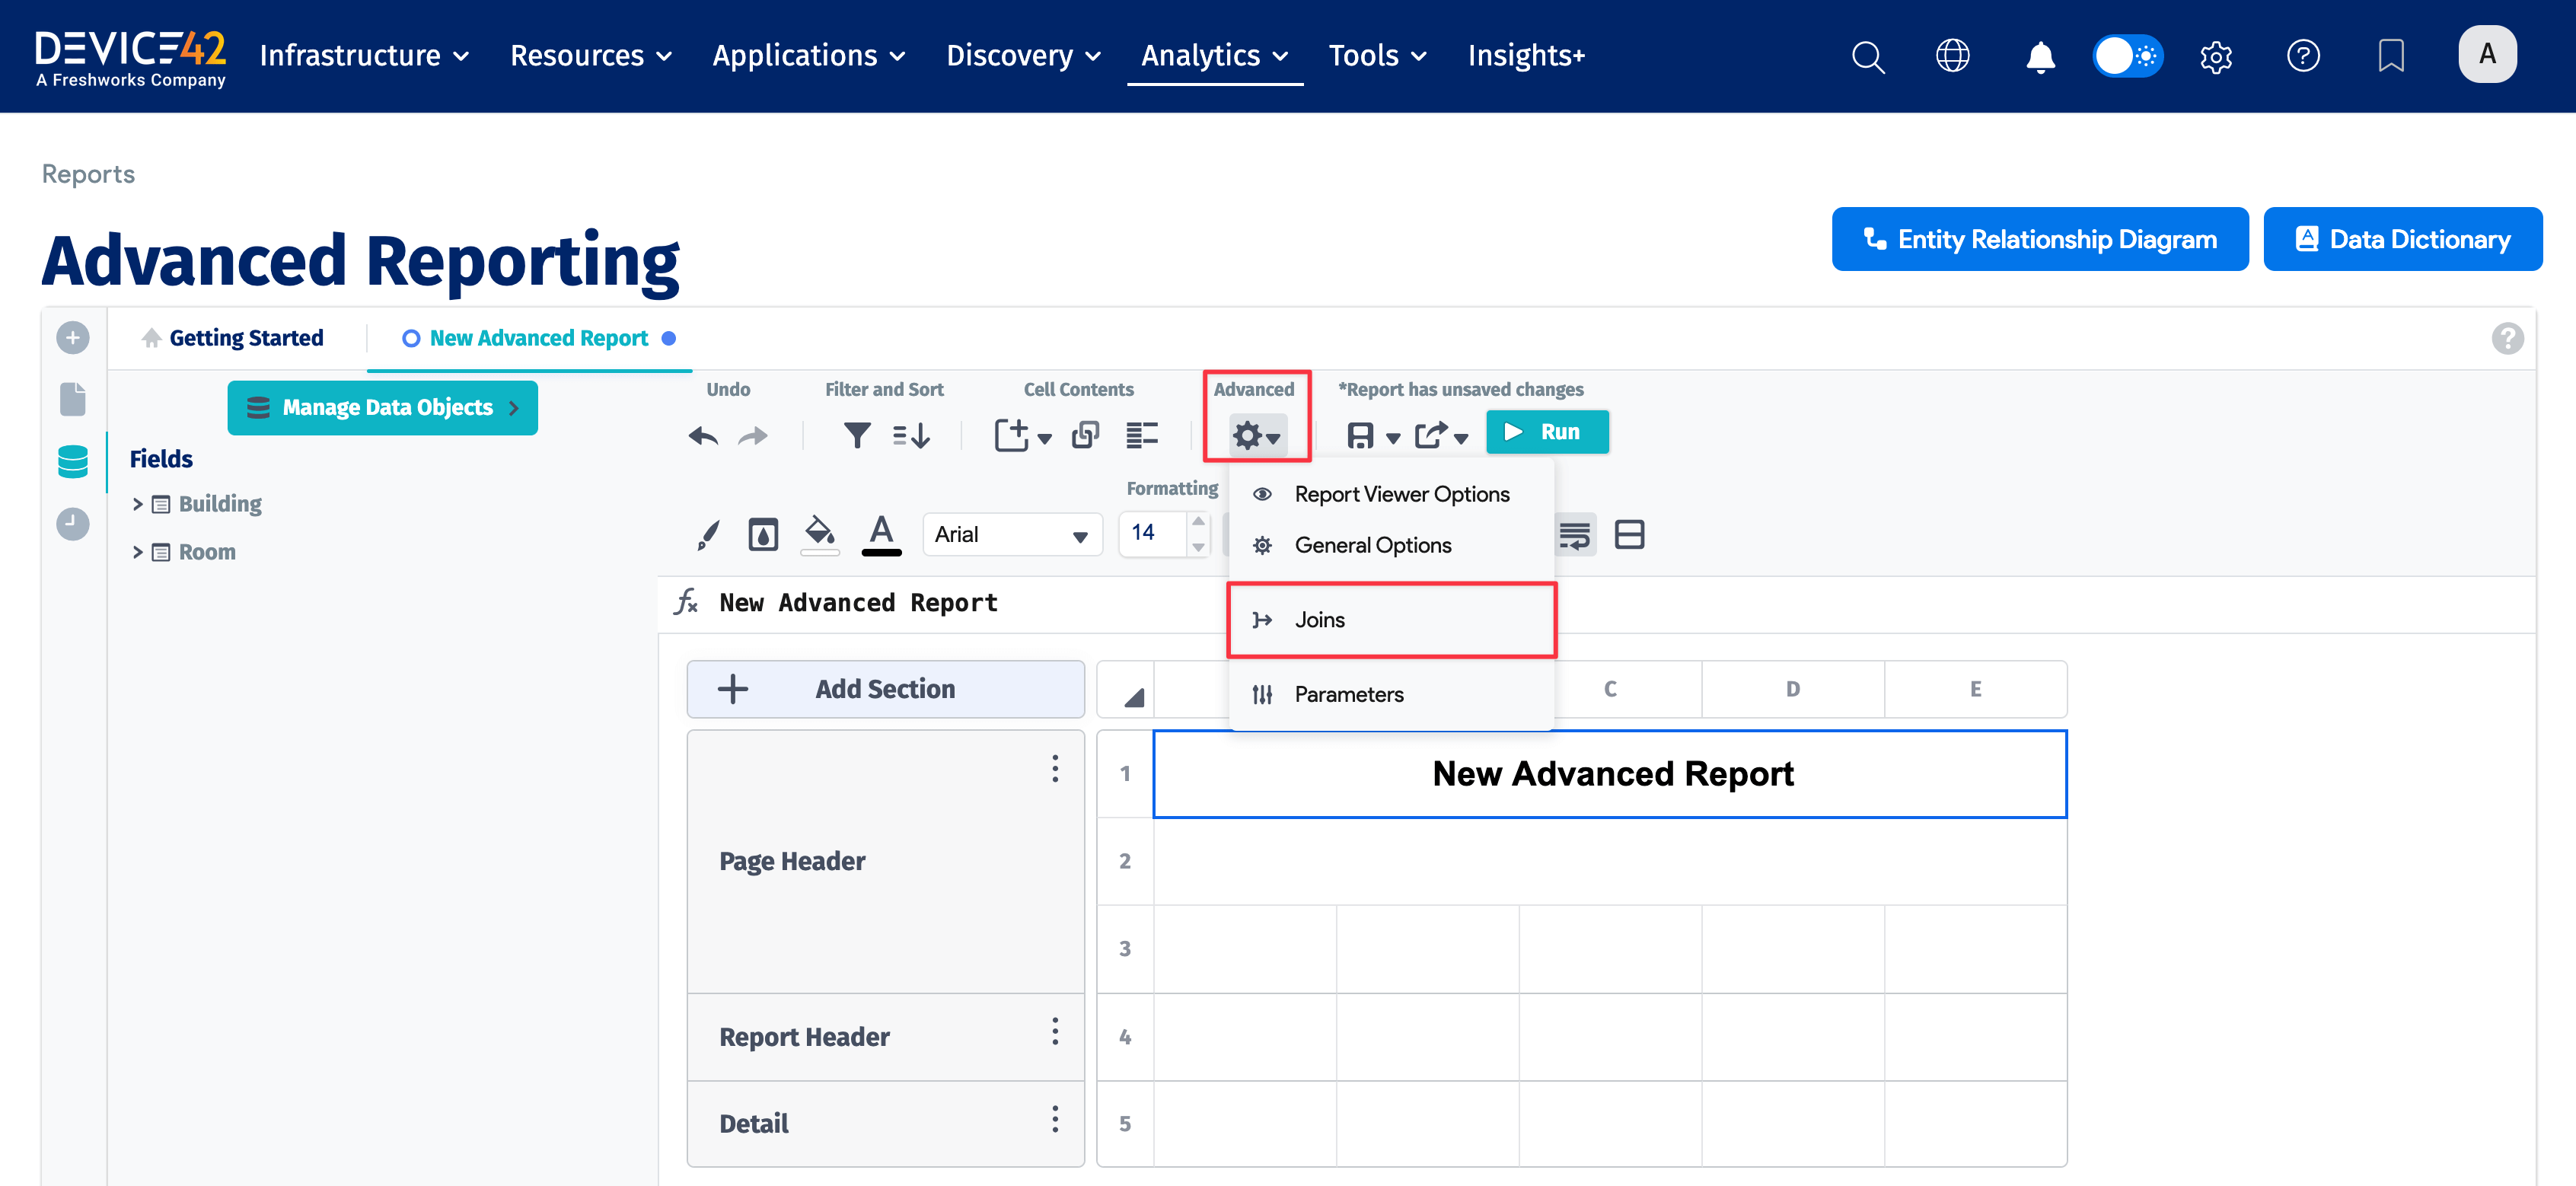
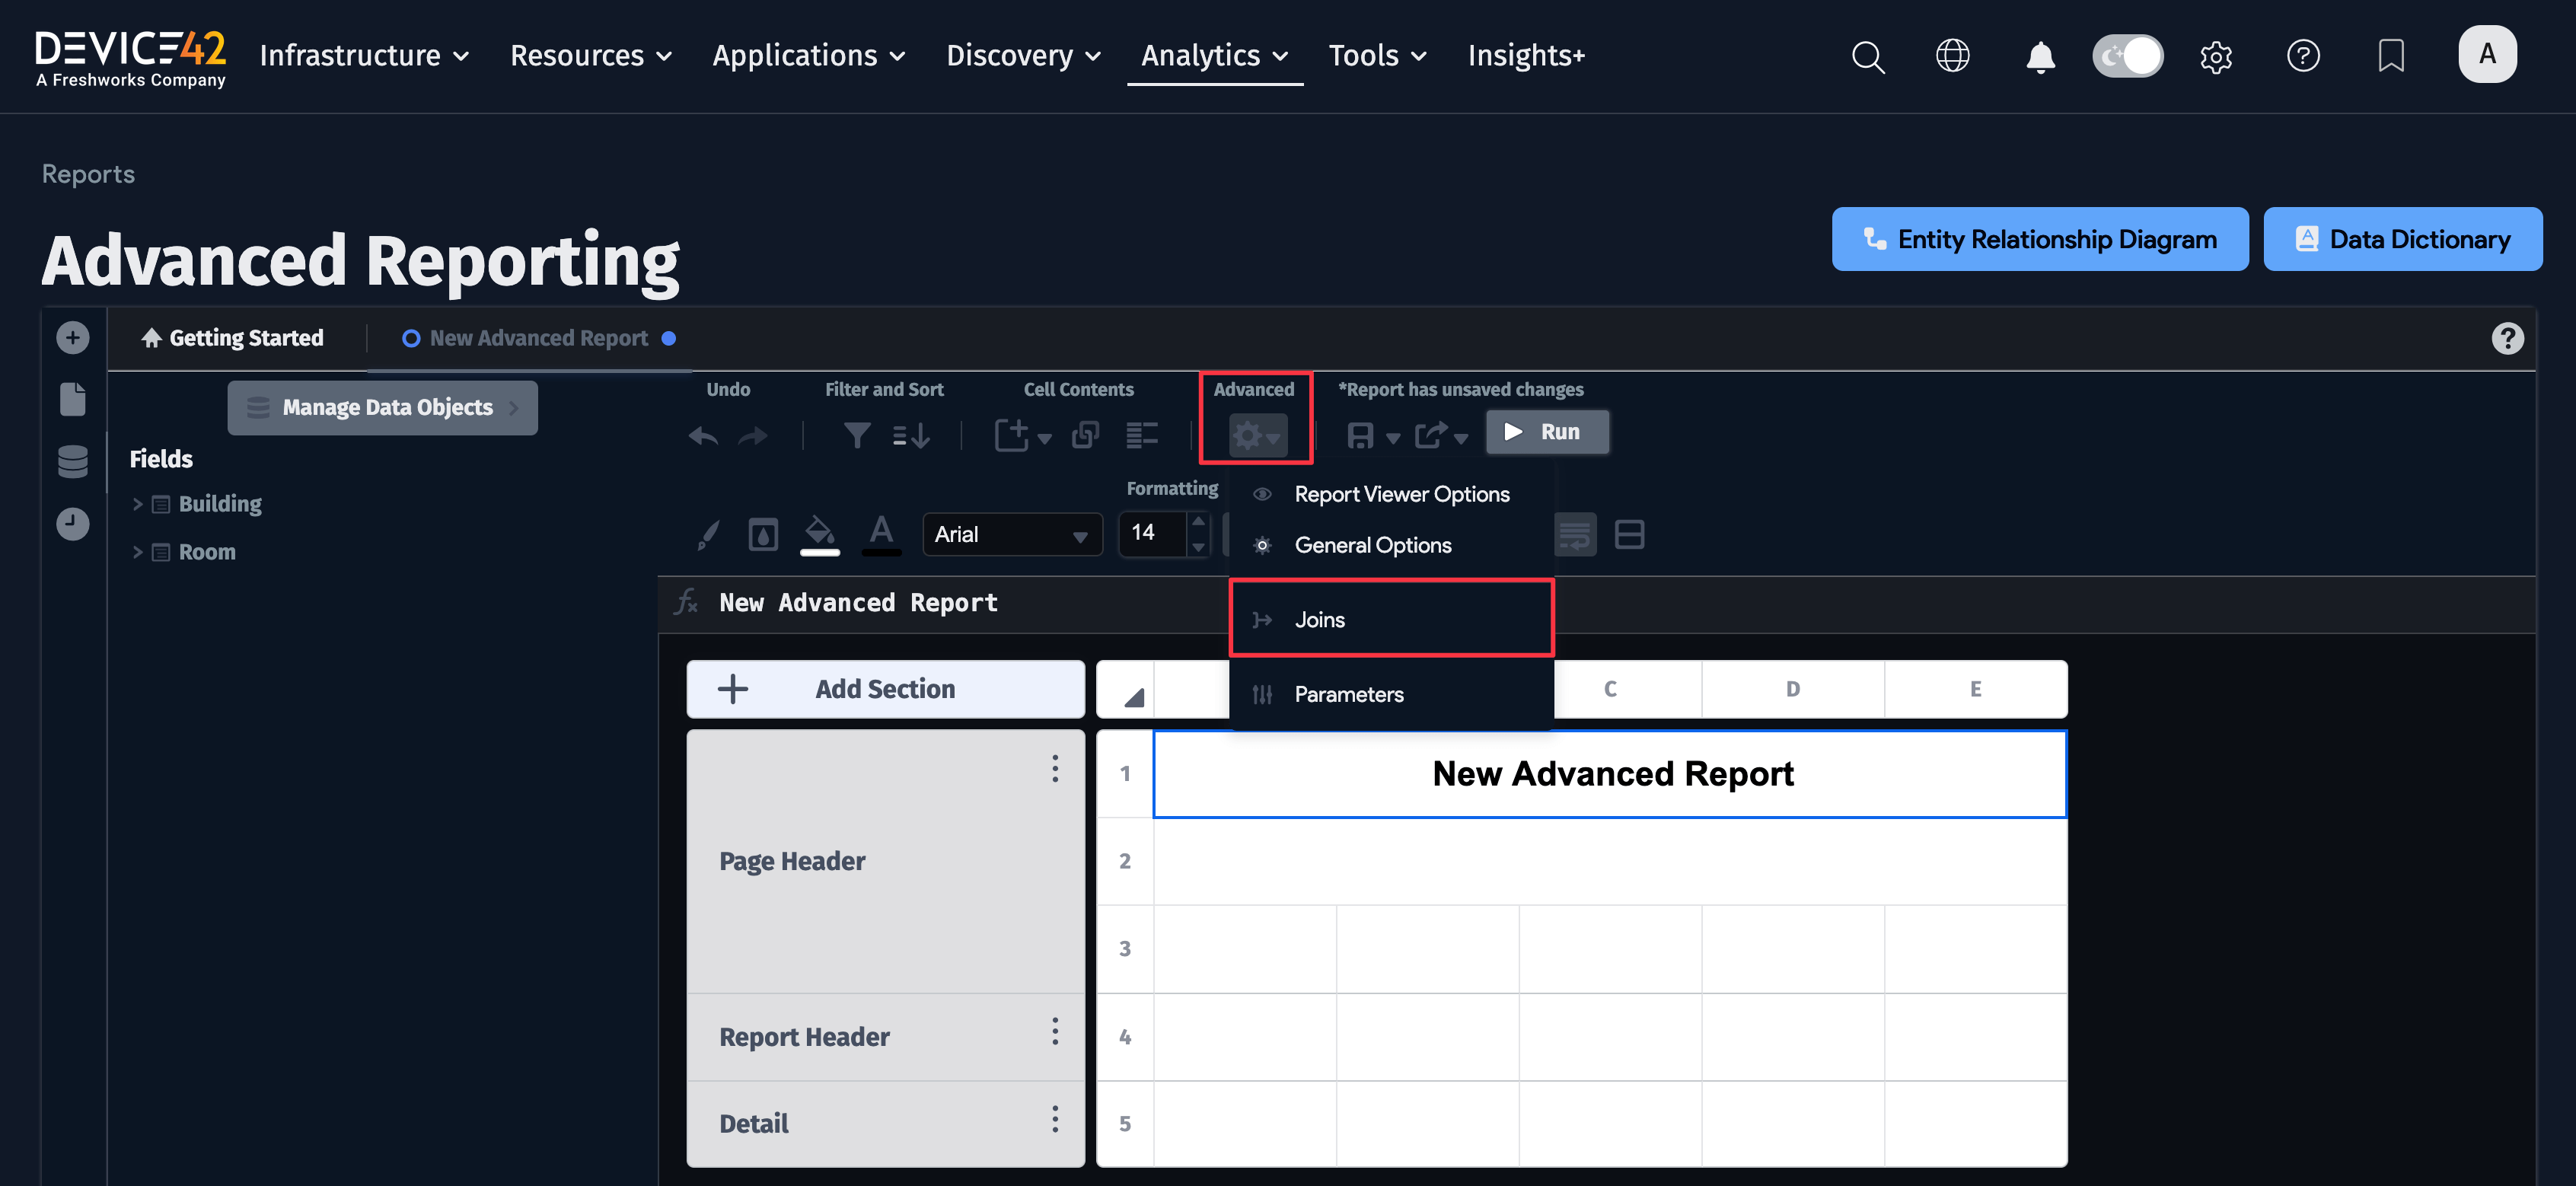
-
Configure any desired custom filters via the Joins window:
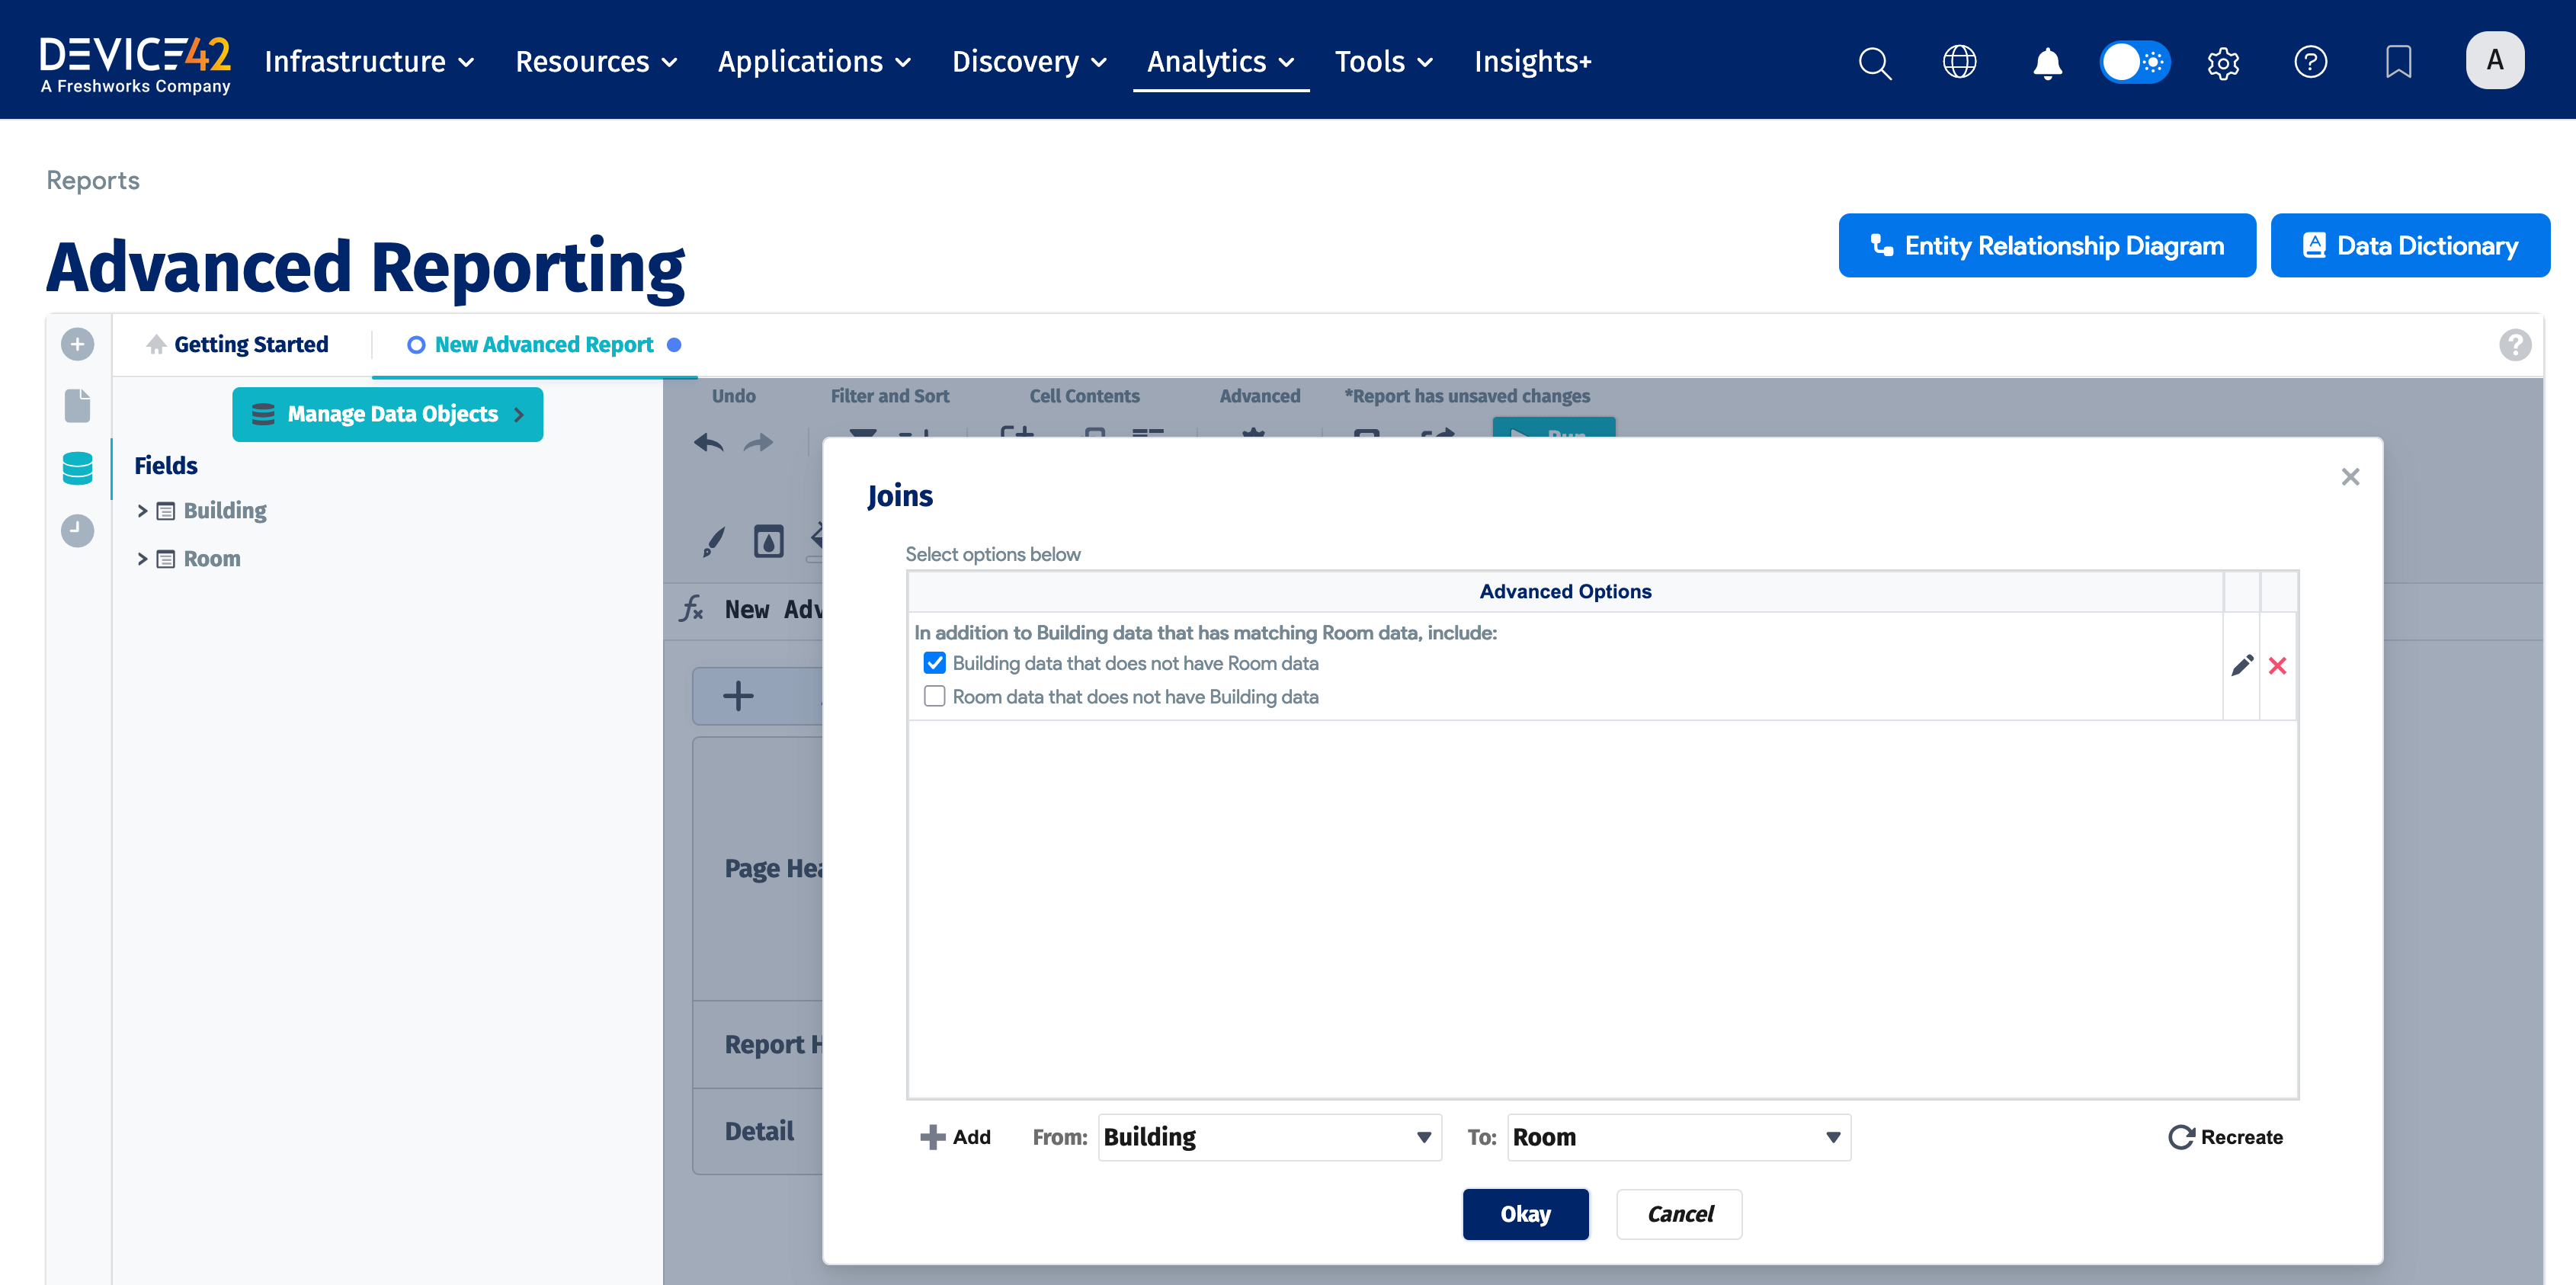
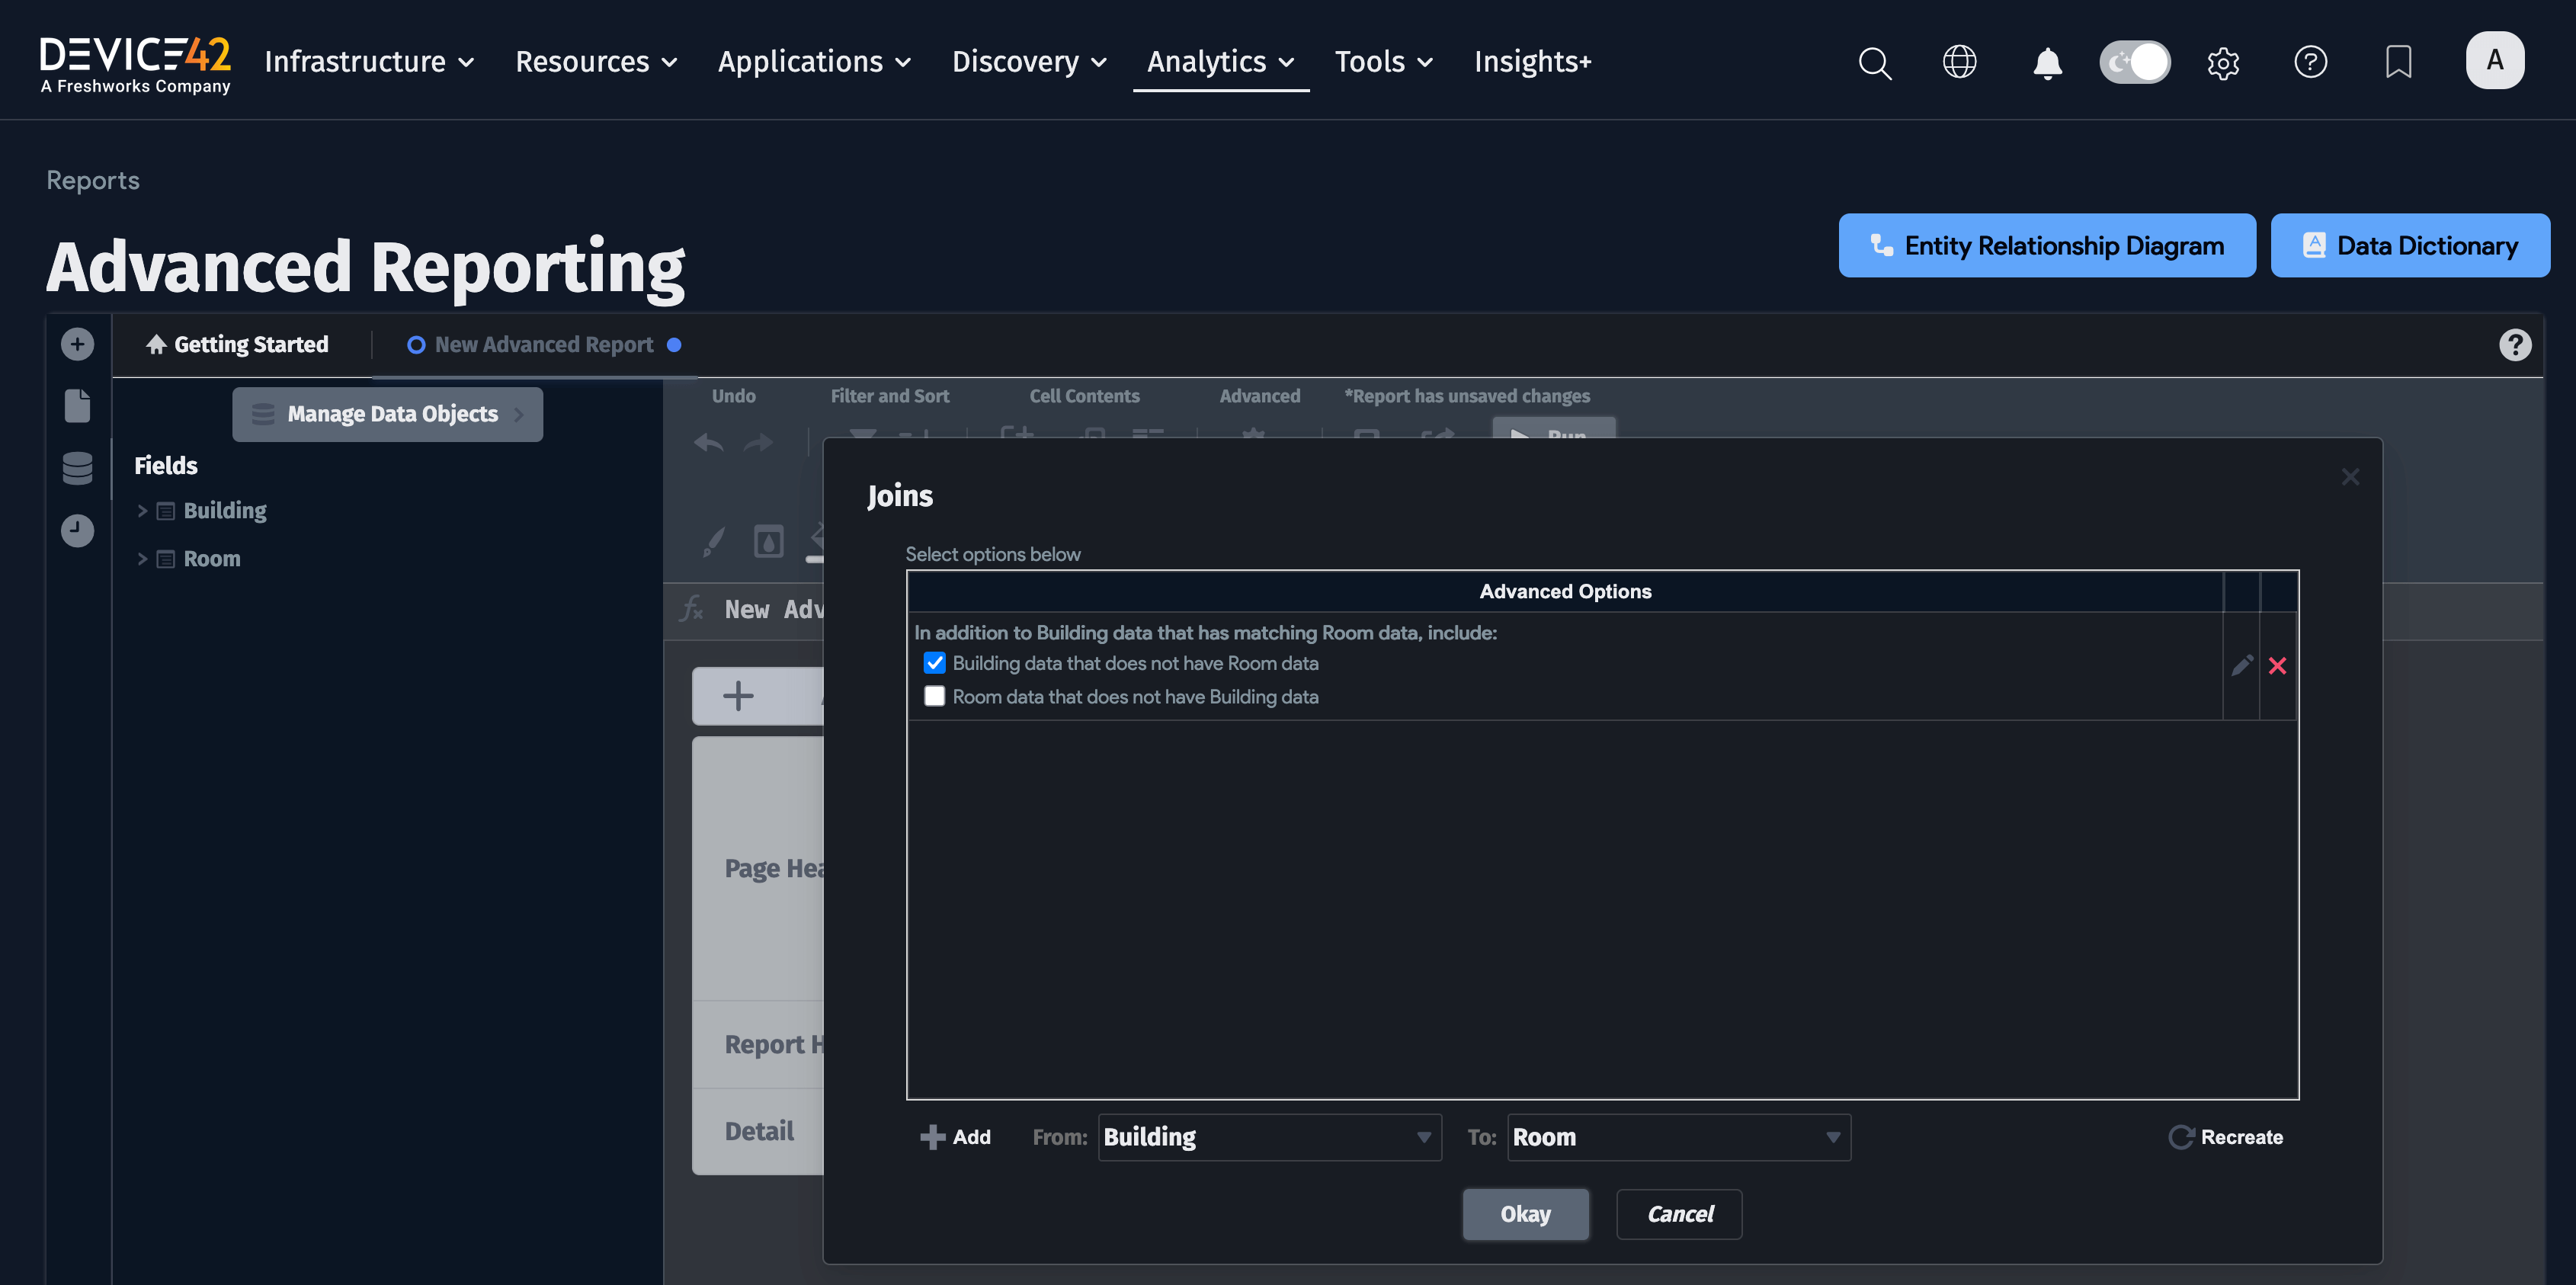
-
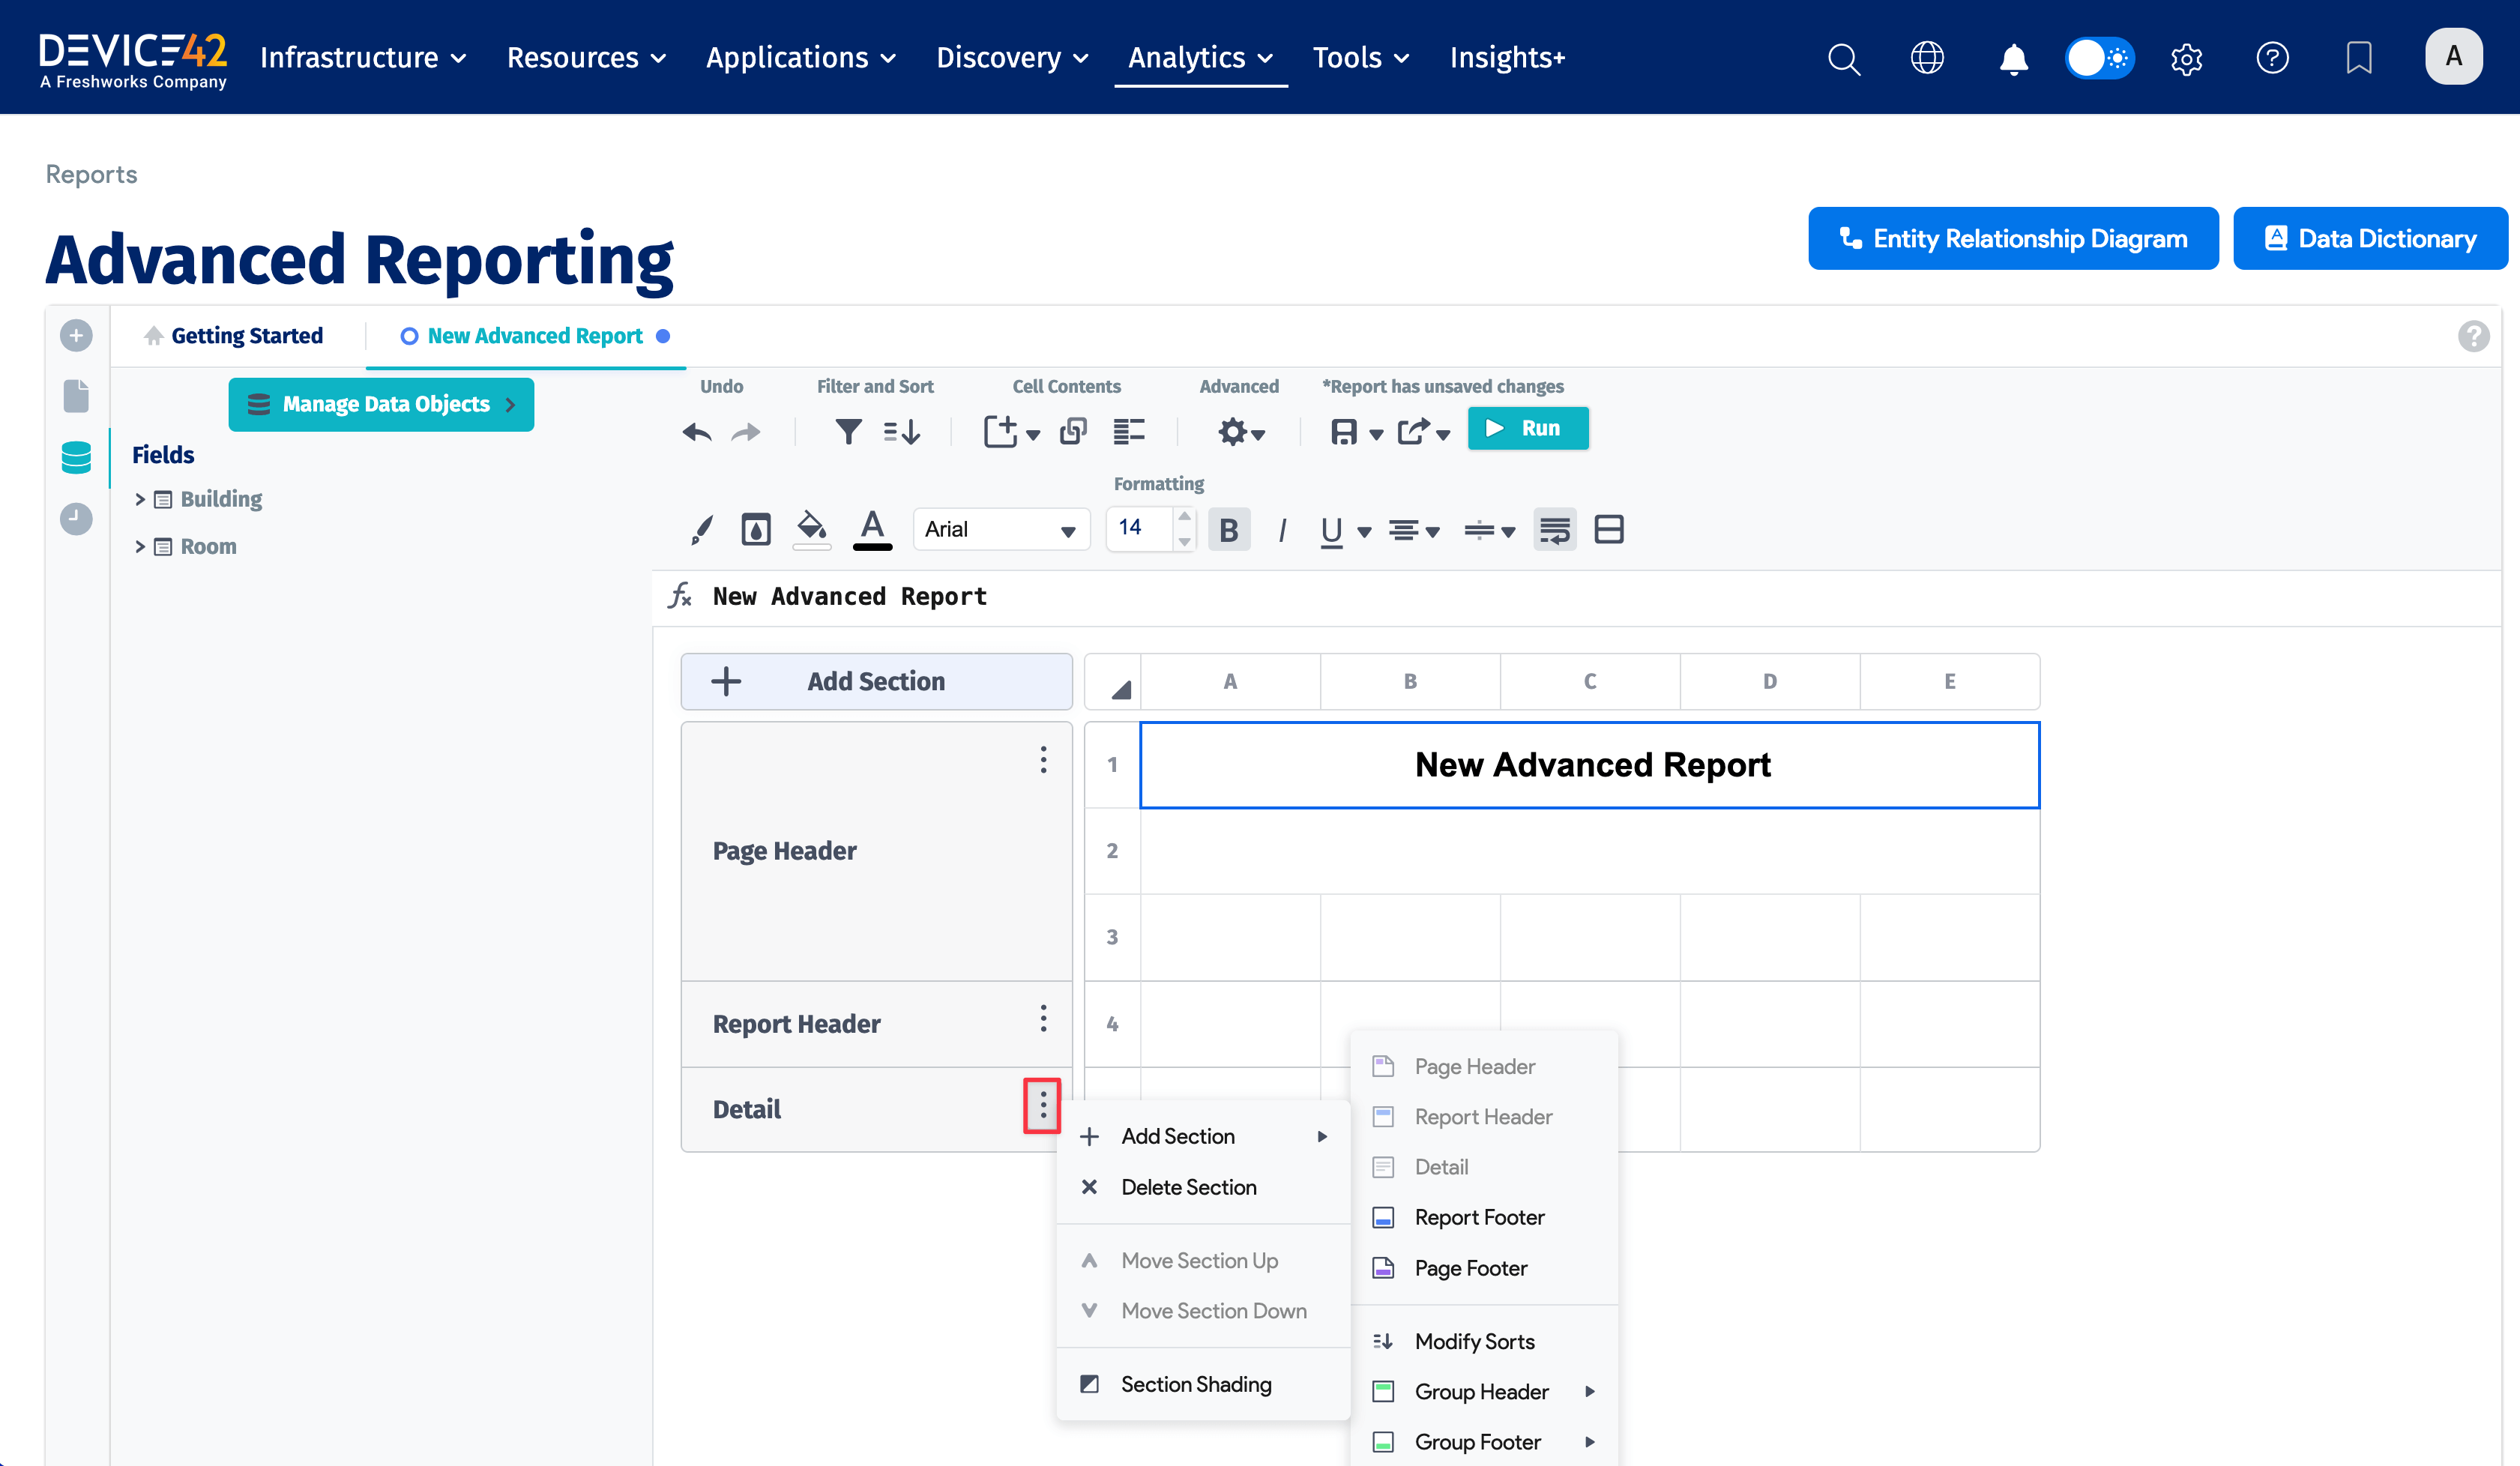
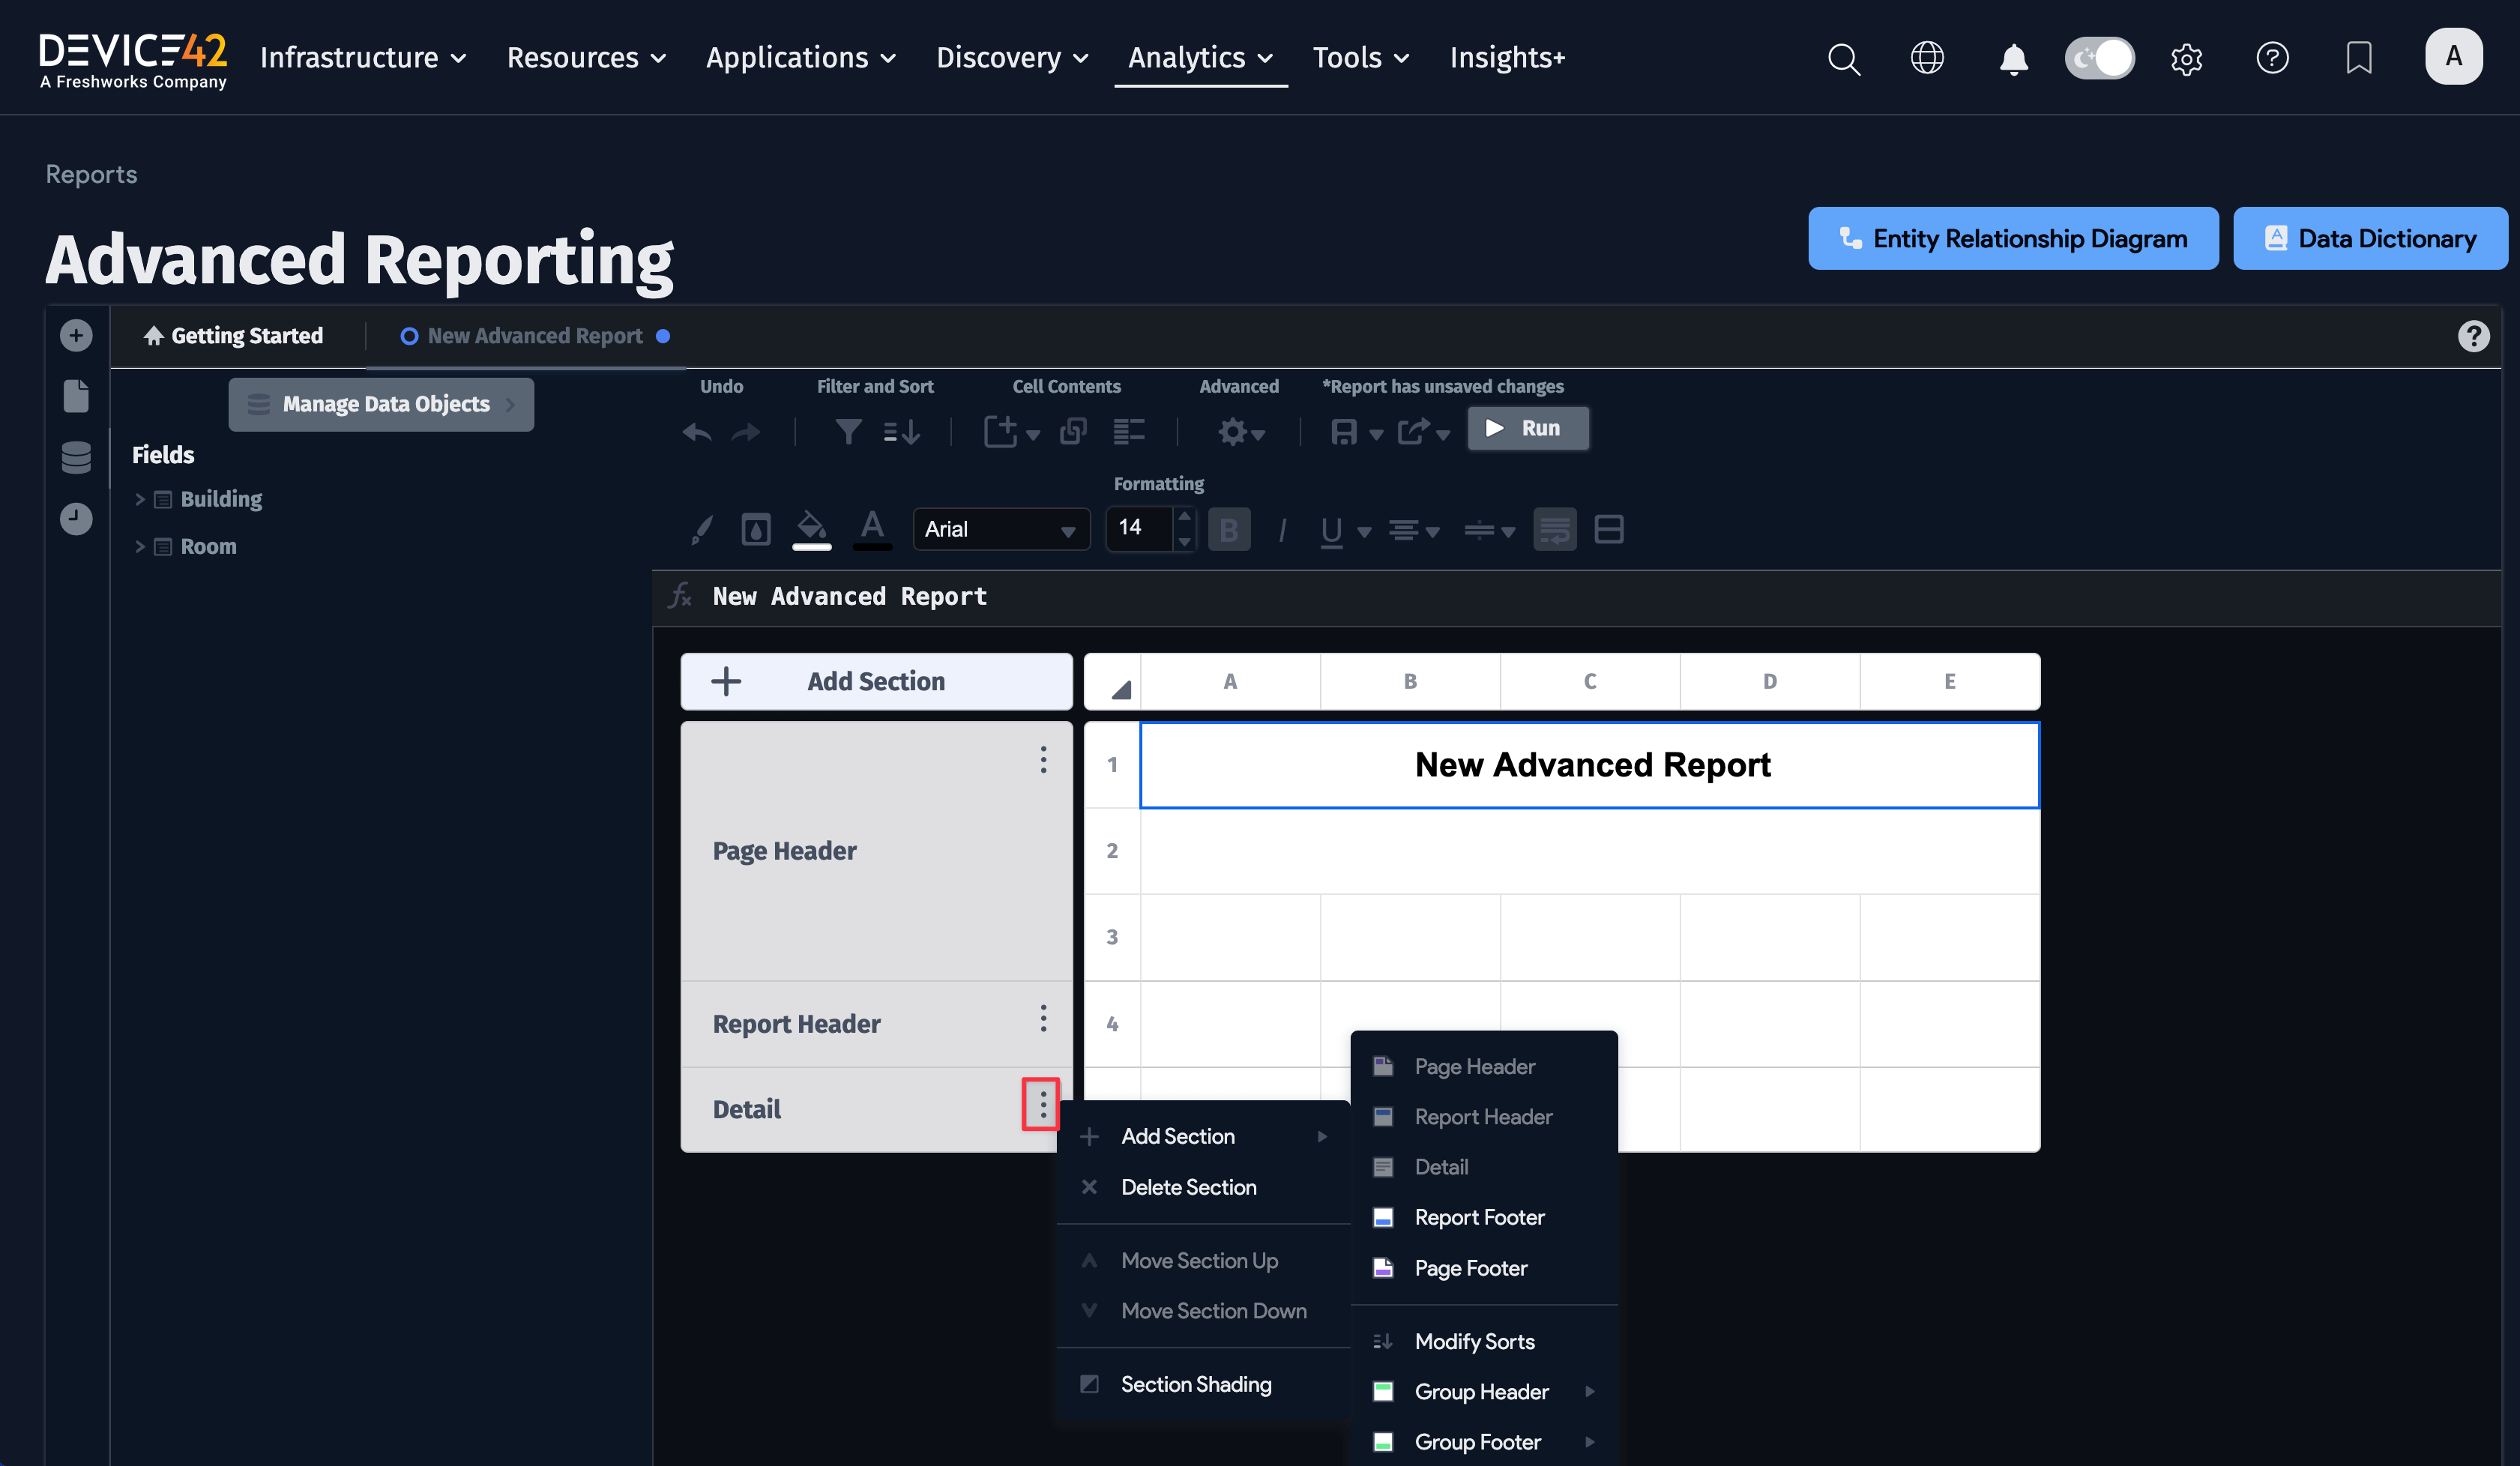
Finally, configure your report layout. Select parameters you are interested in from the parameter pool on the left, double-clicking each to add to the report. Next, add any other fields that are relevant to your report. Now that all your fields are on the report, order them in the report.
Sorting and Ordering Report Data
Device42 uses joins to handle sorting in Advanced Reporting by matching primary and foreign keys. Note that Advanced Reporting does a pretty good job attempting to set these for you, but for complicated reports, you will have to set or customize the joins yourself. You'll want to create joins that result in the data you care about, consulting the Device42 data dictionary when necessary. Note that each primary key should almost always have a matching foreign key, from being a primary key matching to a foreign key. If you are seeing data that you didn't expect, there may still be joins that need to be modified. Access joins by clicking the gear icon and selecting Joins.
Use a DOQL Query To Create a Report Dataset
With Device42's Advanced Reporting, you can use DOQL (a SQL derivative) to create your dataset for your report.
To create a report based on a DOQL query, name the report, and then choose Add SQL during the Category selection step of report creation instead of choosing any categories.
For a full set of steps in more detail, with pictures, see the dedicated Use Custom SQL in Advanced Report page.
Reporting Data Categories
The Data Dictionary
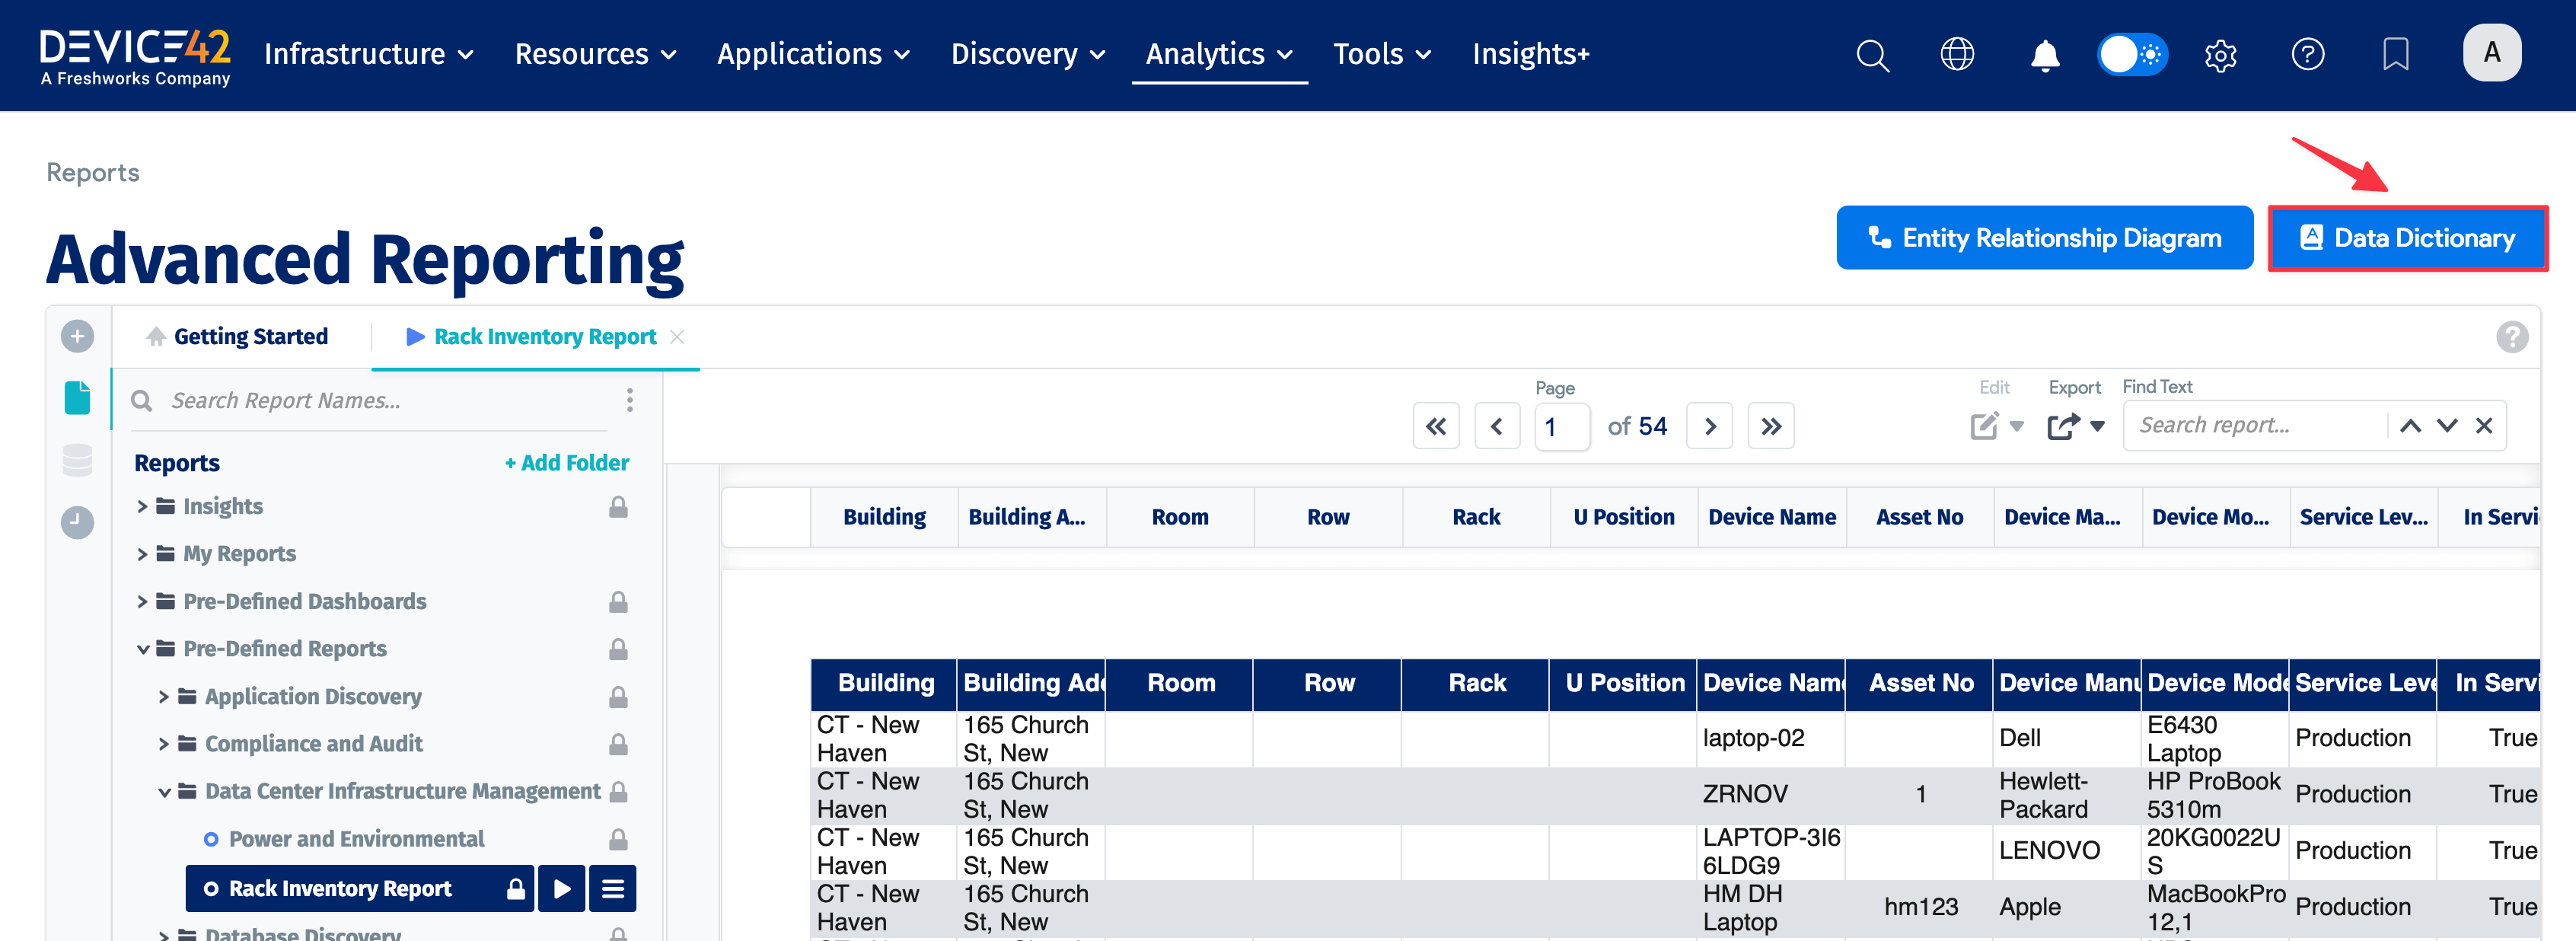
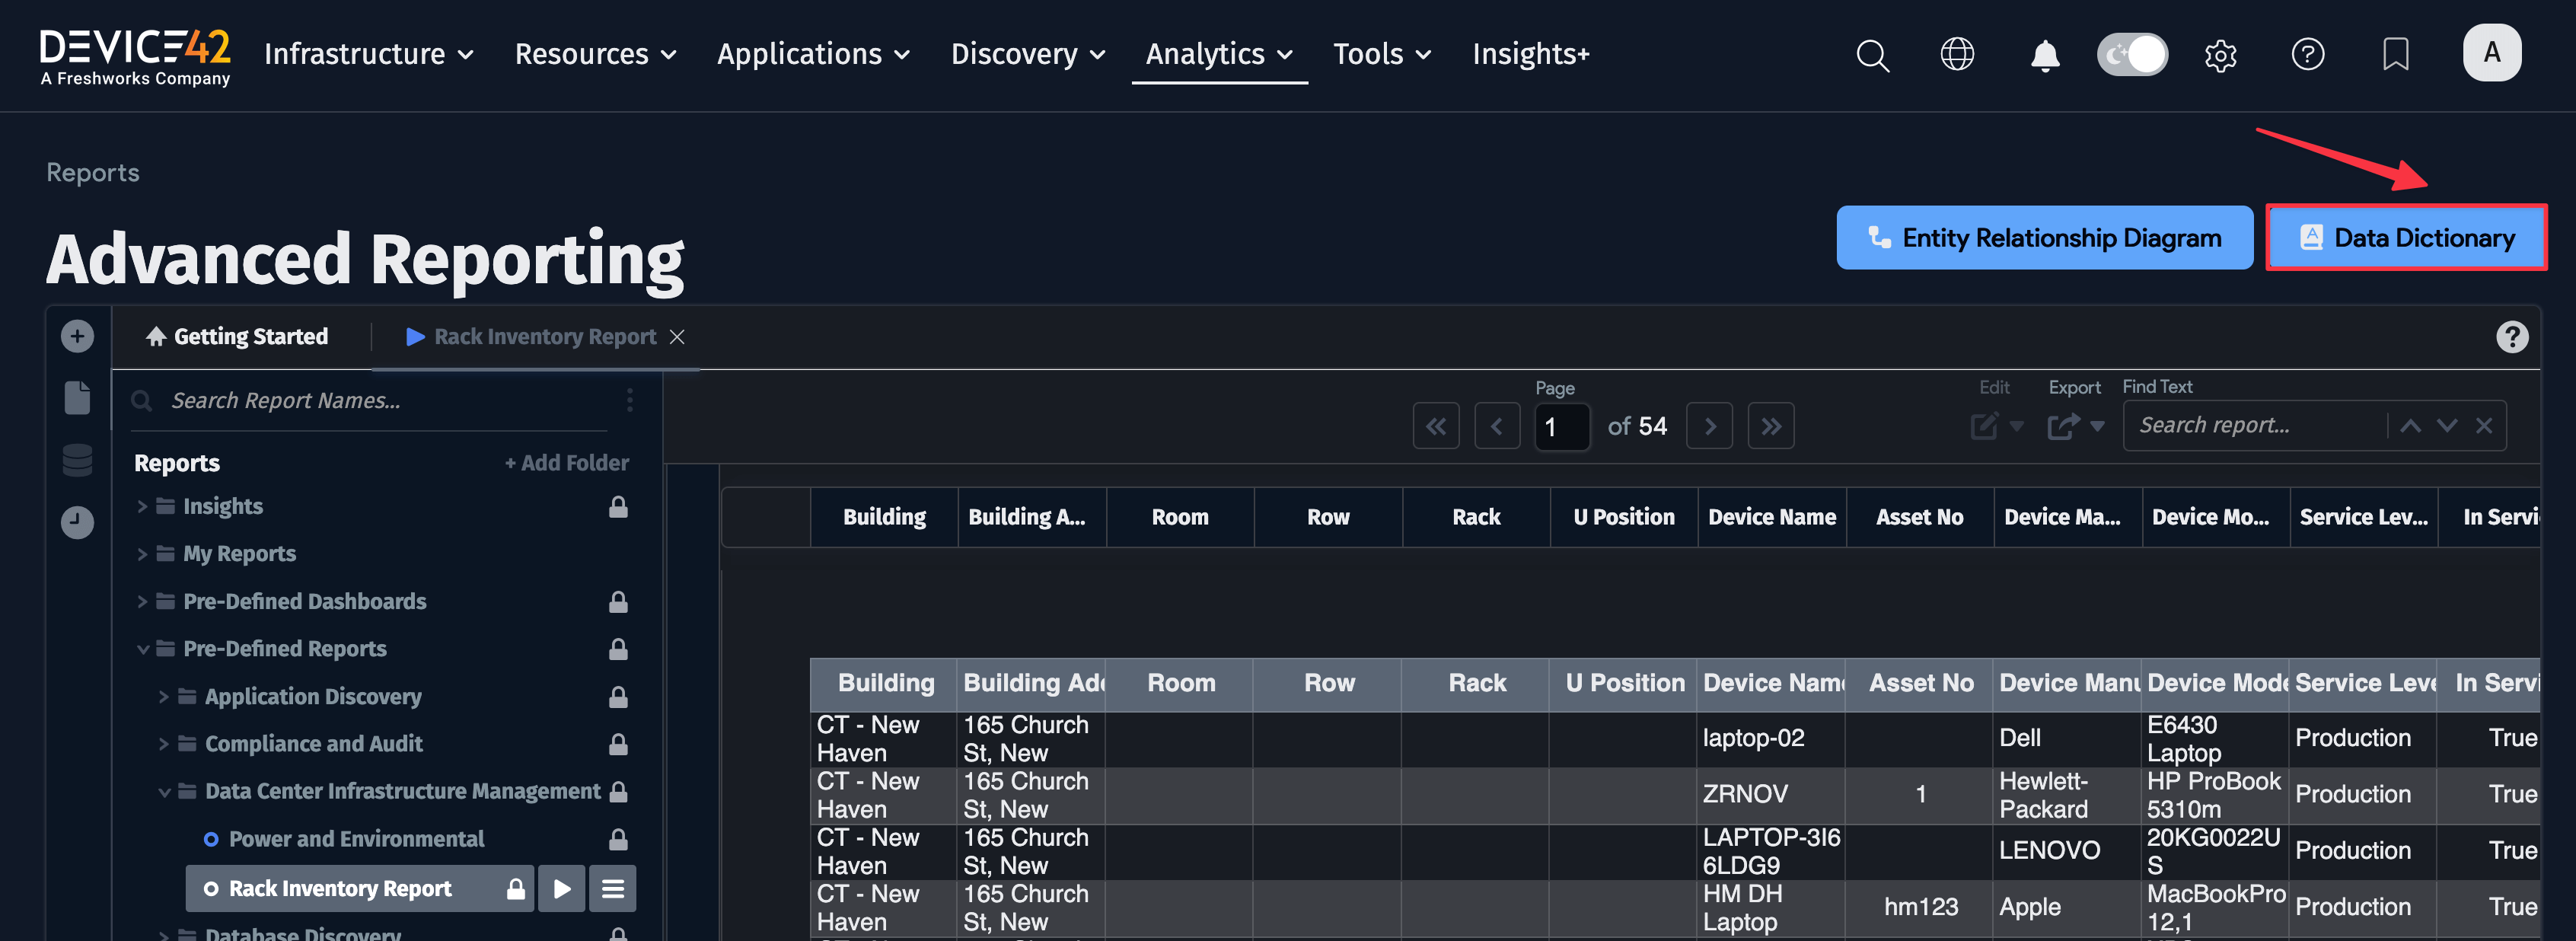
All data categories in Advanced Reporting are inherited directly from Device42's published database views. You can see all of them in the data dictionary, which can always be found by clicking the Data Dictionary button at the top right of the reporting window.
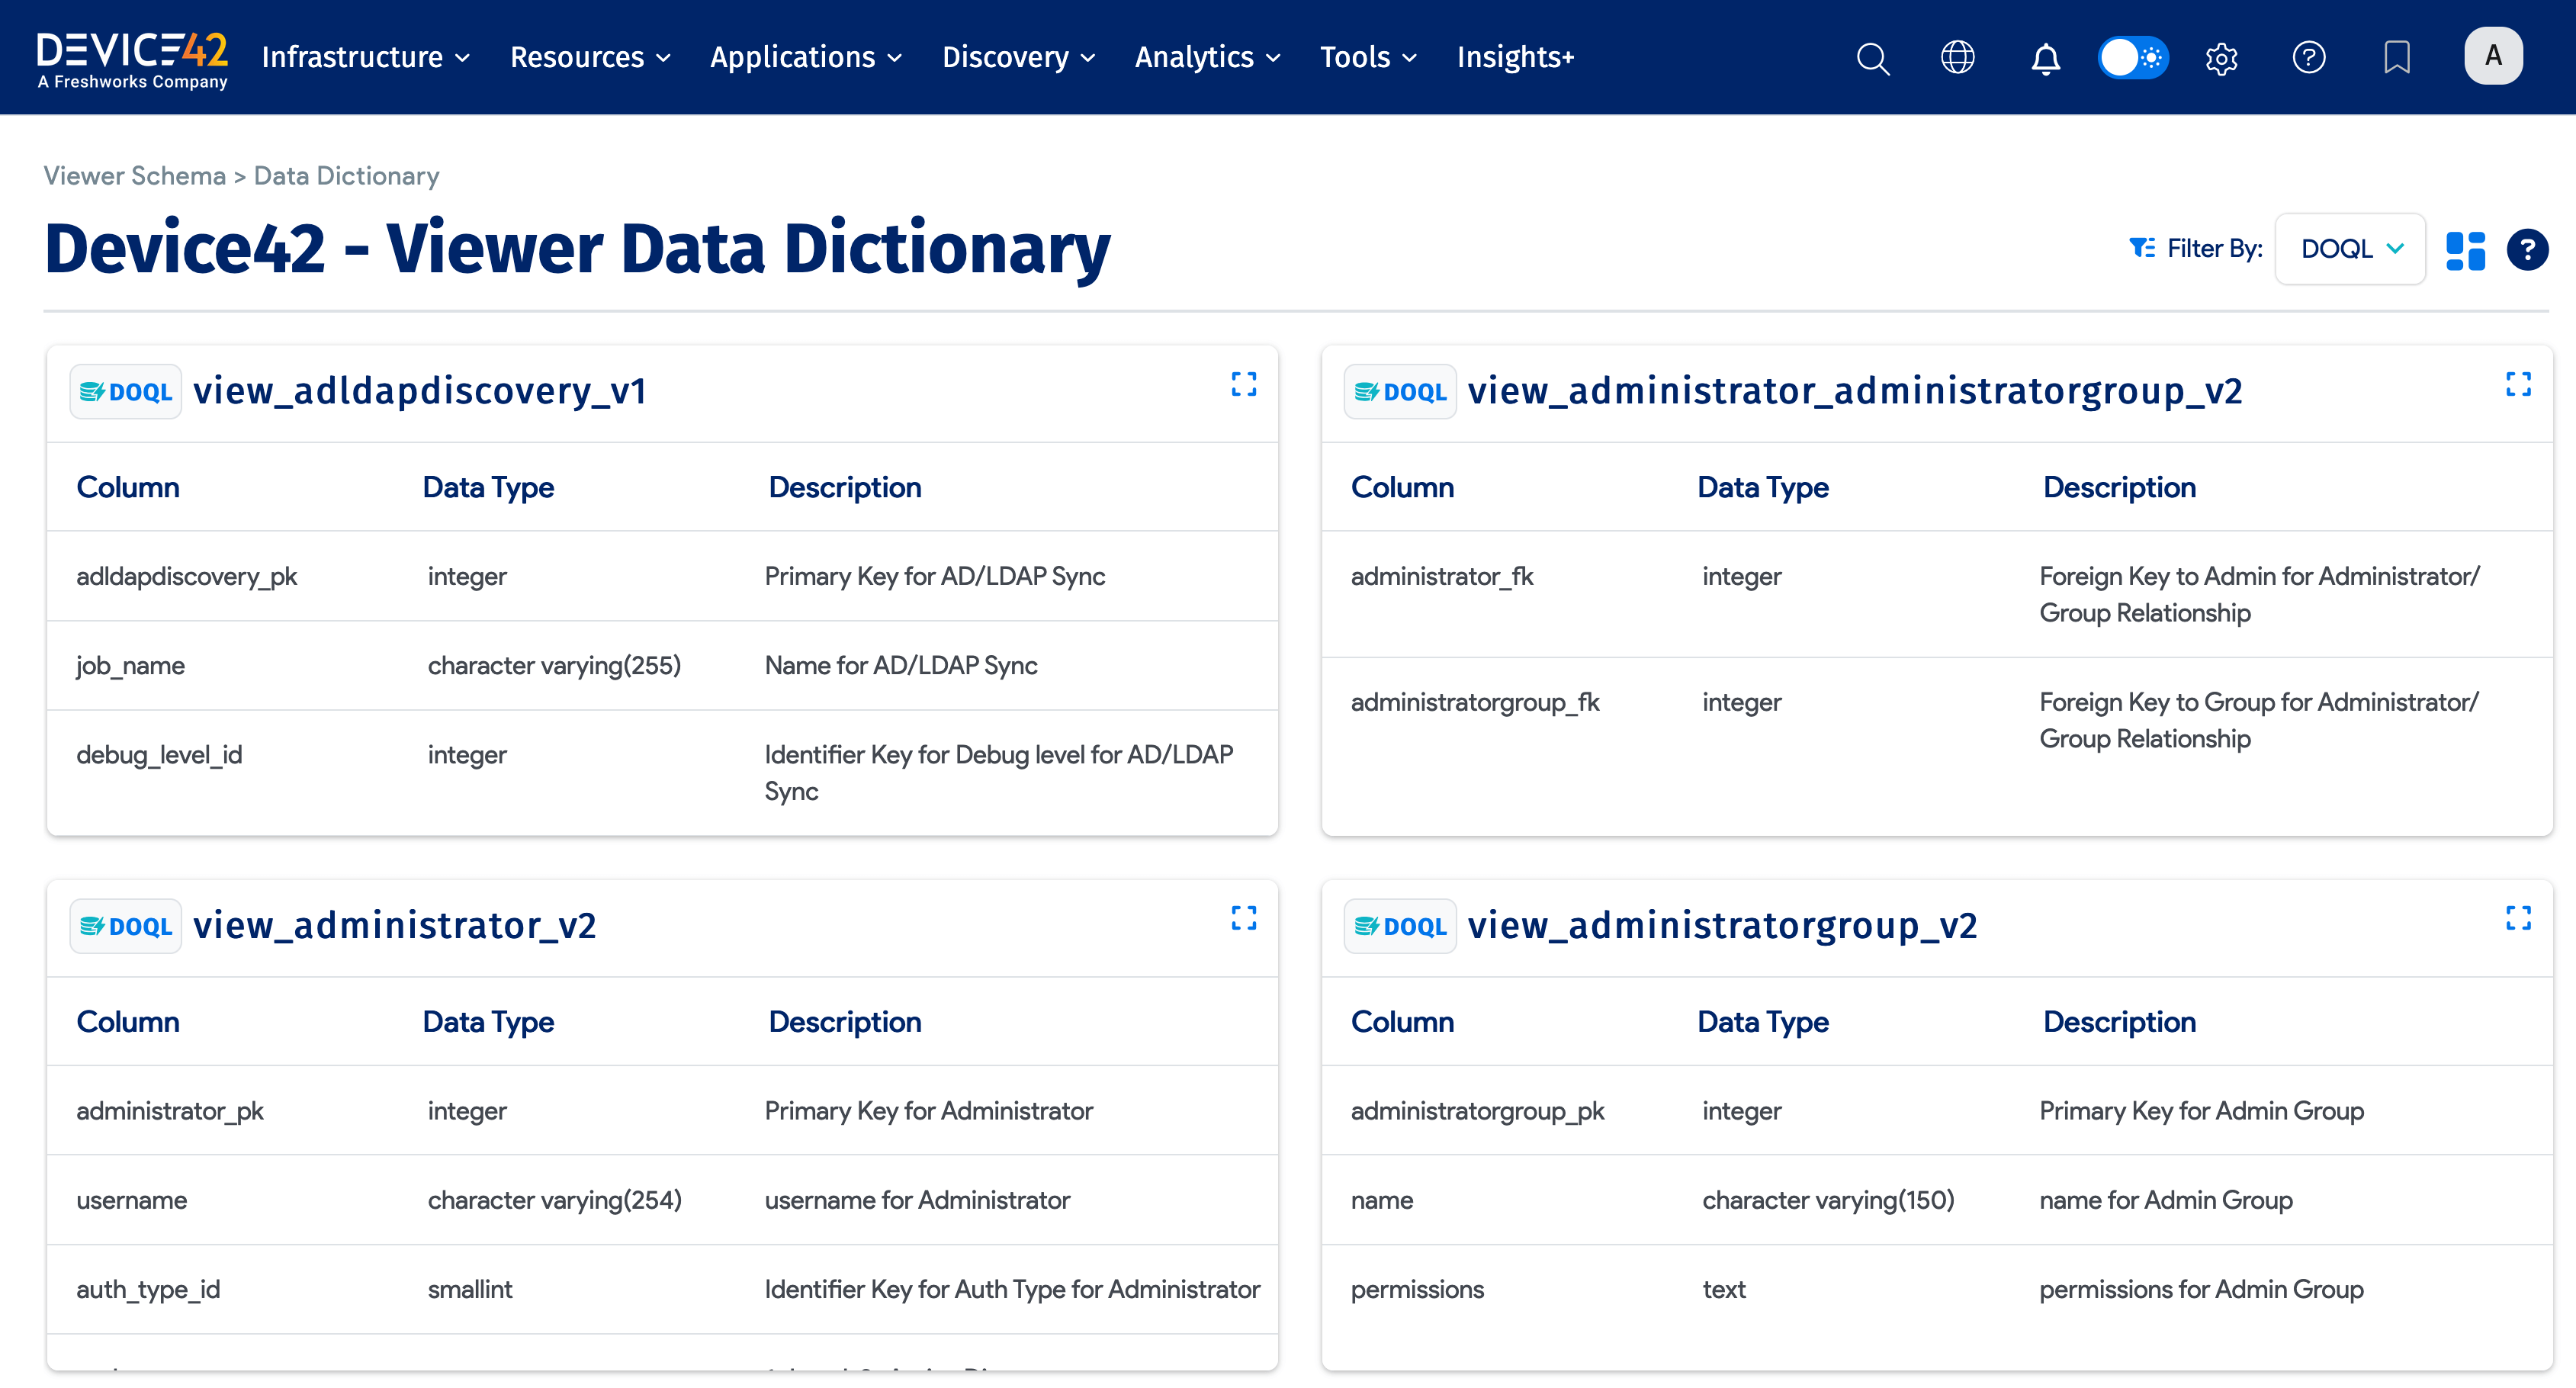
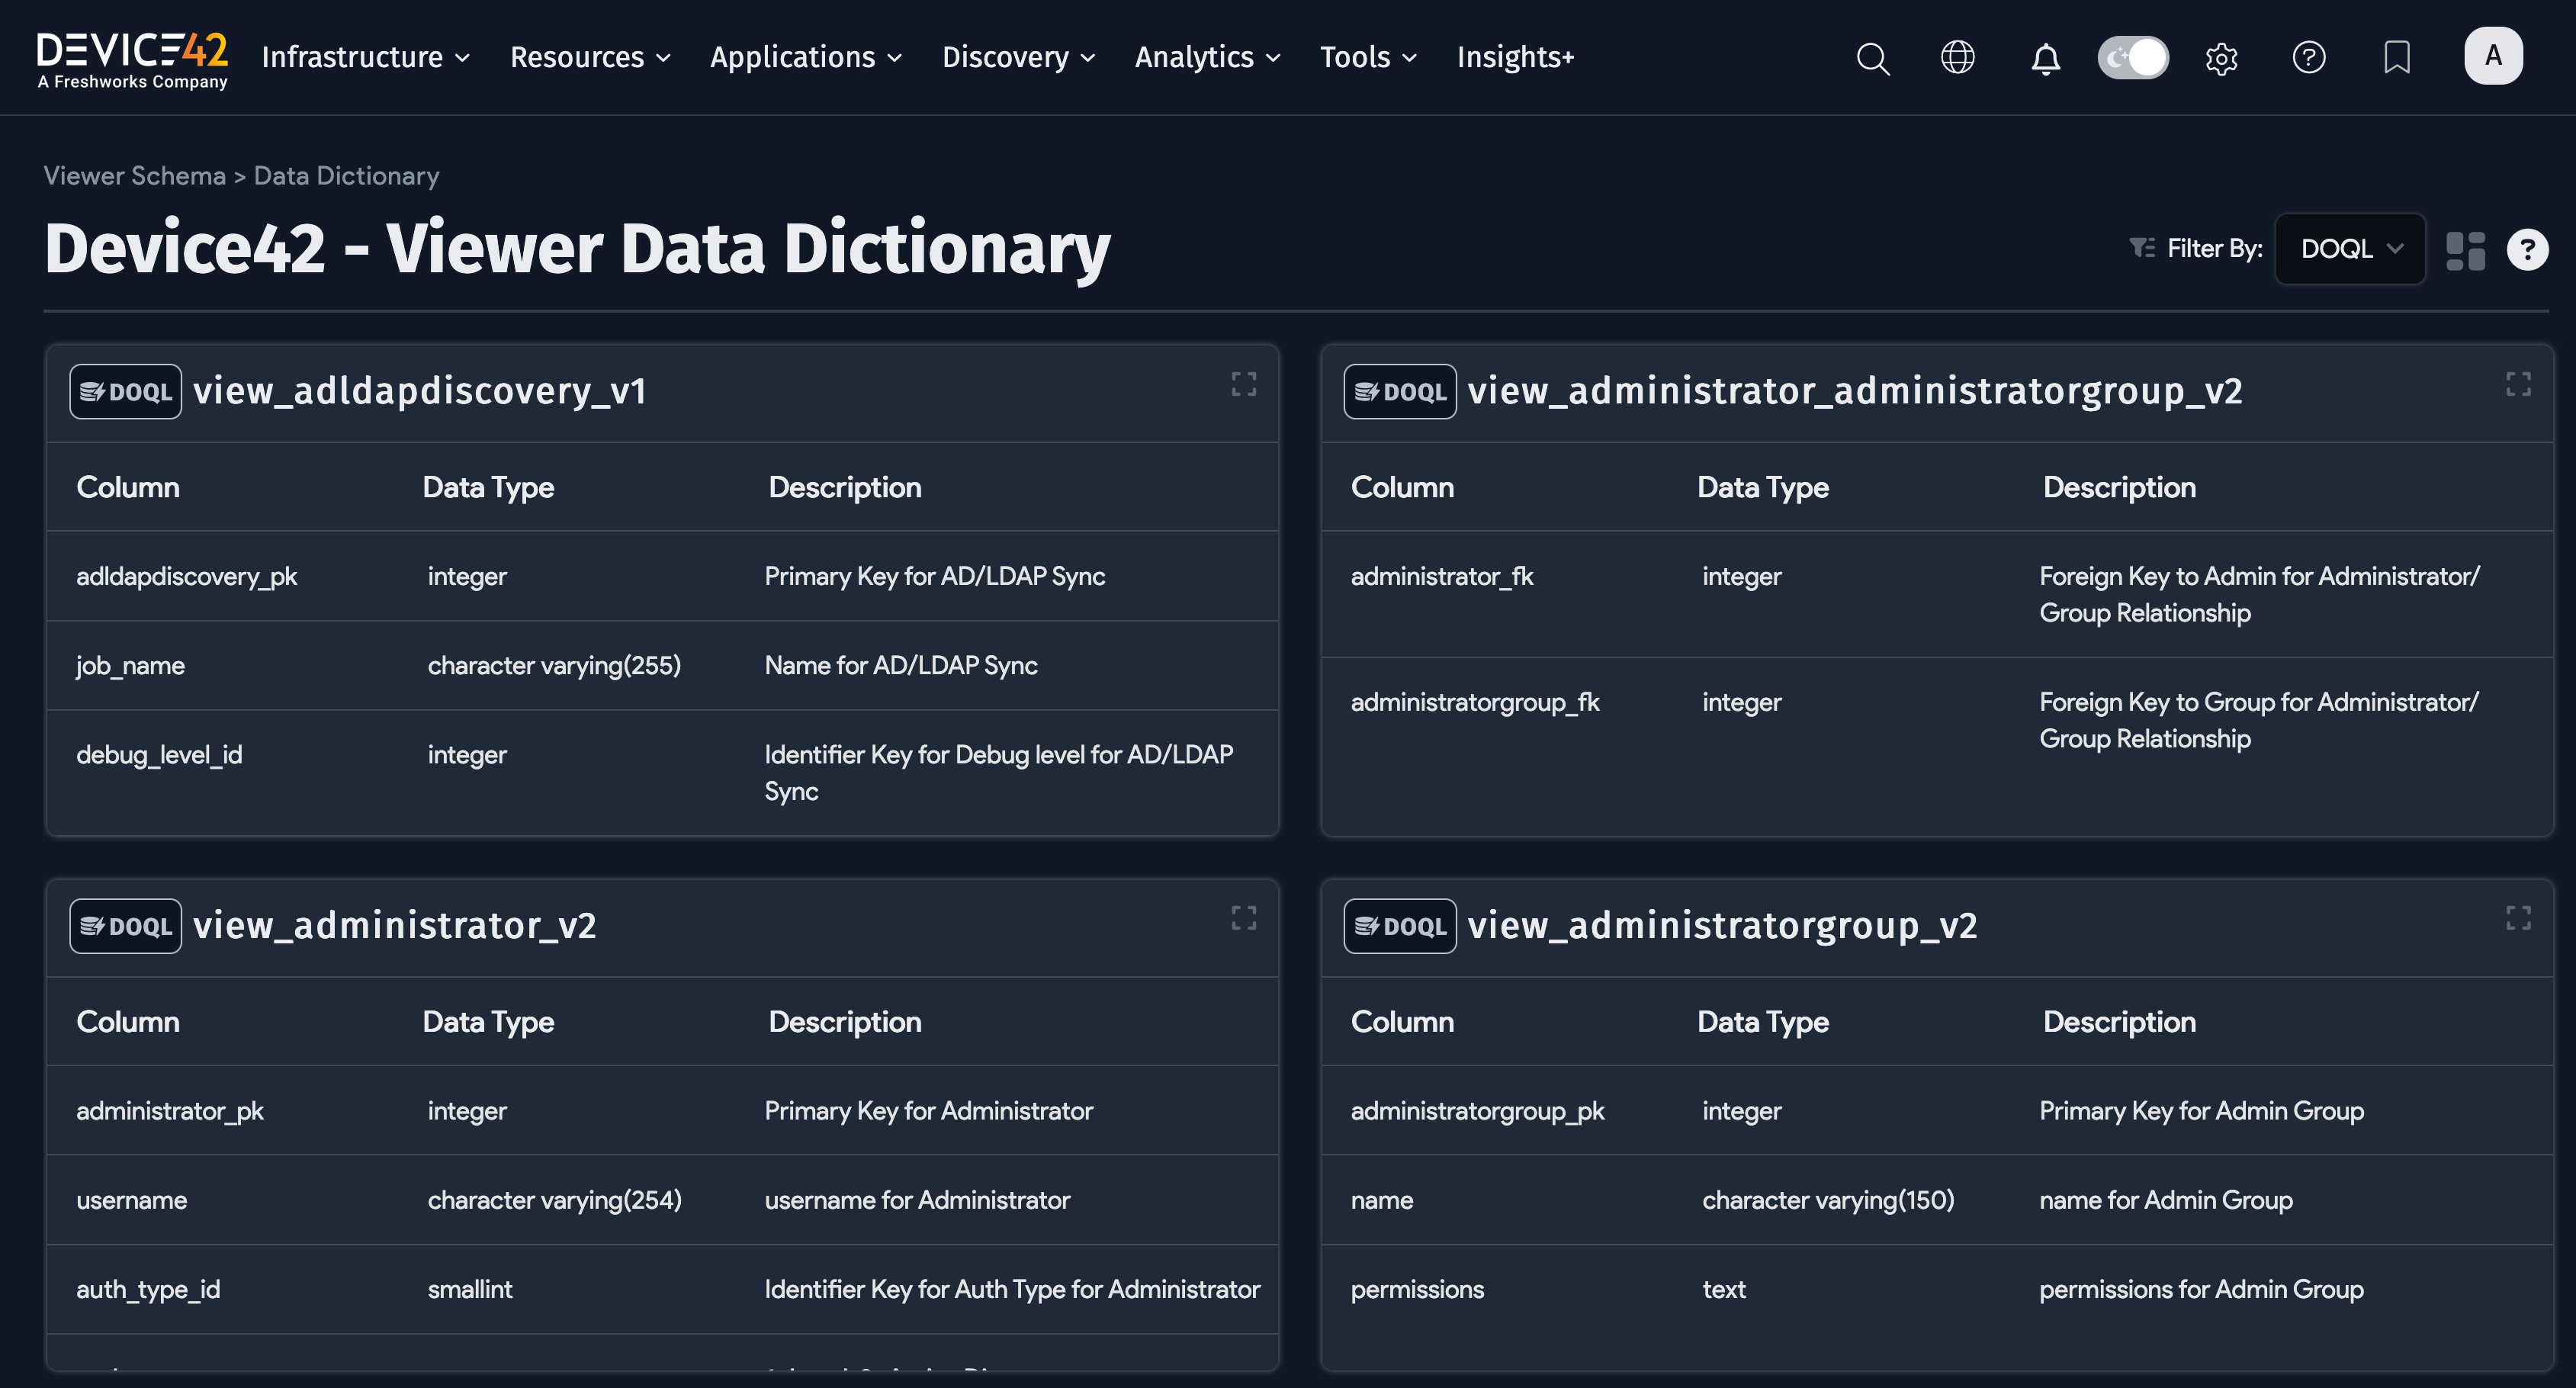
You can browse all available categories:
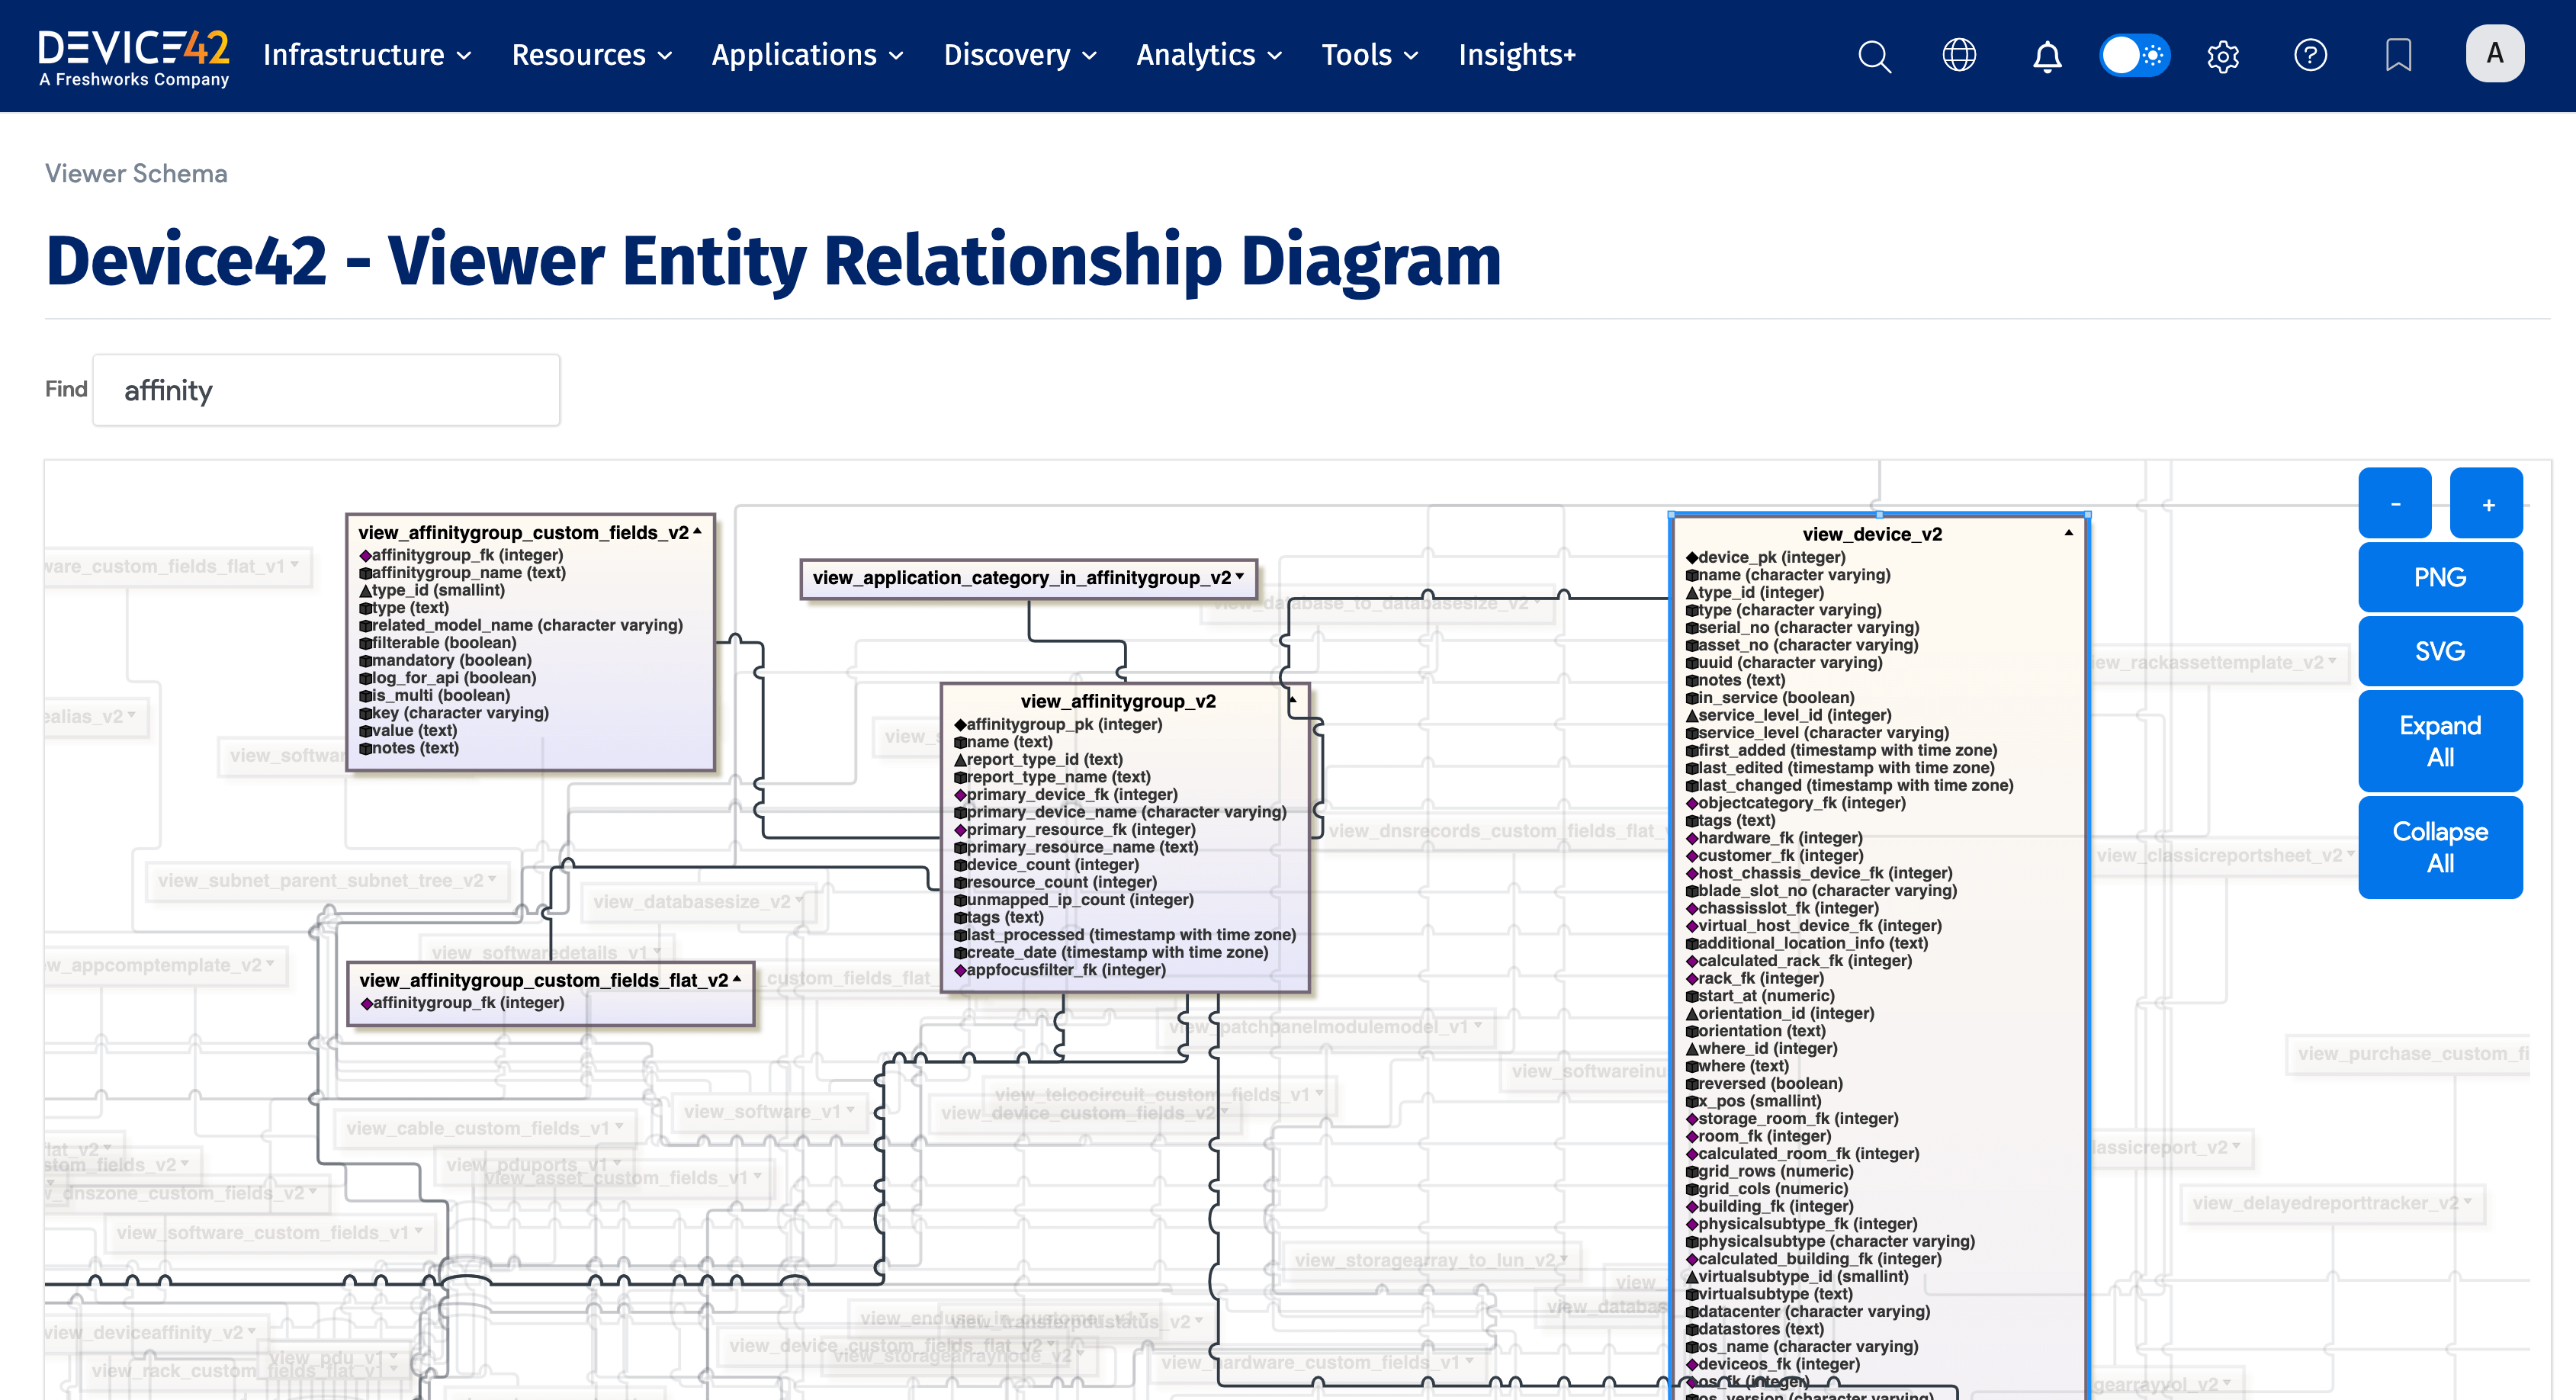
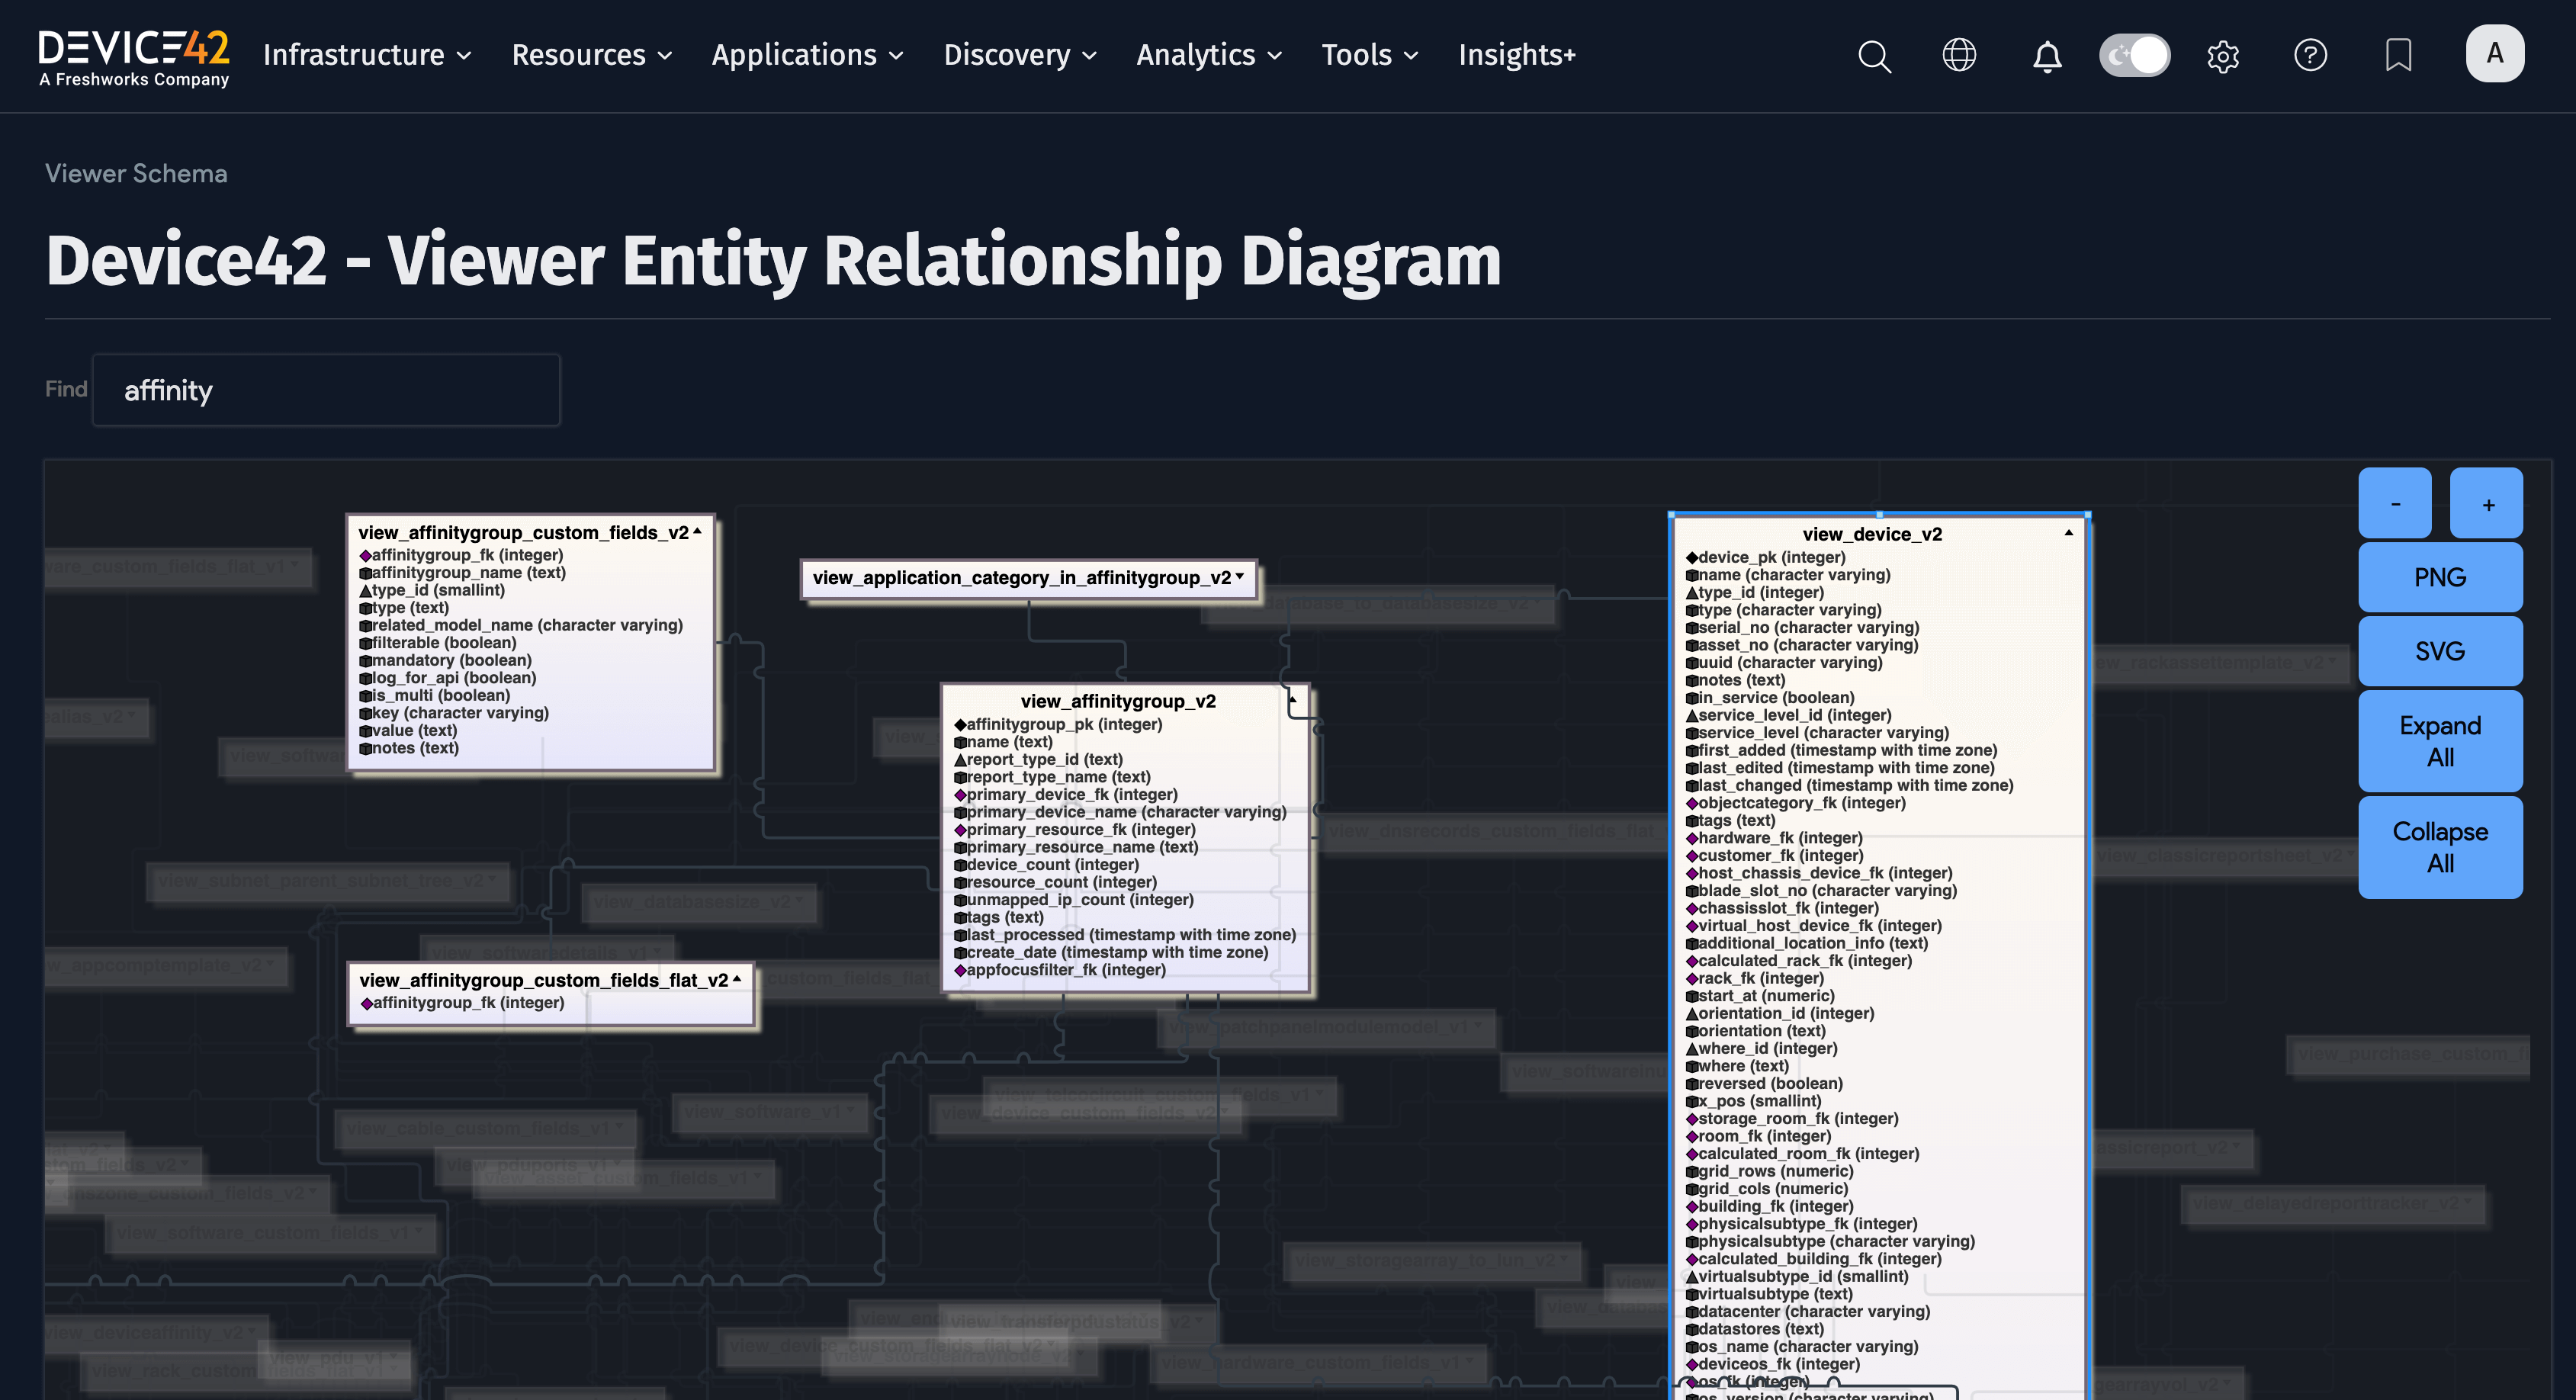
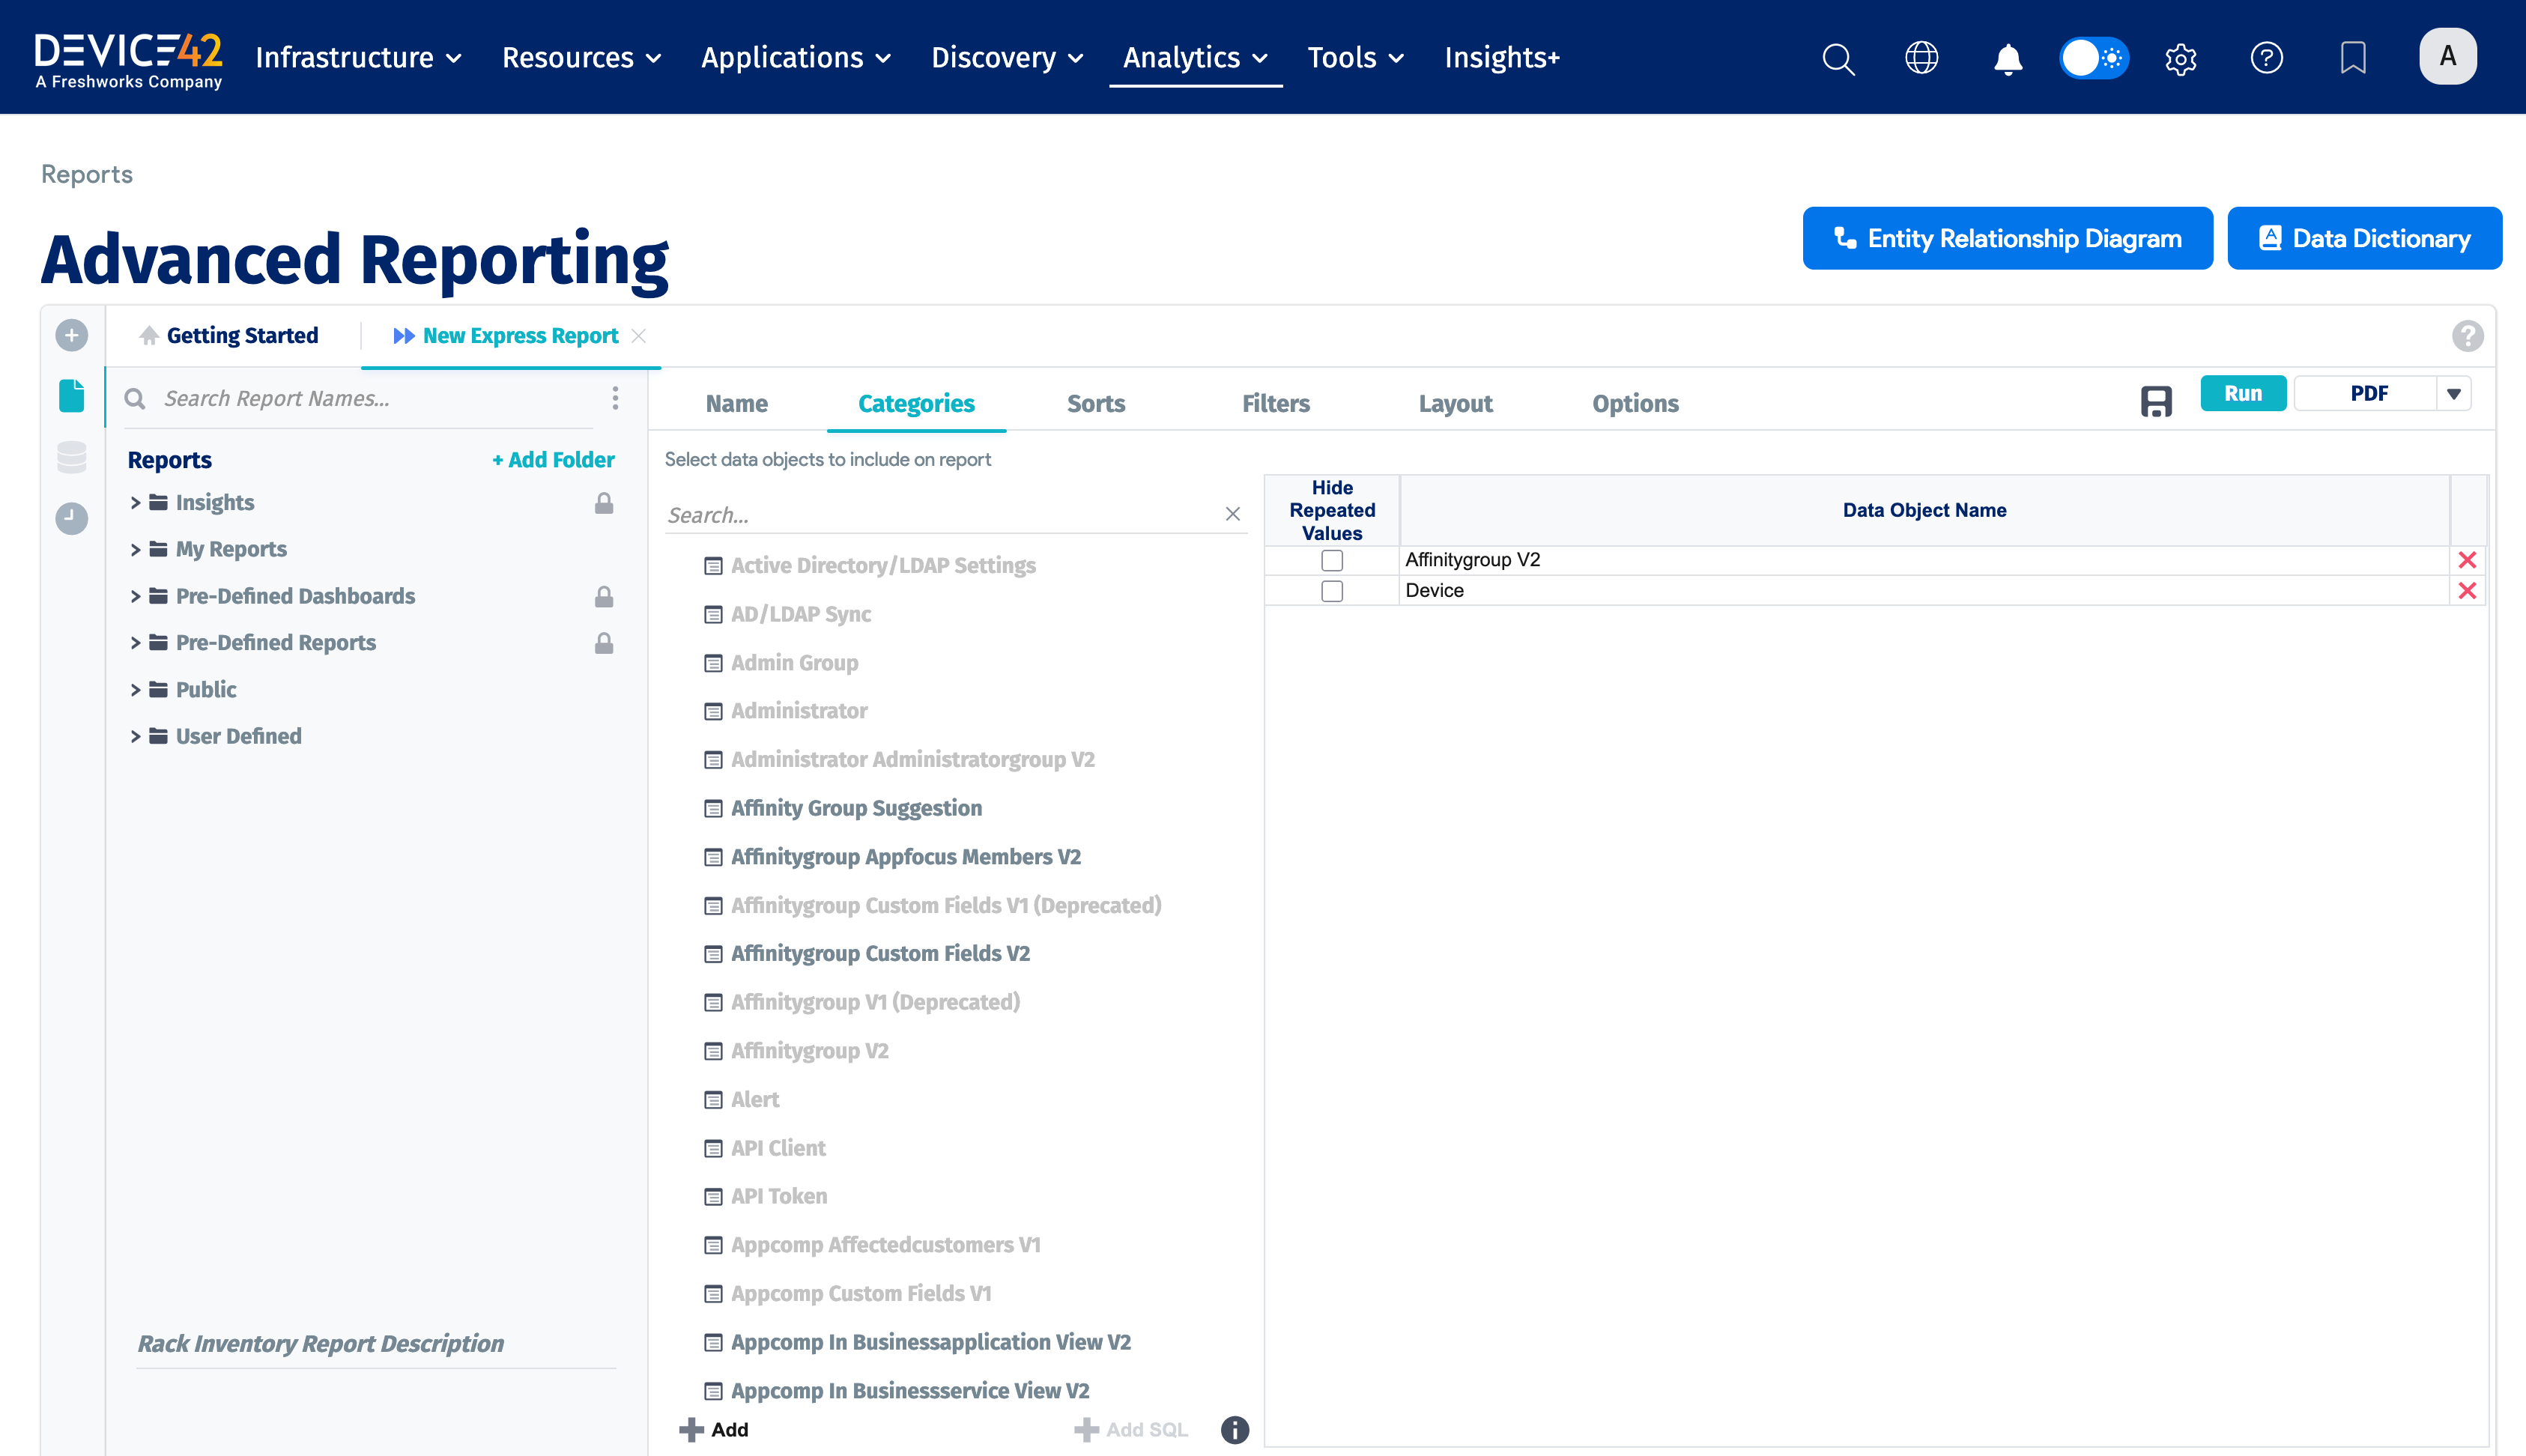
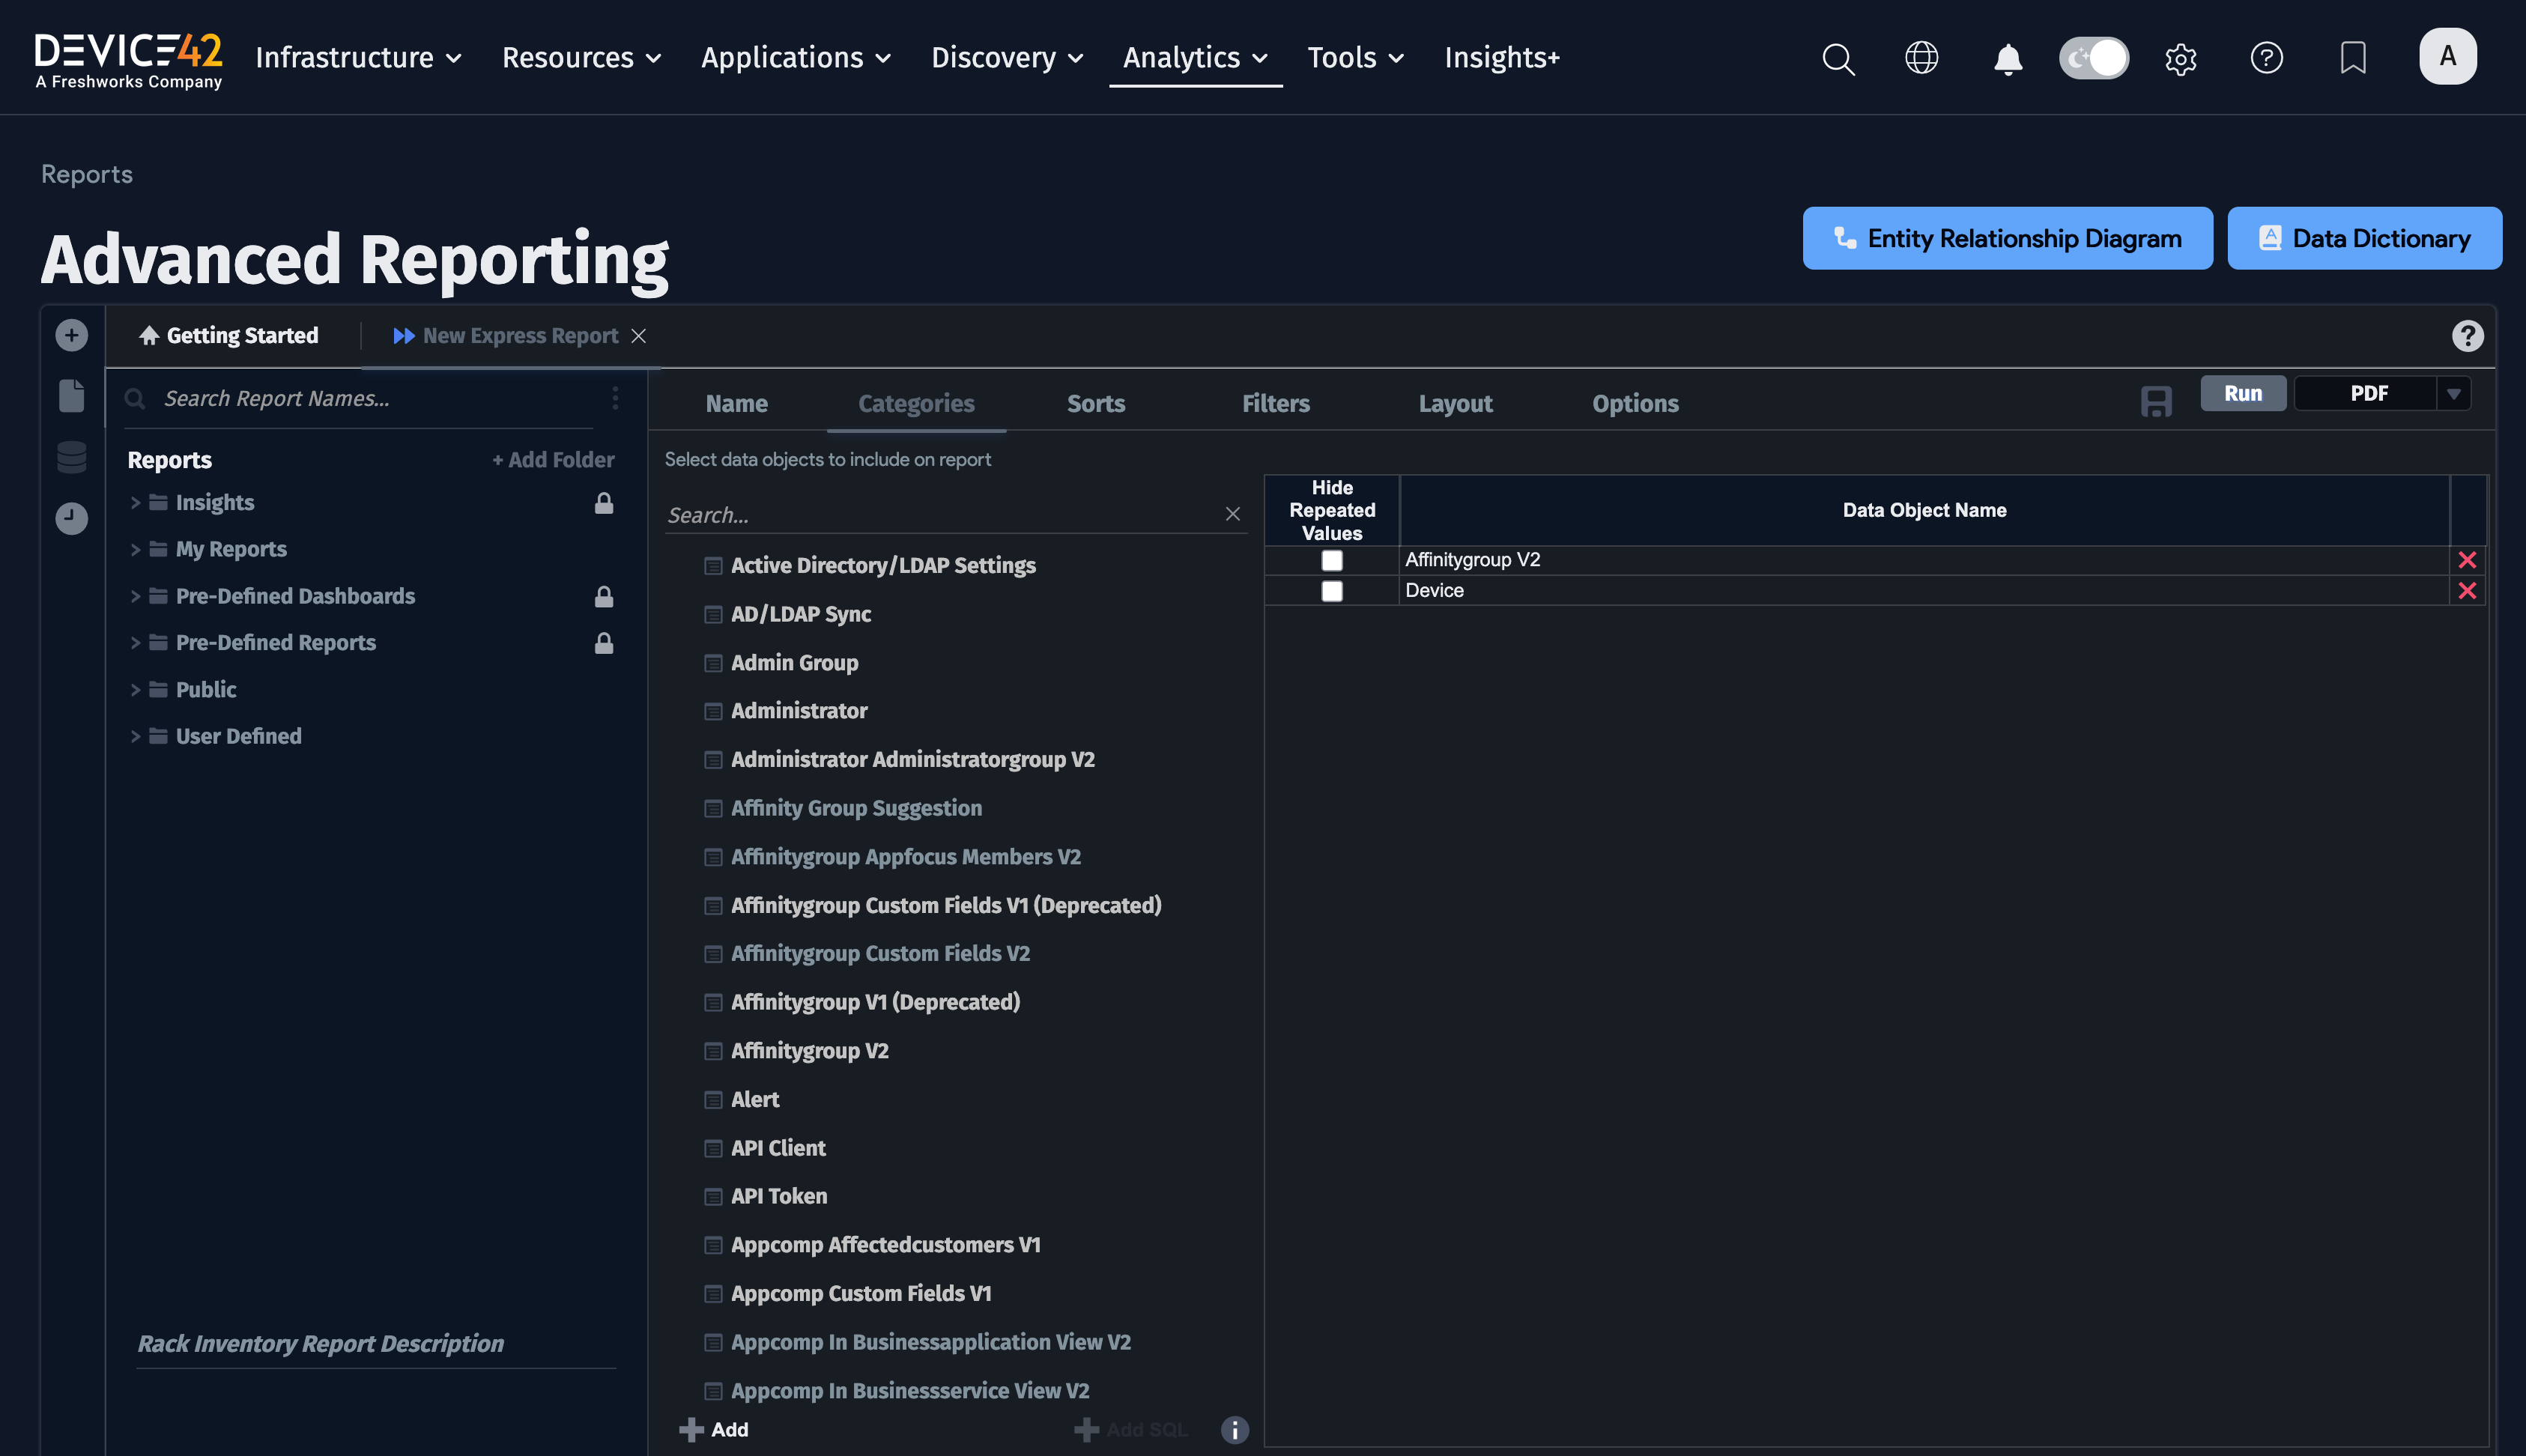
The Viewer Entity Relationship Diagram (ERD)
The Viewer Entity Relationship Diagram, or ERD for short, is a handy and powerful way to navigate the Device42 database schema. It's useful for visualizing relationships and writing DOQL queries. You can quickly navigate to the ERD from the Advanced Reporting page:
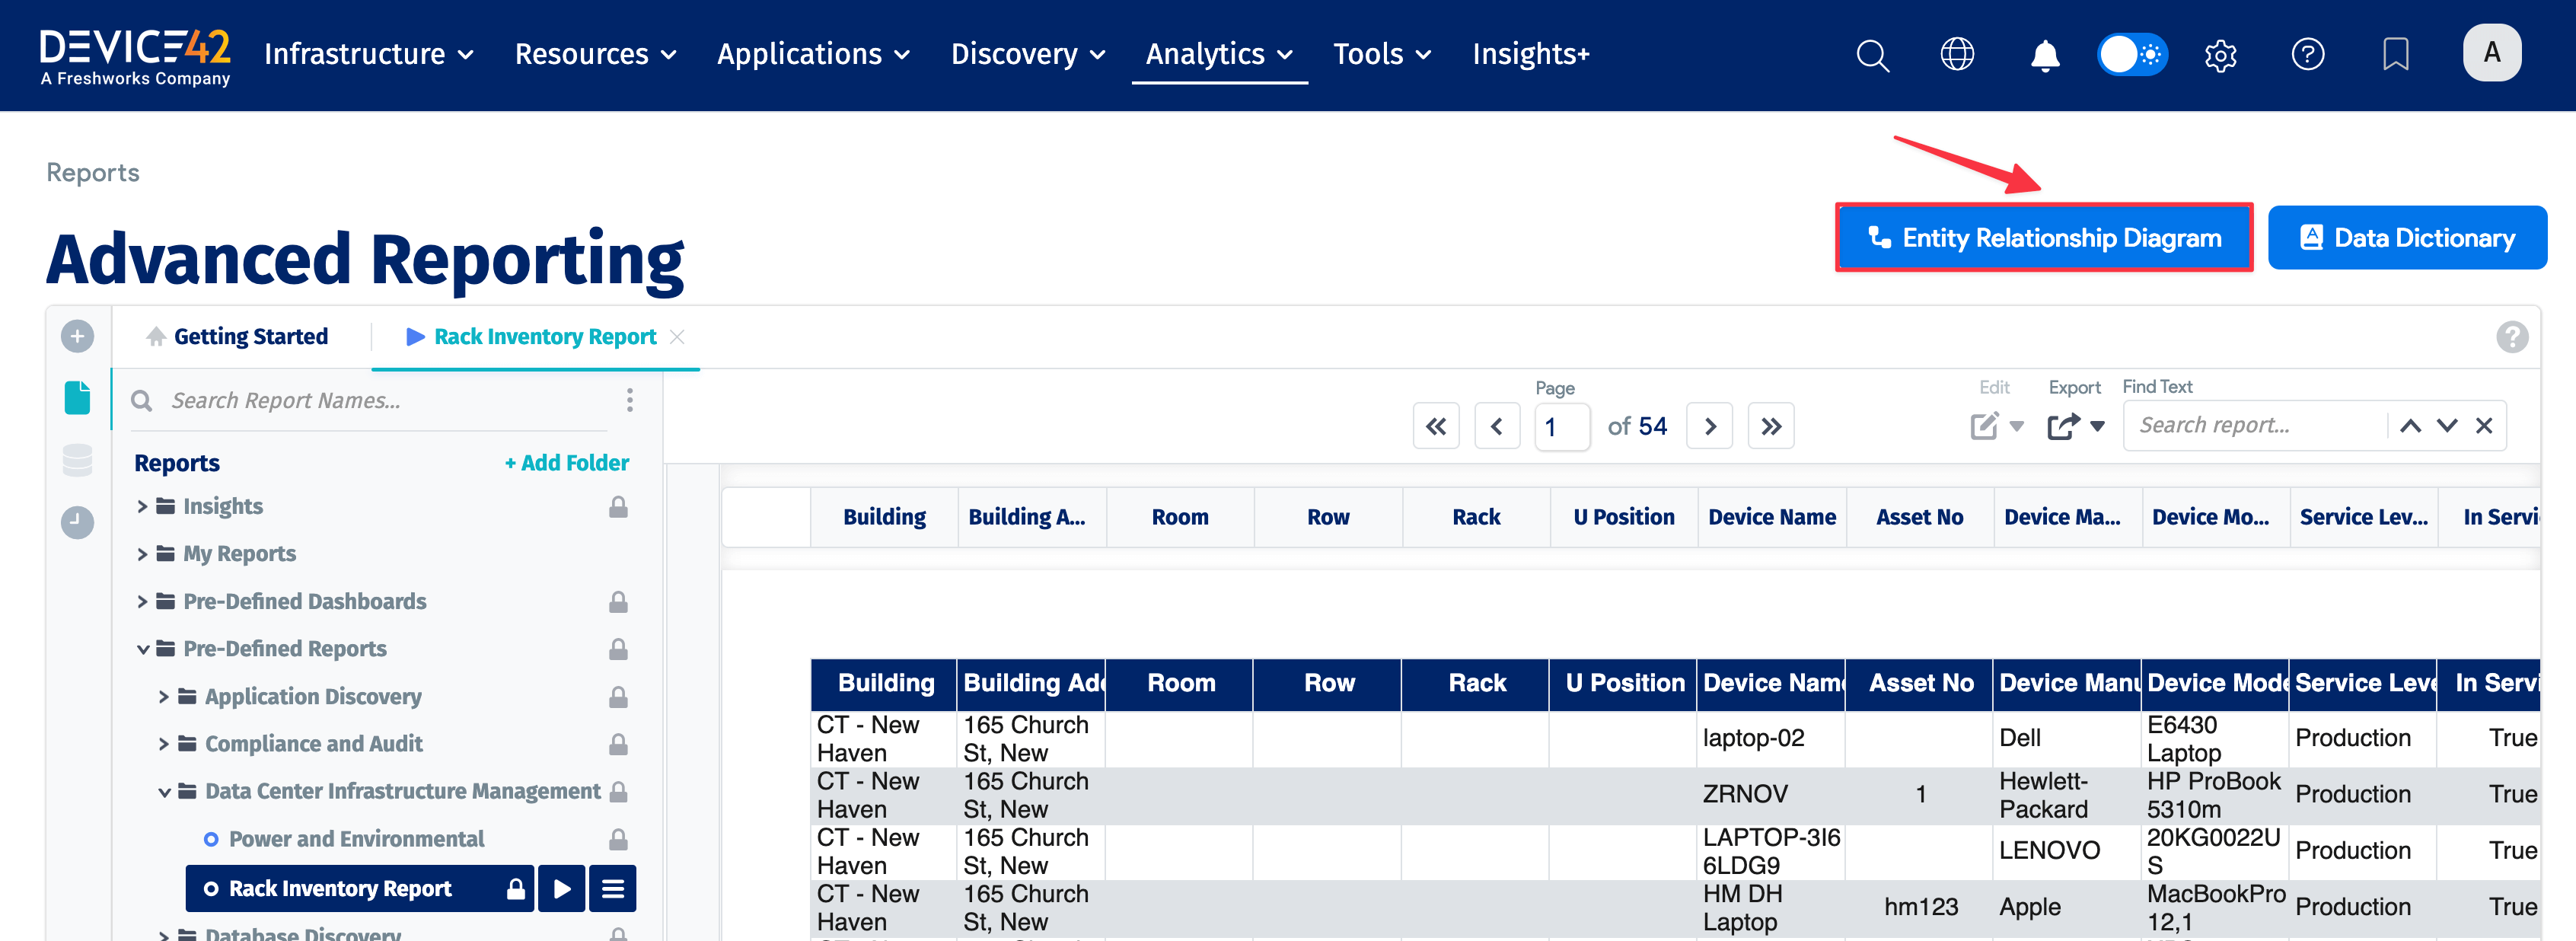
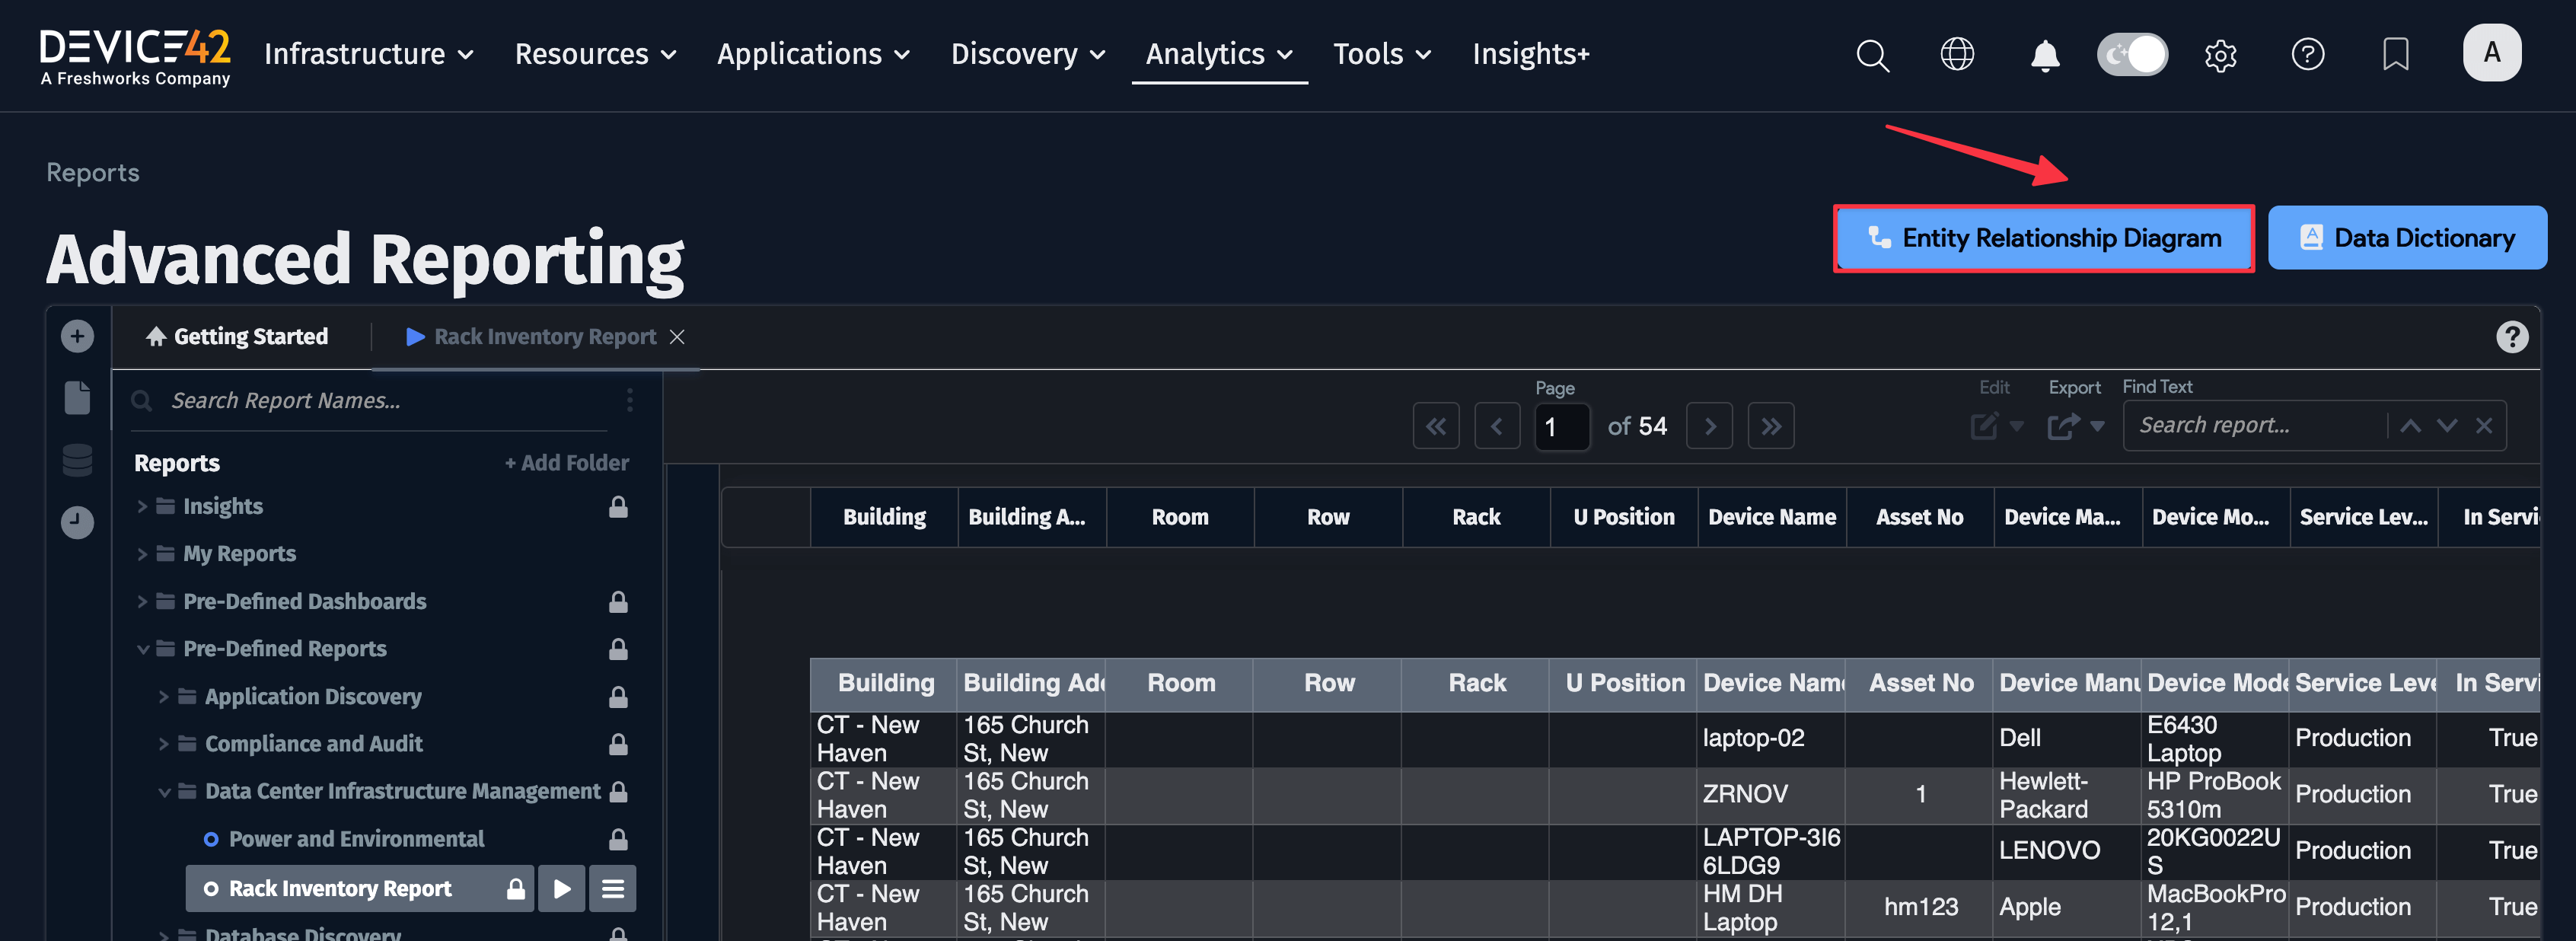
Clicking the Entity Relationship Diagram button brings up the ERD. Here is an example screenshot of the ERD. For more information, check out the dedicated Device42 ERD/Viewer Schema page.
In this example, the Find field contains the search keyword affinity, and therefore much of the ERD has been greyed out, while the items that match the affinity search query are visible: