Impact Charts
Impact charts enable you to see, at a glance, the impacts of an outage scenario, to locate potential performance issues, and to identify relevant security issues around data center objects. Impact charts are available from the view page for any building, room, rack, device, or application component.
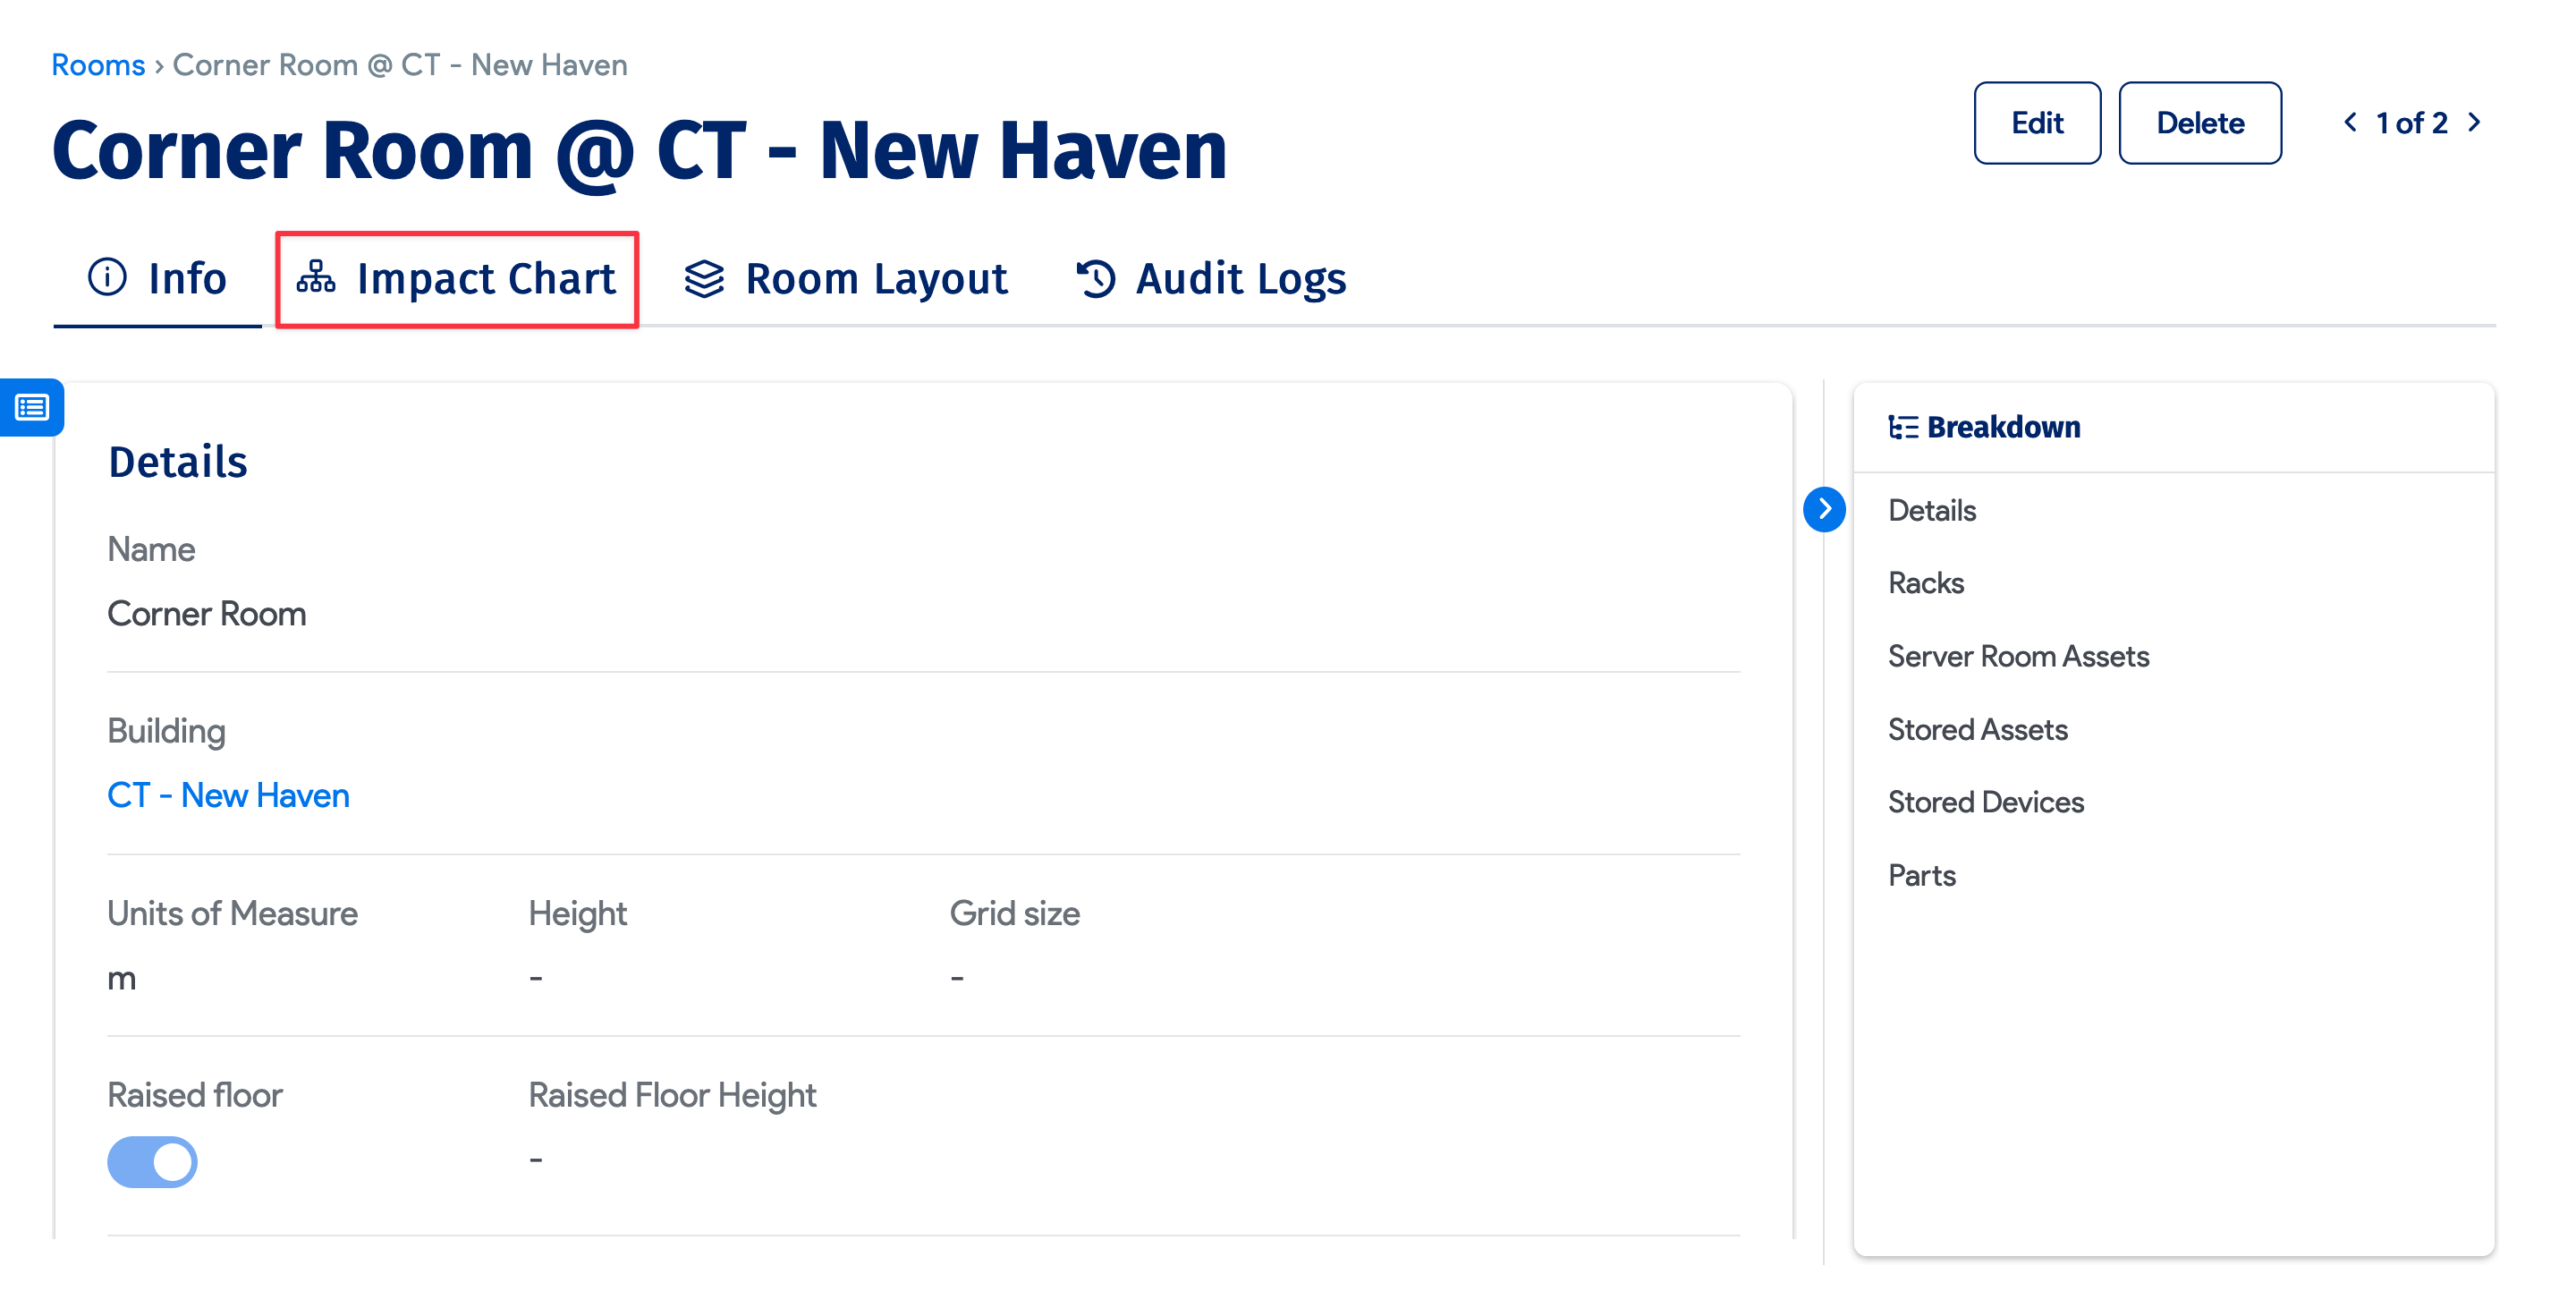
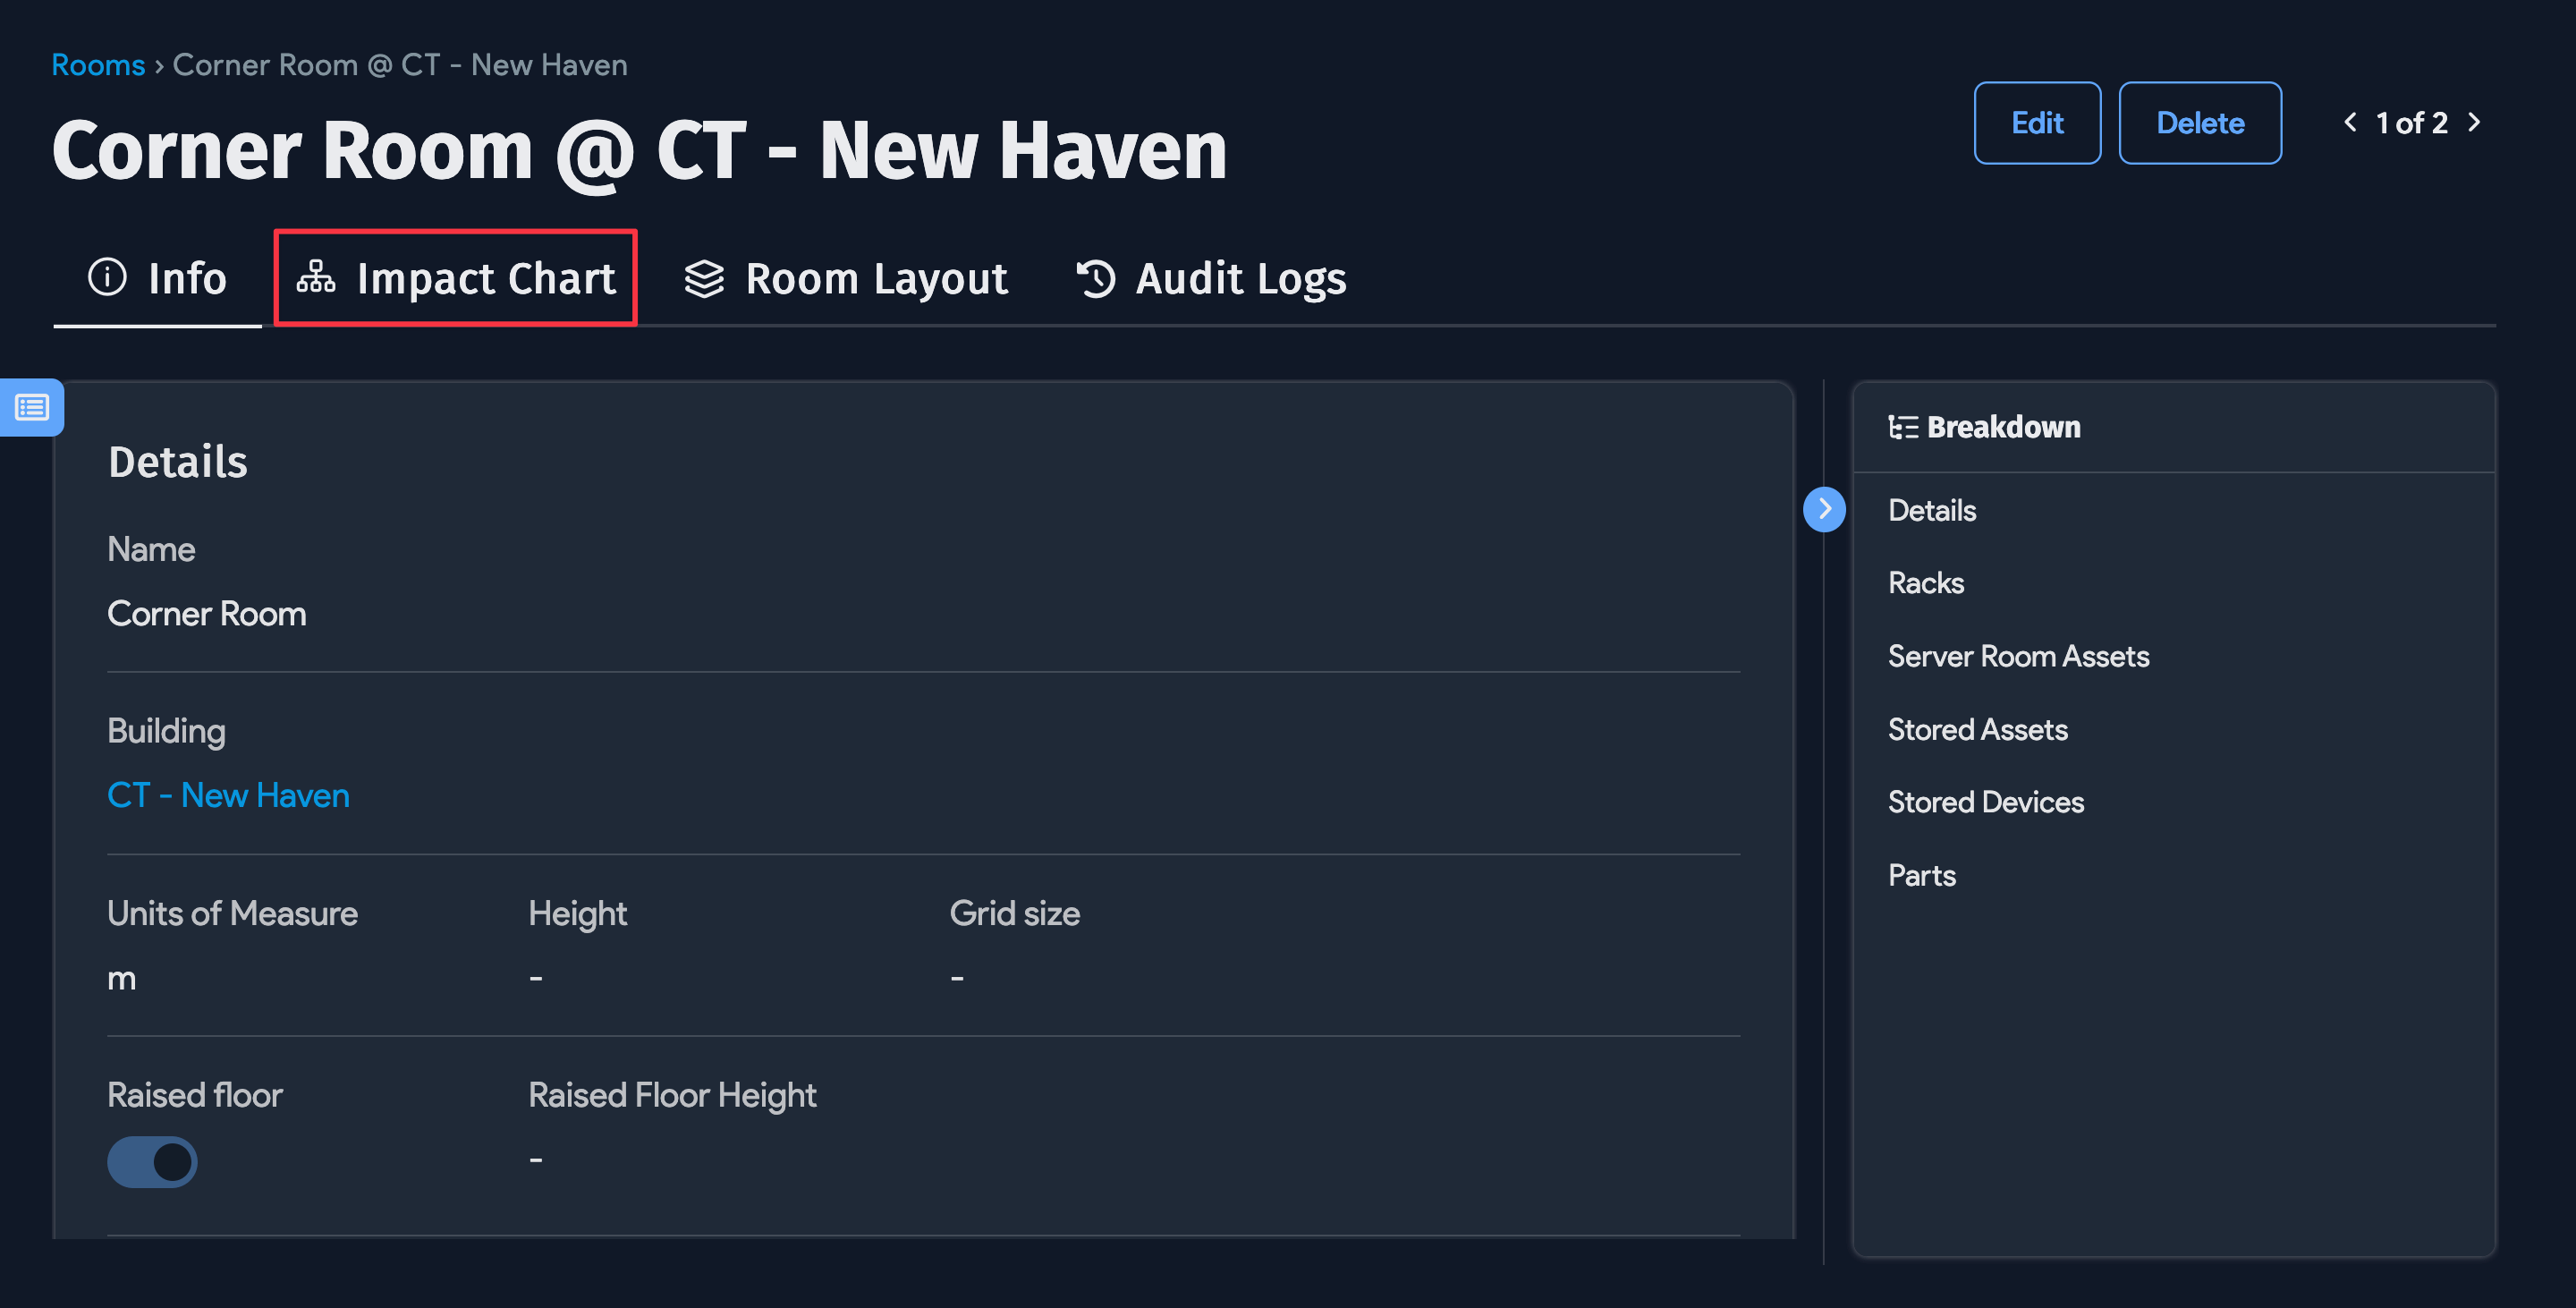
Click the Impact Chart button at the top of the screen:
Device42's powerful, agentless autodiscovery uses native WMI and SSH in combination with other platform-dependent technologies to identify the details of running services and listening ports, and the relationships between those services and ports or executables and ports. This provides a clear picture of exactly which services or executables are listening on which ports on a machine. Device42 also goes on to capture a point-in-time snapshot of the IP addresses that are connected to each listening port. Should these communicating IP addresses already exist in Device42 and be mapped to a device, the system automatically shows that device when drawing the dynamic impact charts.
Impact Charts for Buildings, Rooms, and Racks
Impact charts are a great means of quickly visualizing deployments and understanding dependency chains. The following is a sample building impact chart:
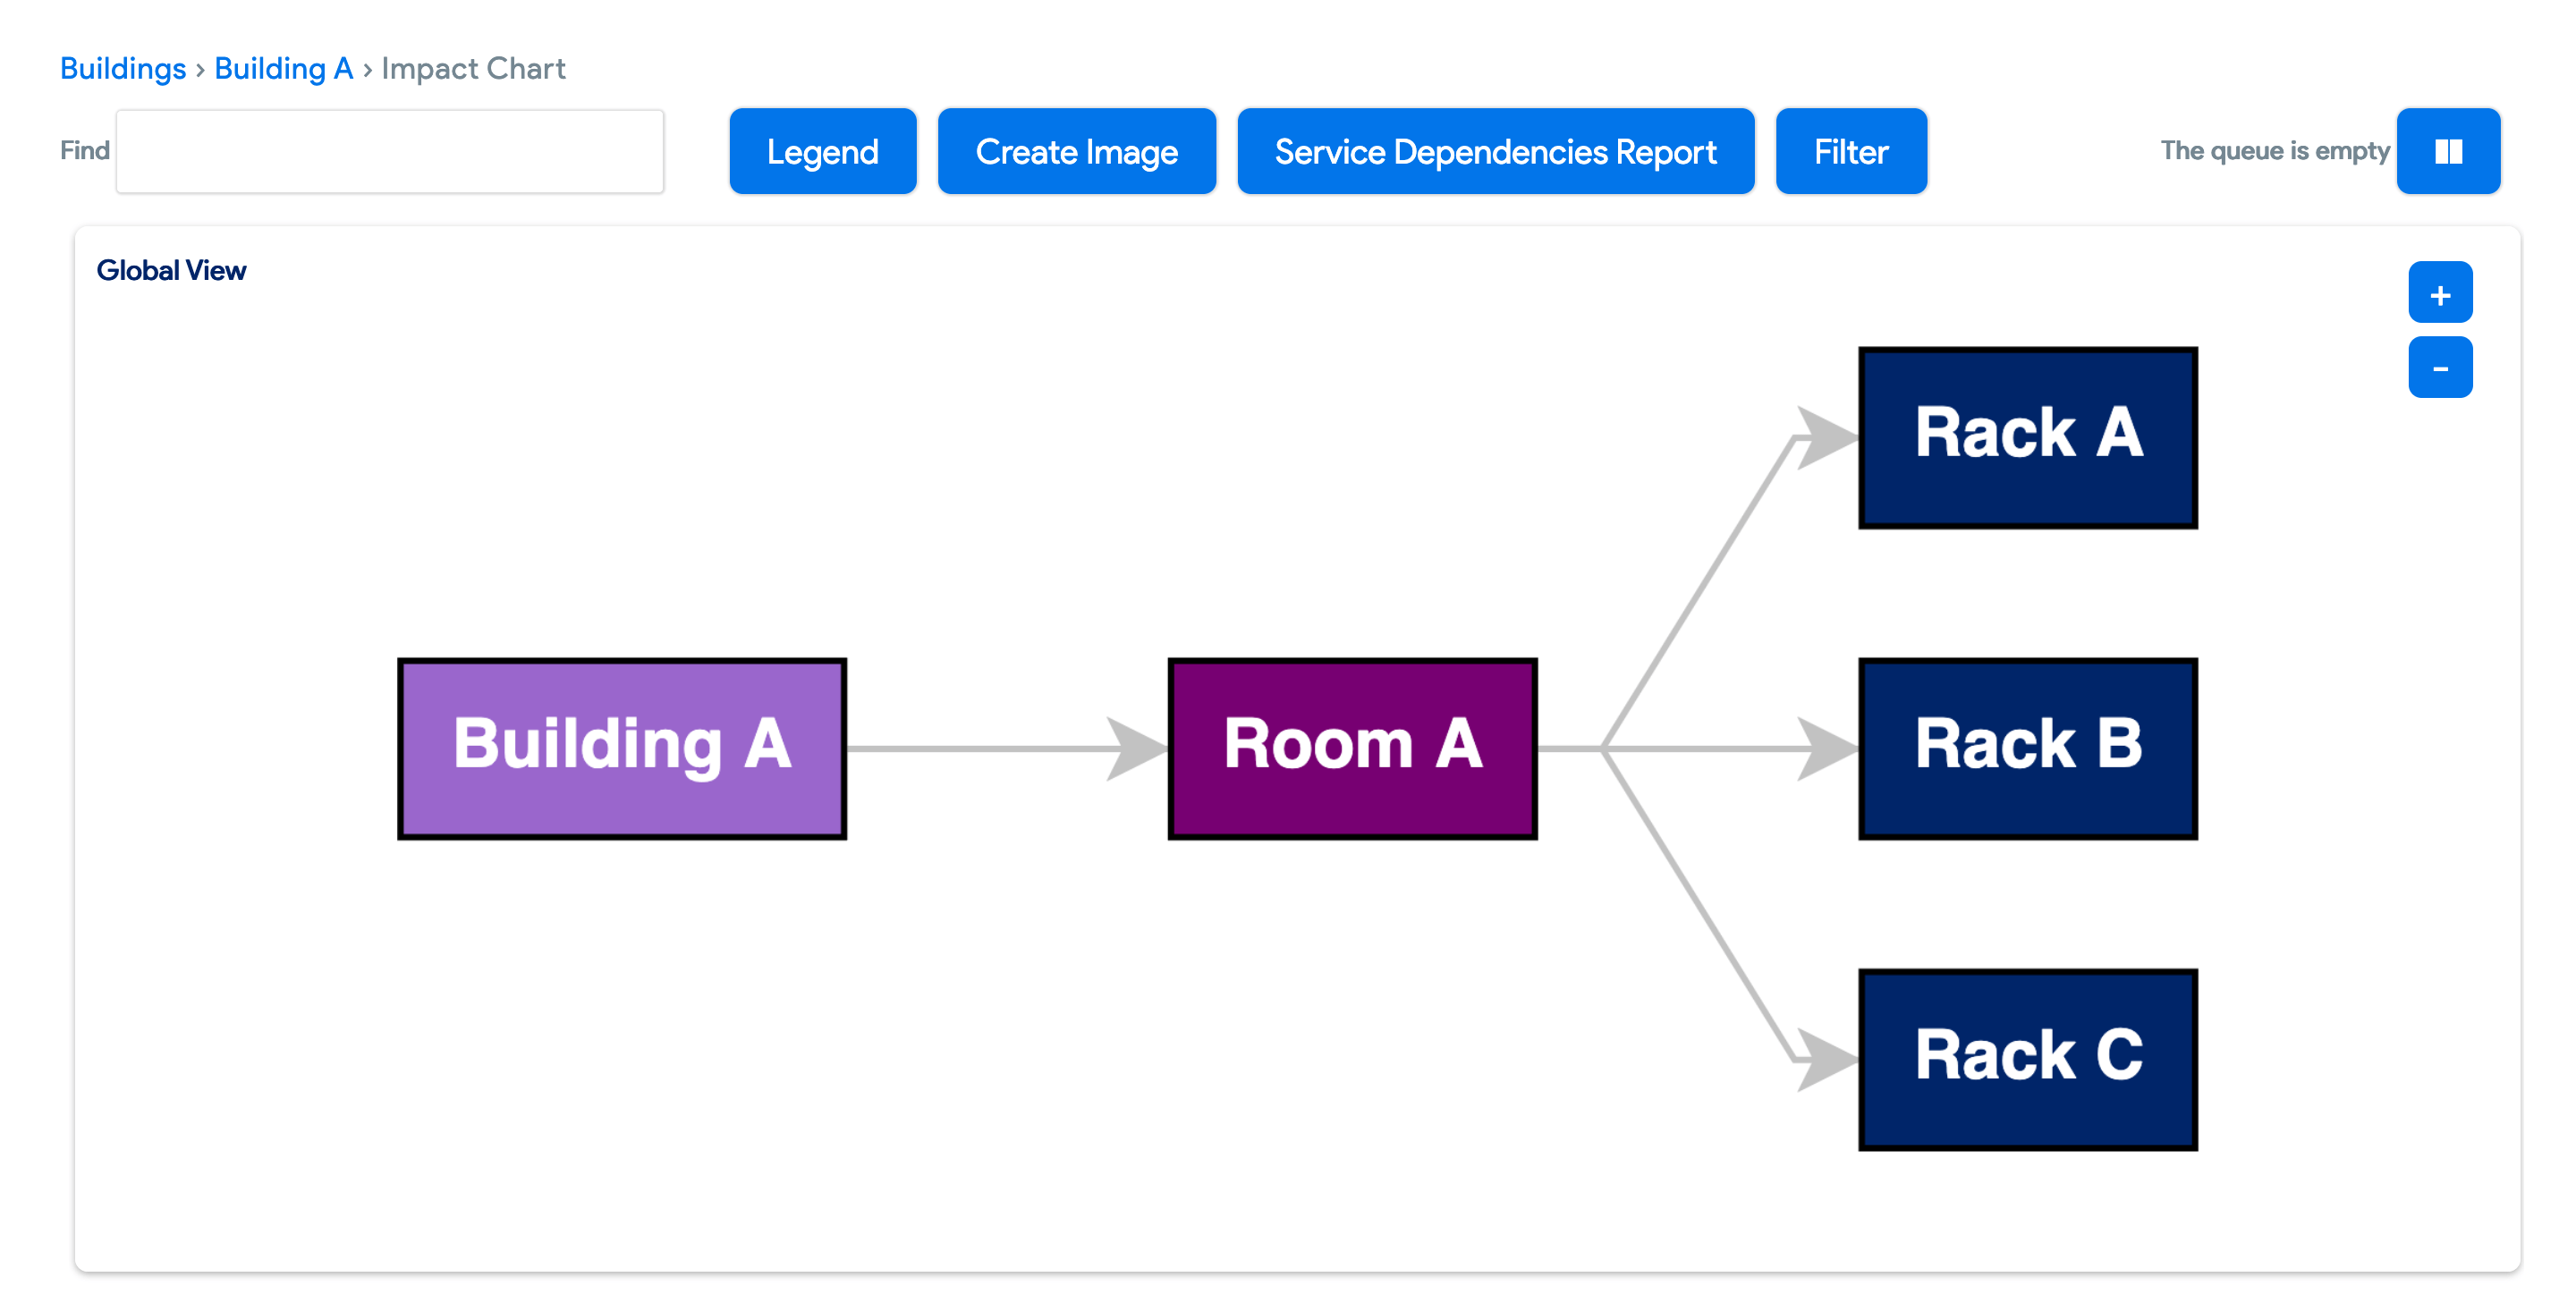
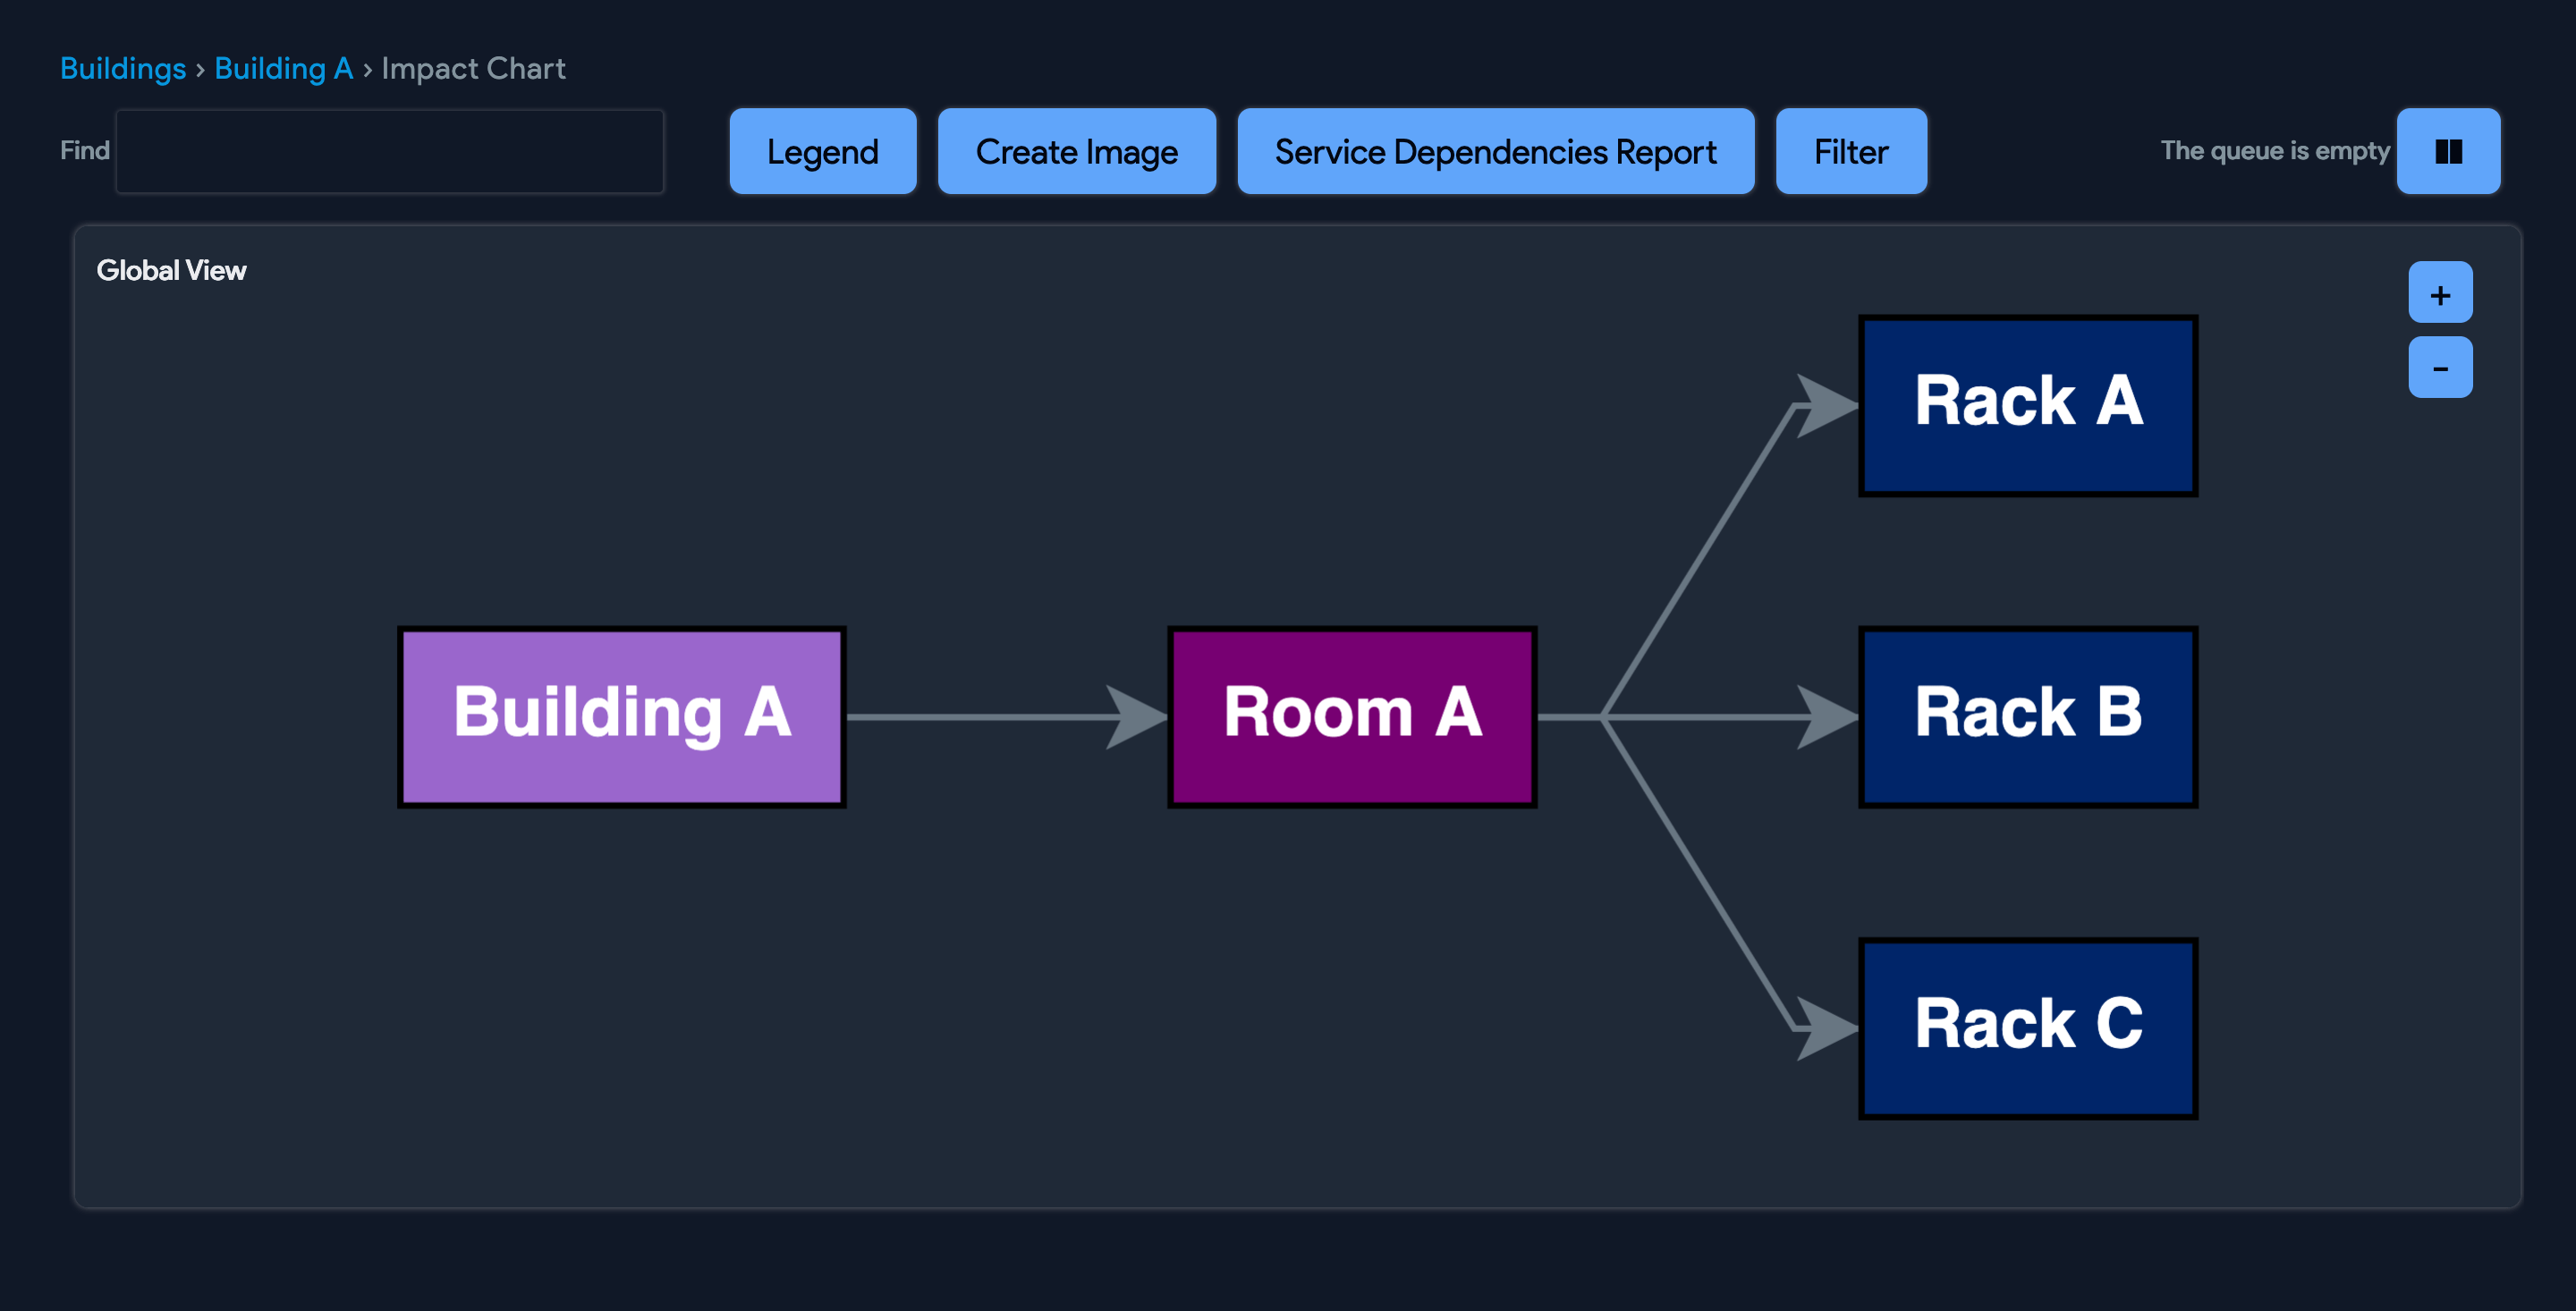
Notice that the building or room you selected is at the top of the chart. The building impact chart shows the rooms within the building and the racks within each room.
The following is a sample room impact chart:
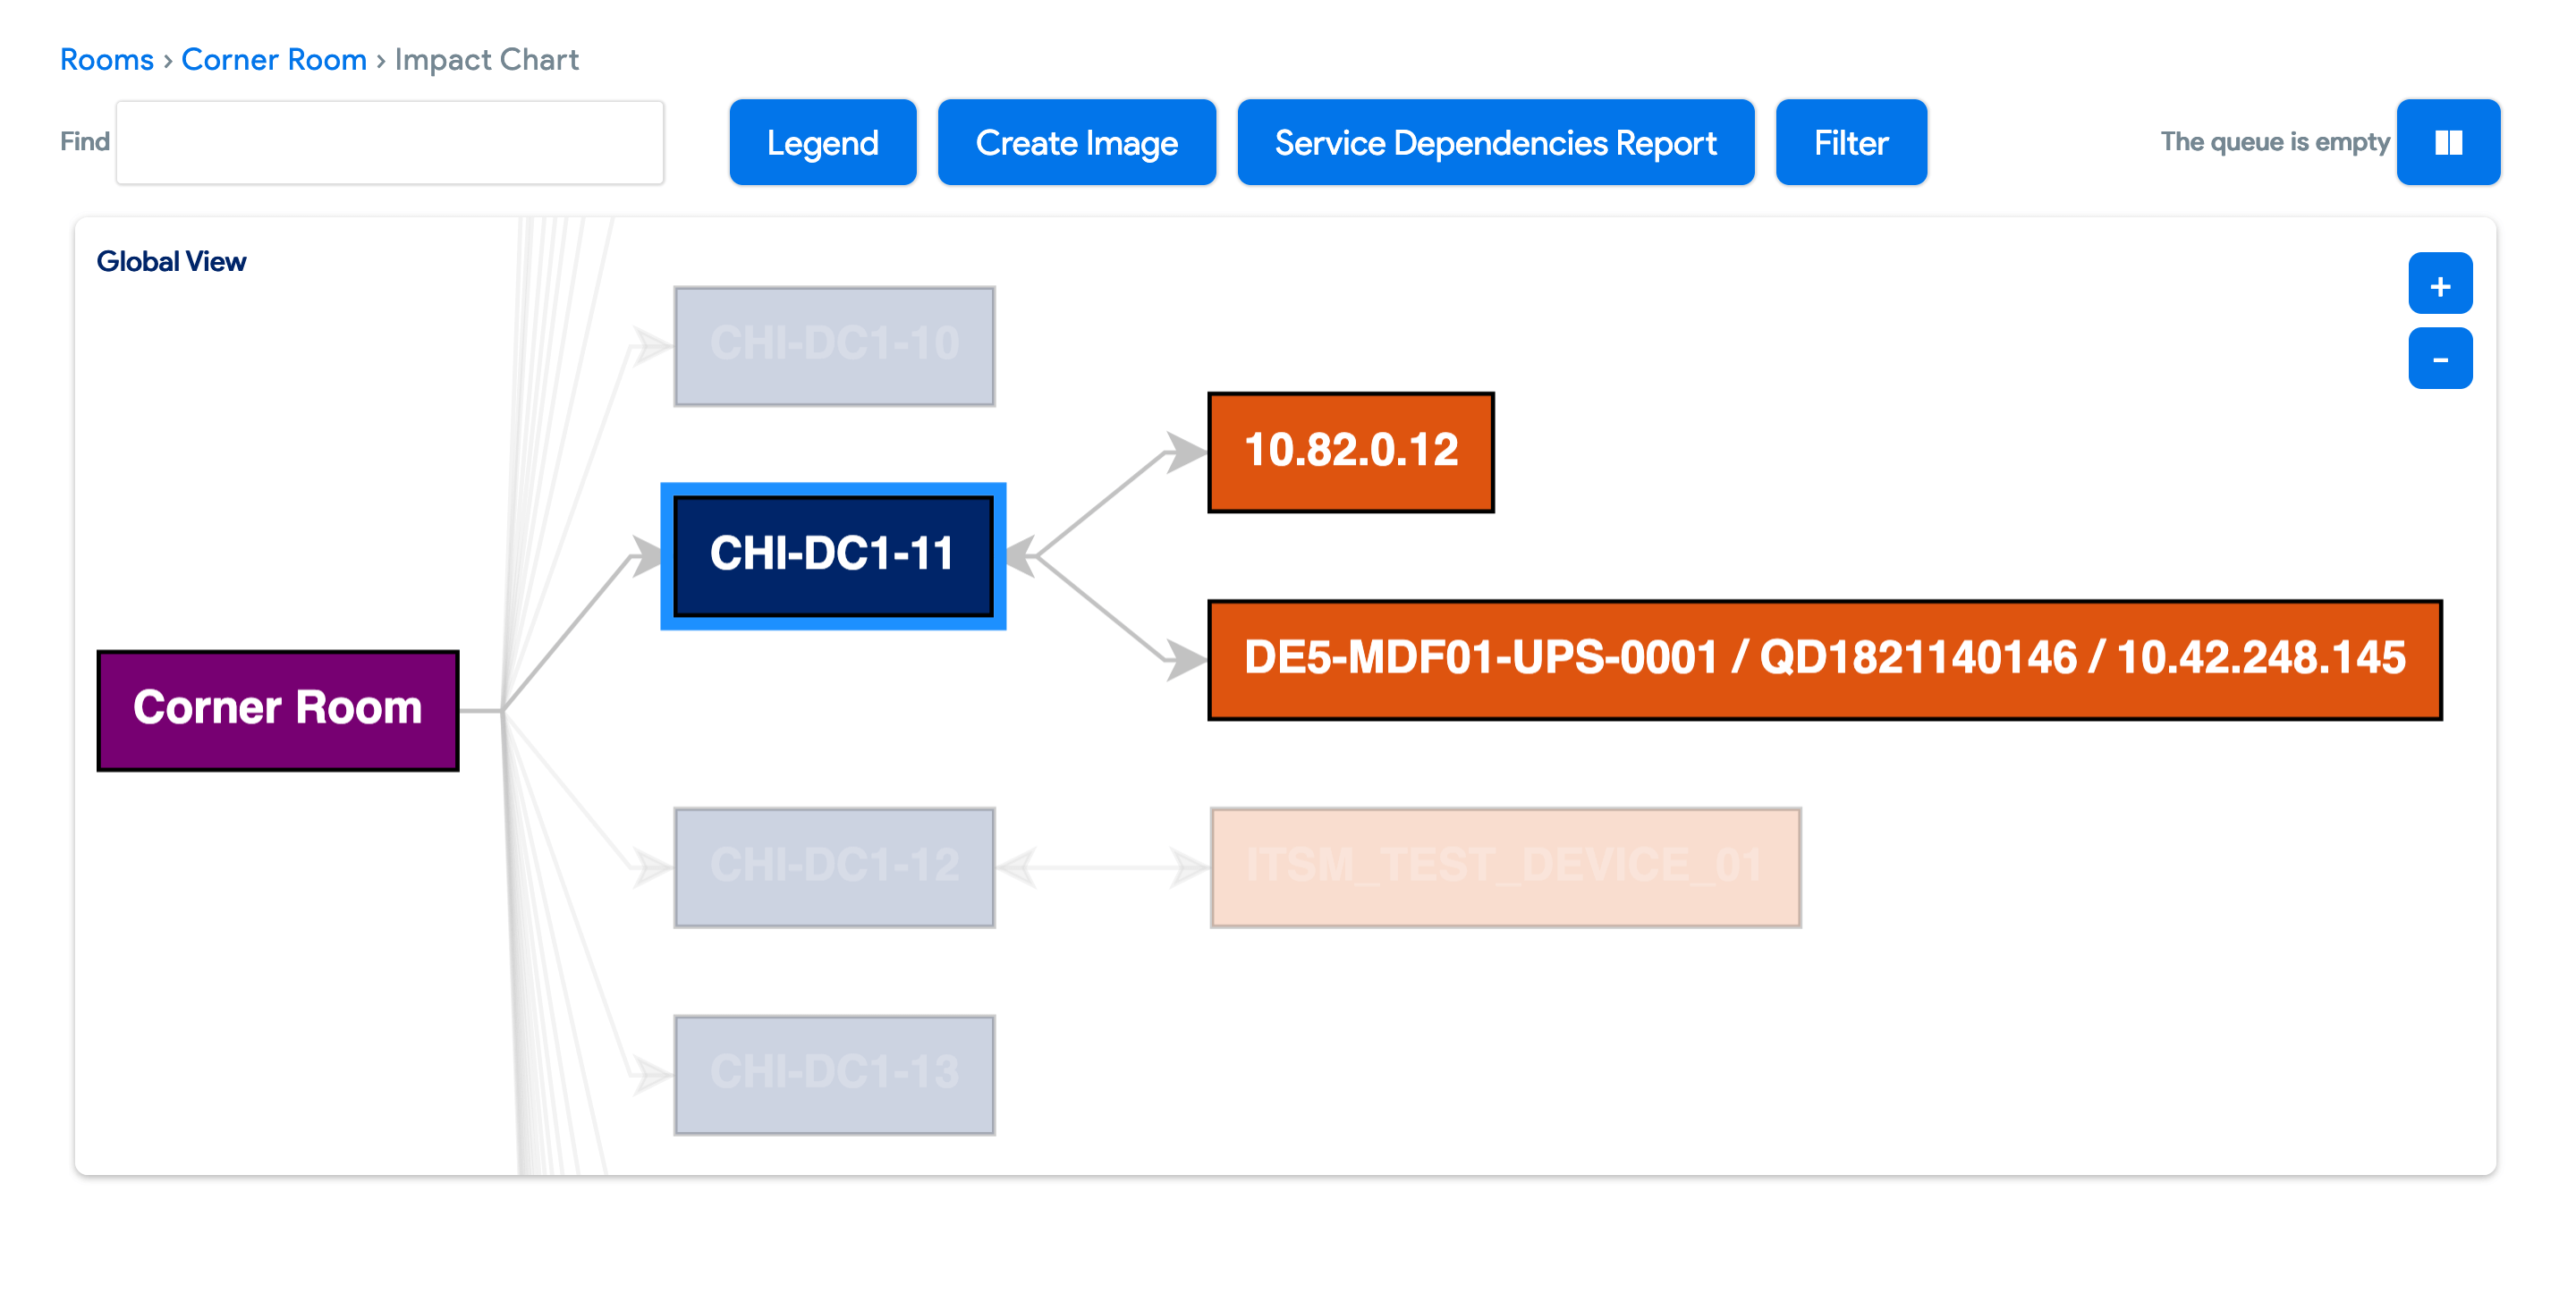
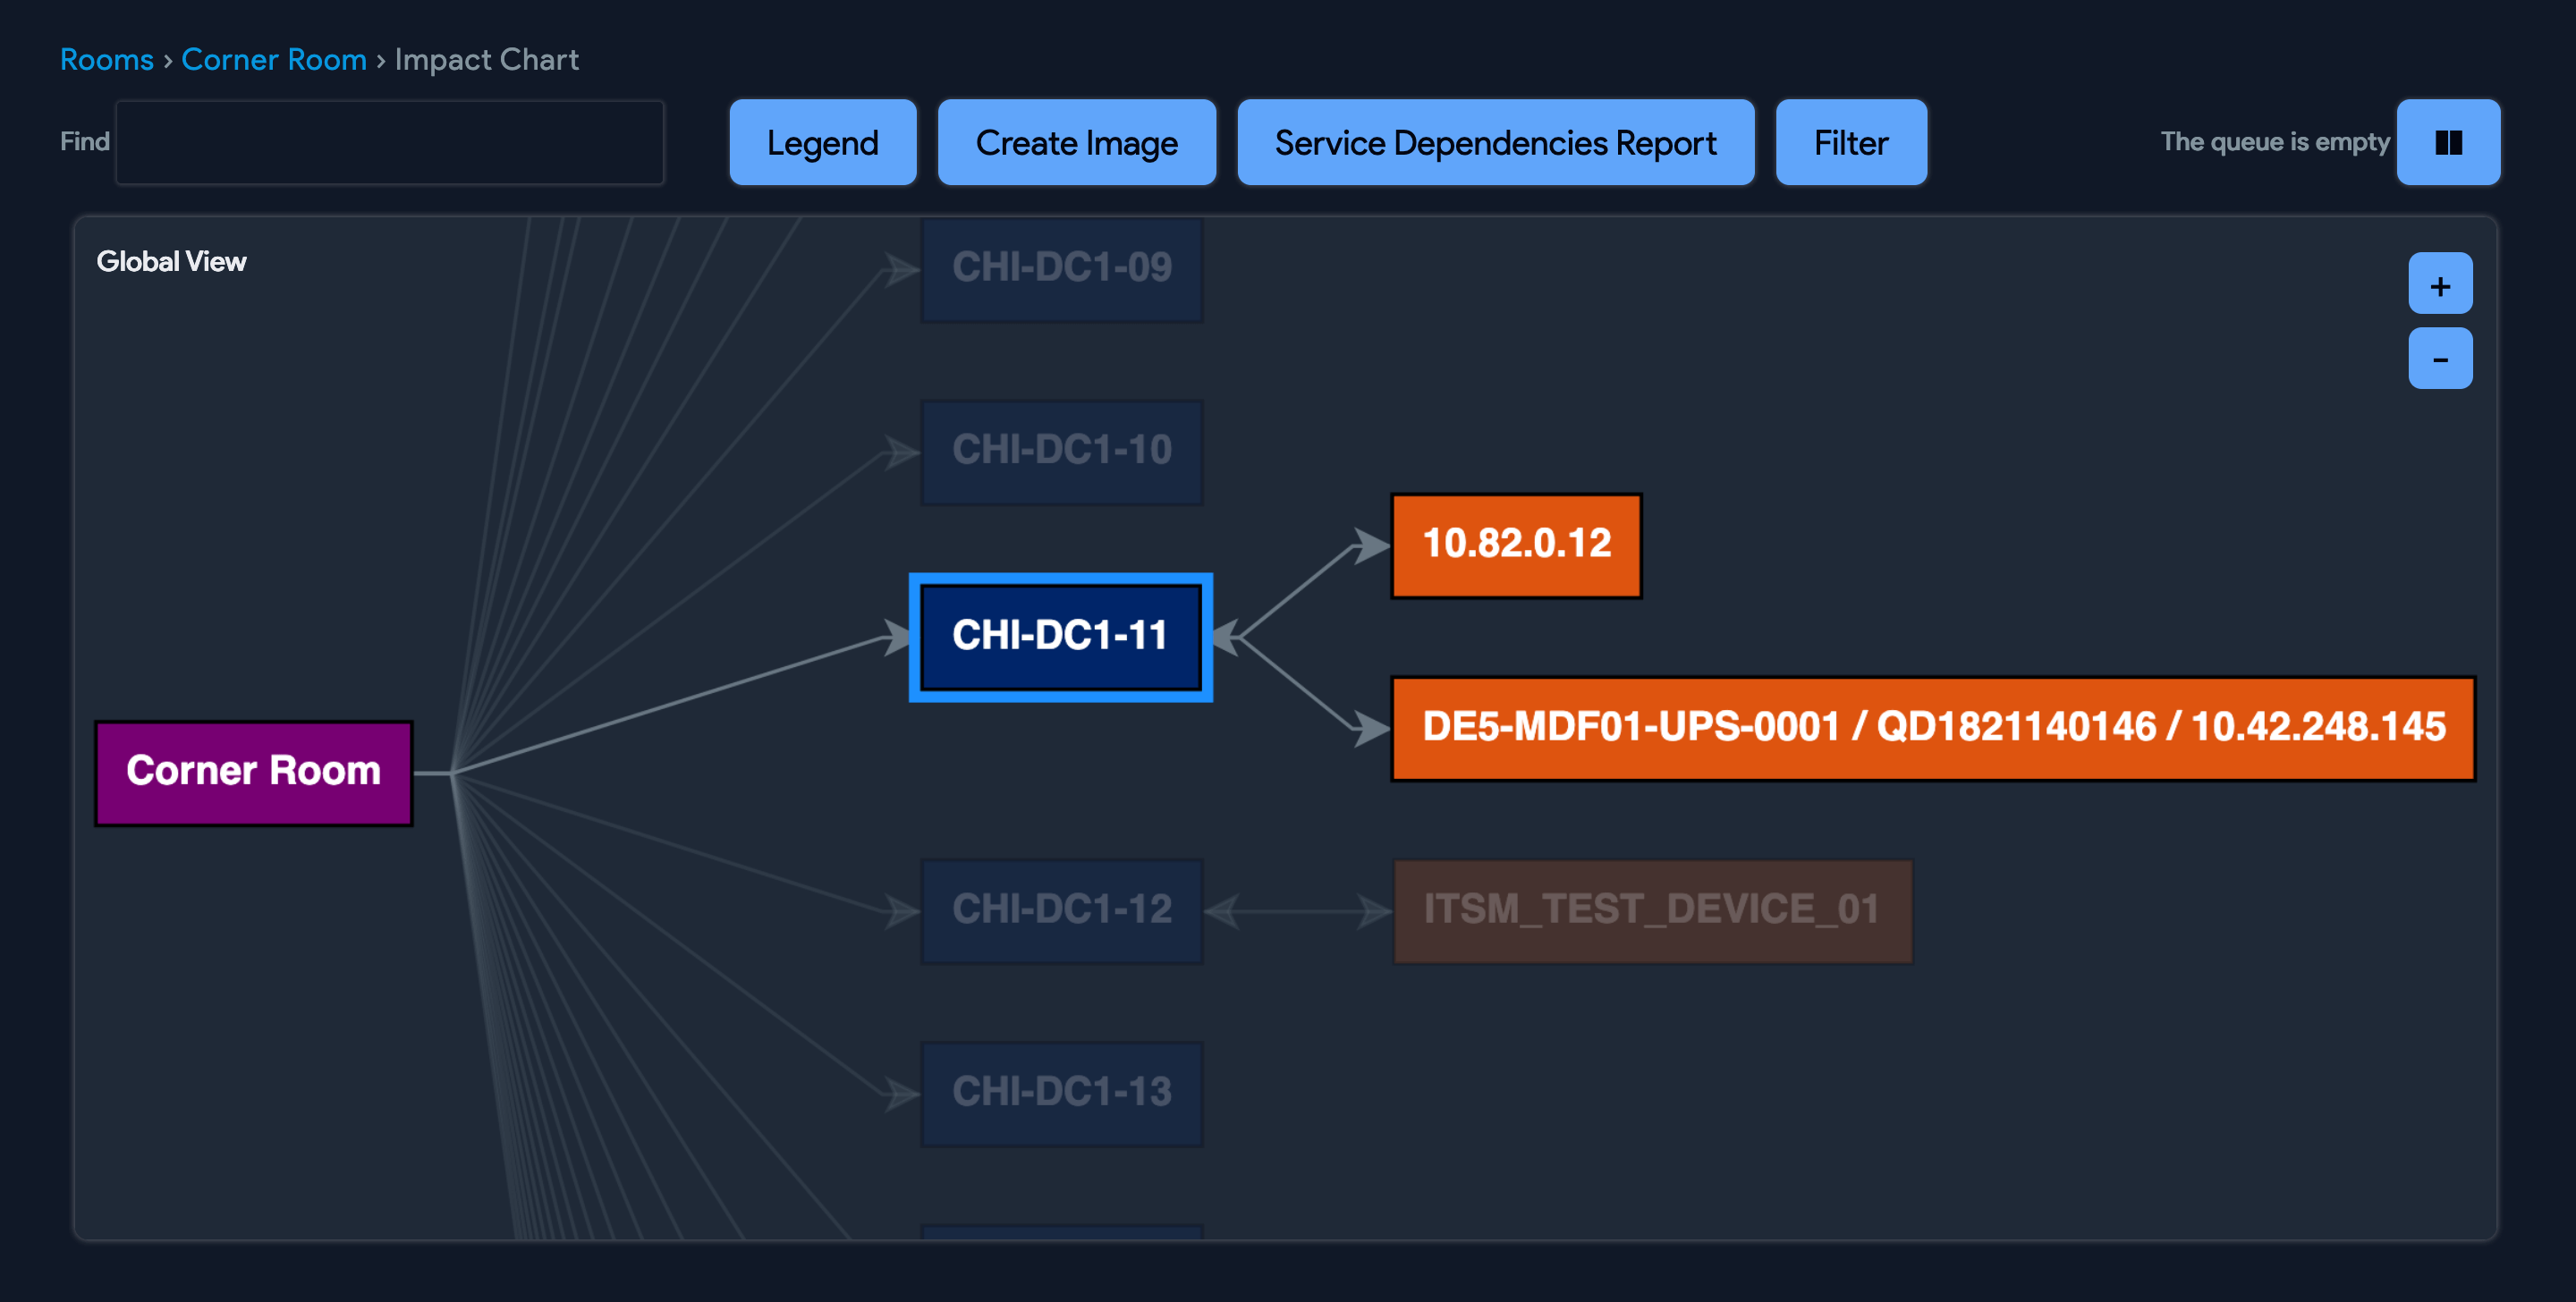
Looking at the impact chart for a room, from left to right, you see the room itself, the list of racks (with one rack selected), and all the servers that are located in the selected rack. You can view a legend via the Legend button above.
Now, let's gather more information about one of the servers. You can do this easily by hovering over it (or any item in the chart) as such:
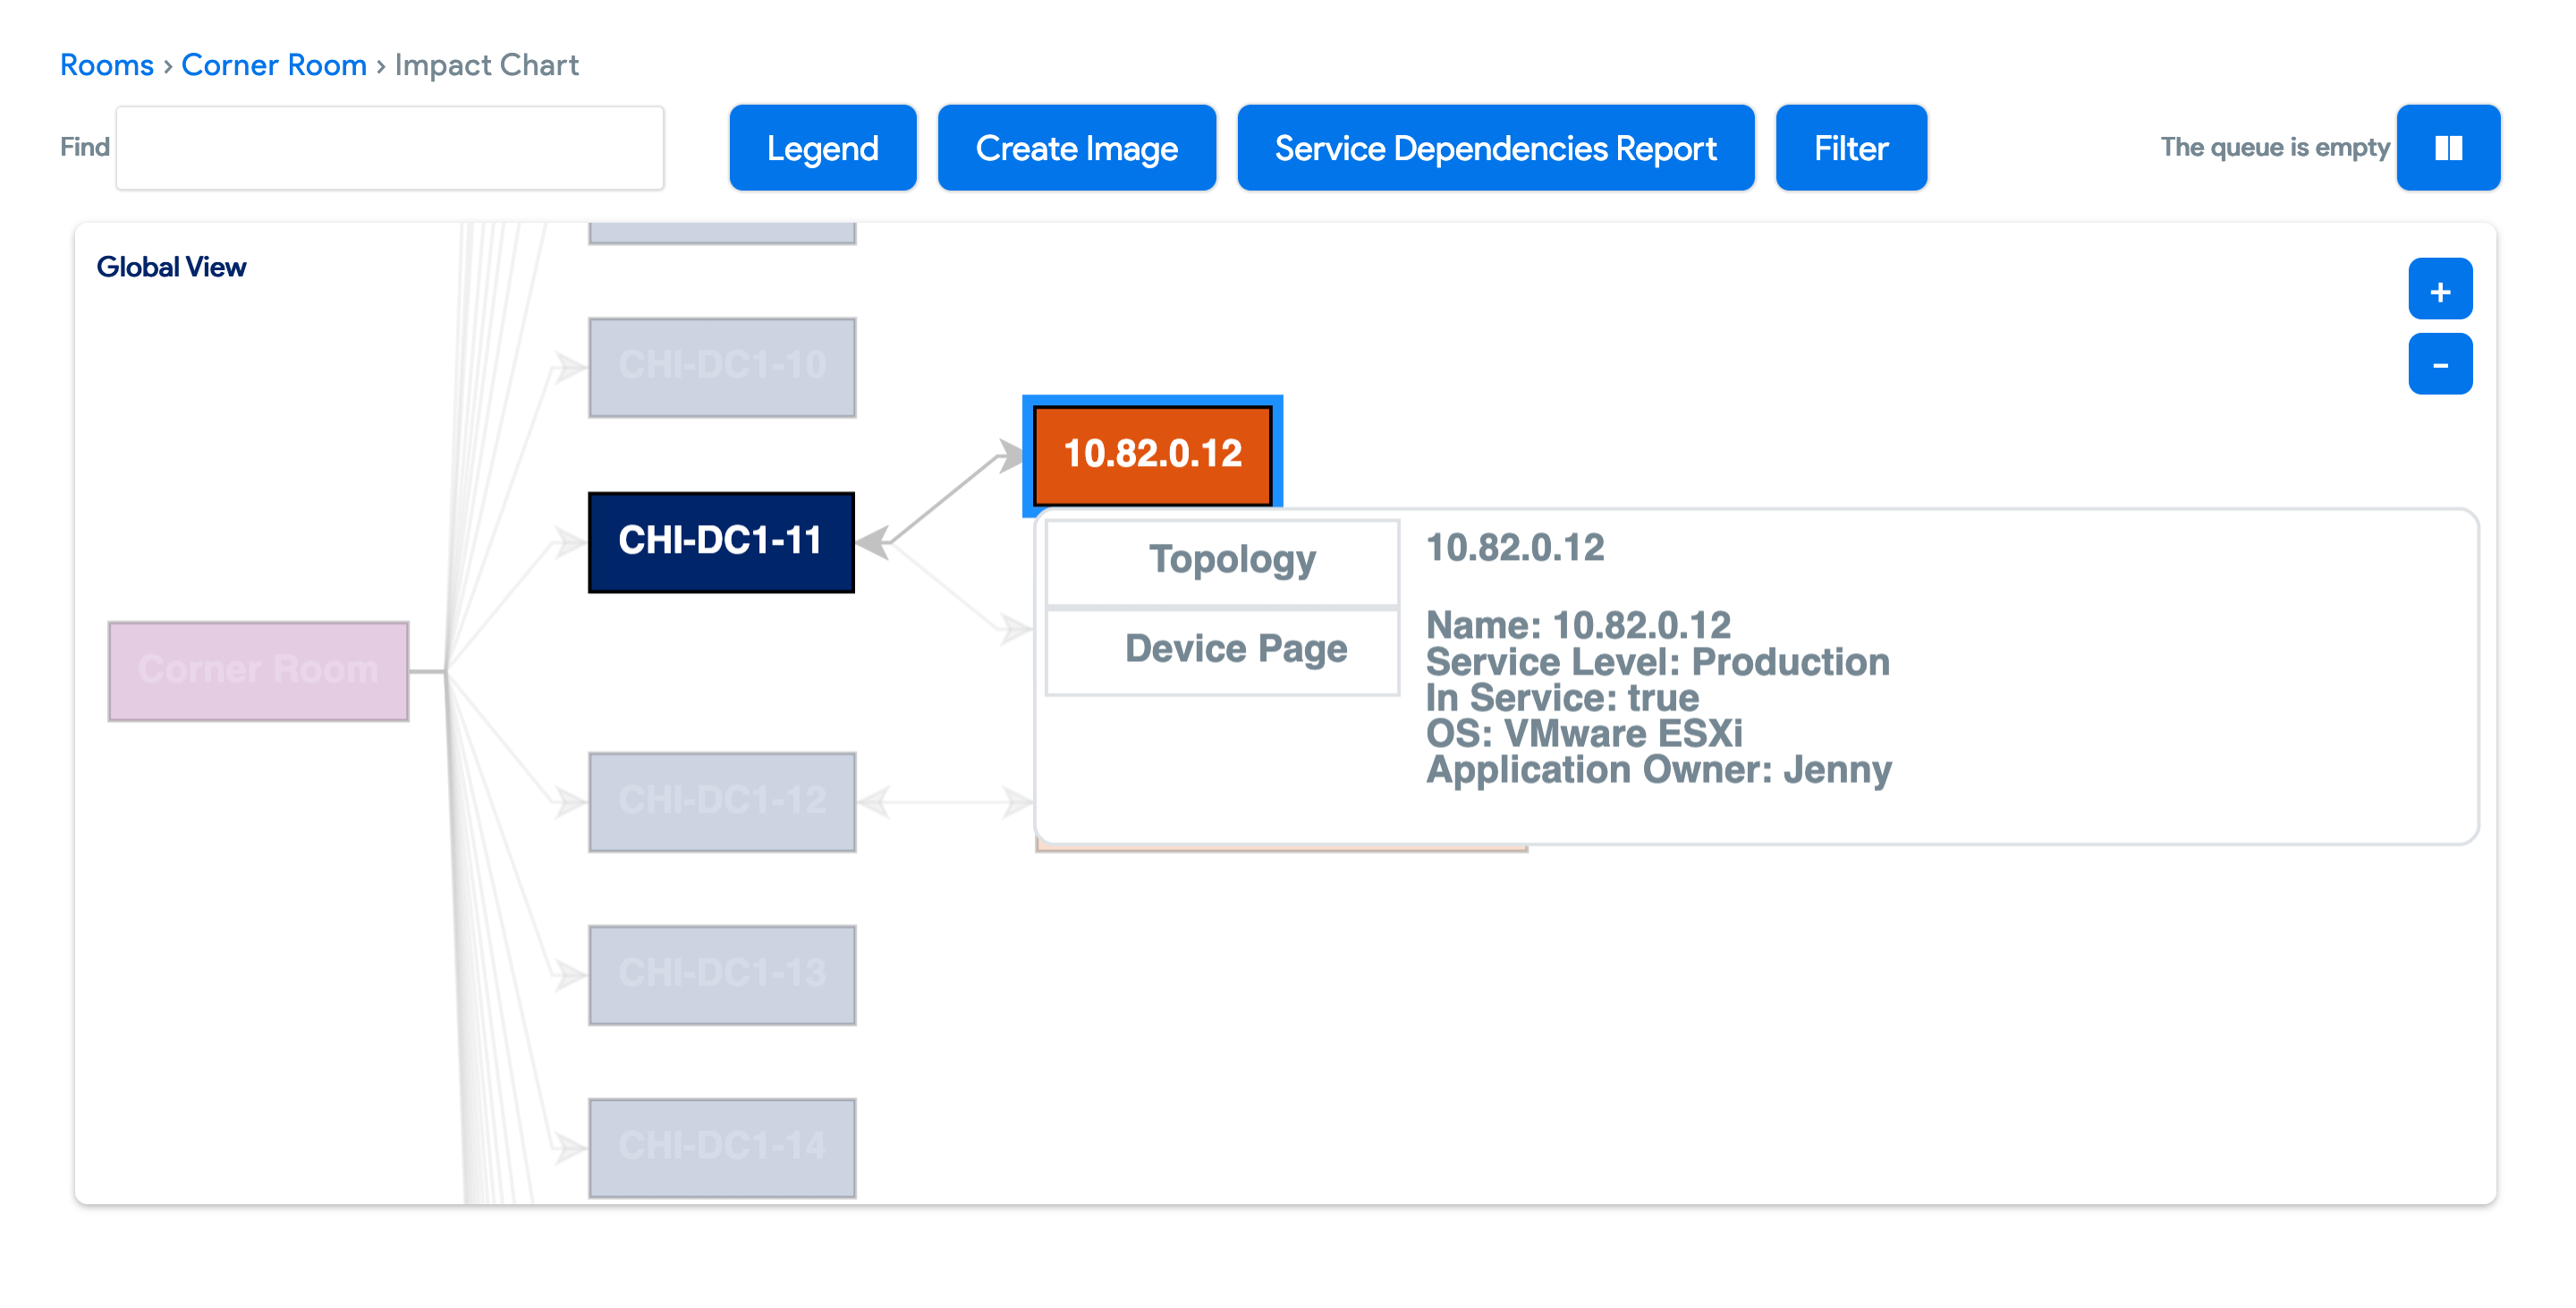
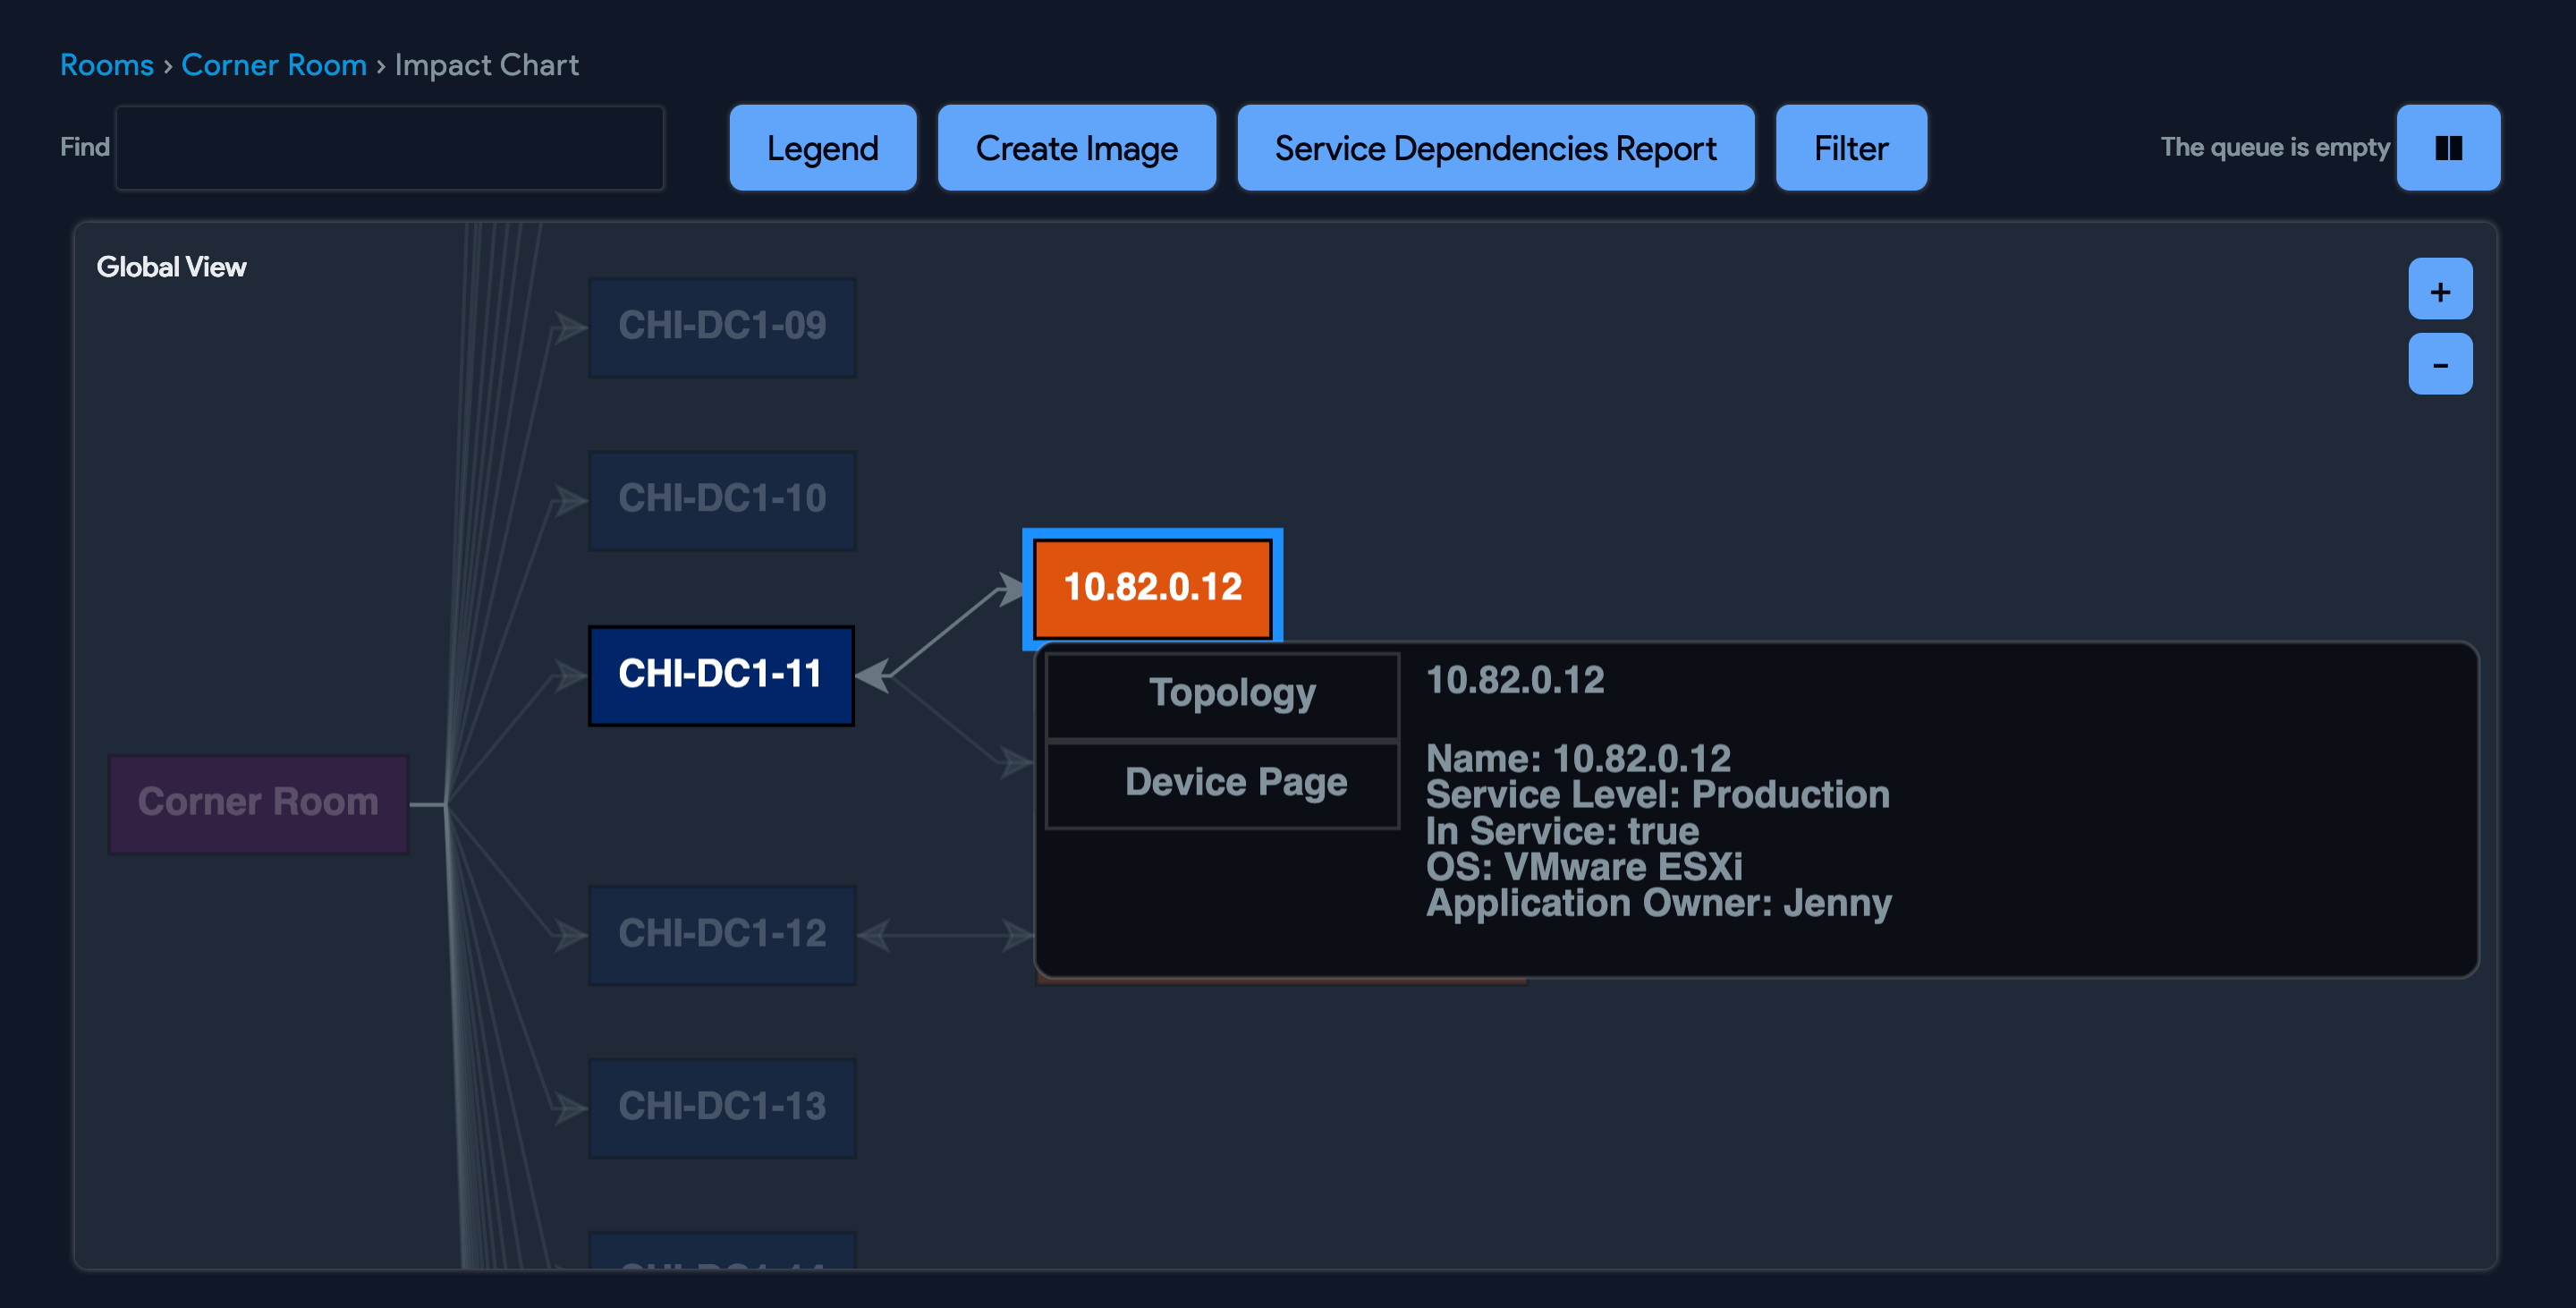
Hovering over any object will display a quick overview and relevant options. Hovering over a server, you can view the individual server's Topology or, by clicking the Device Page button, head straight to the device details page for that server:
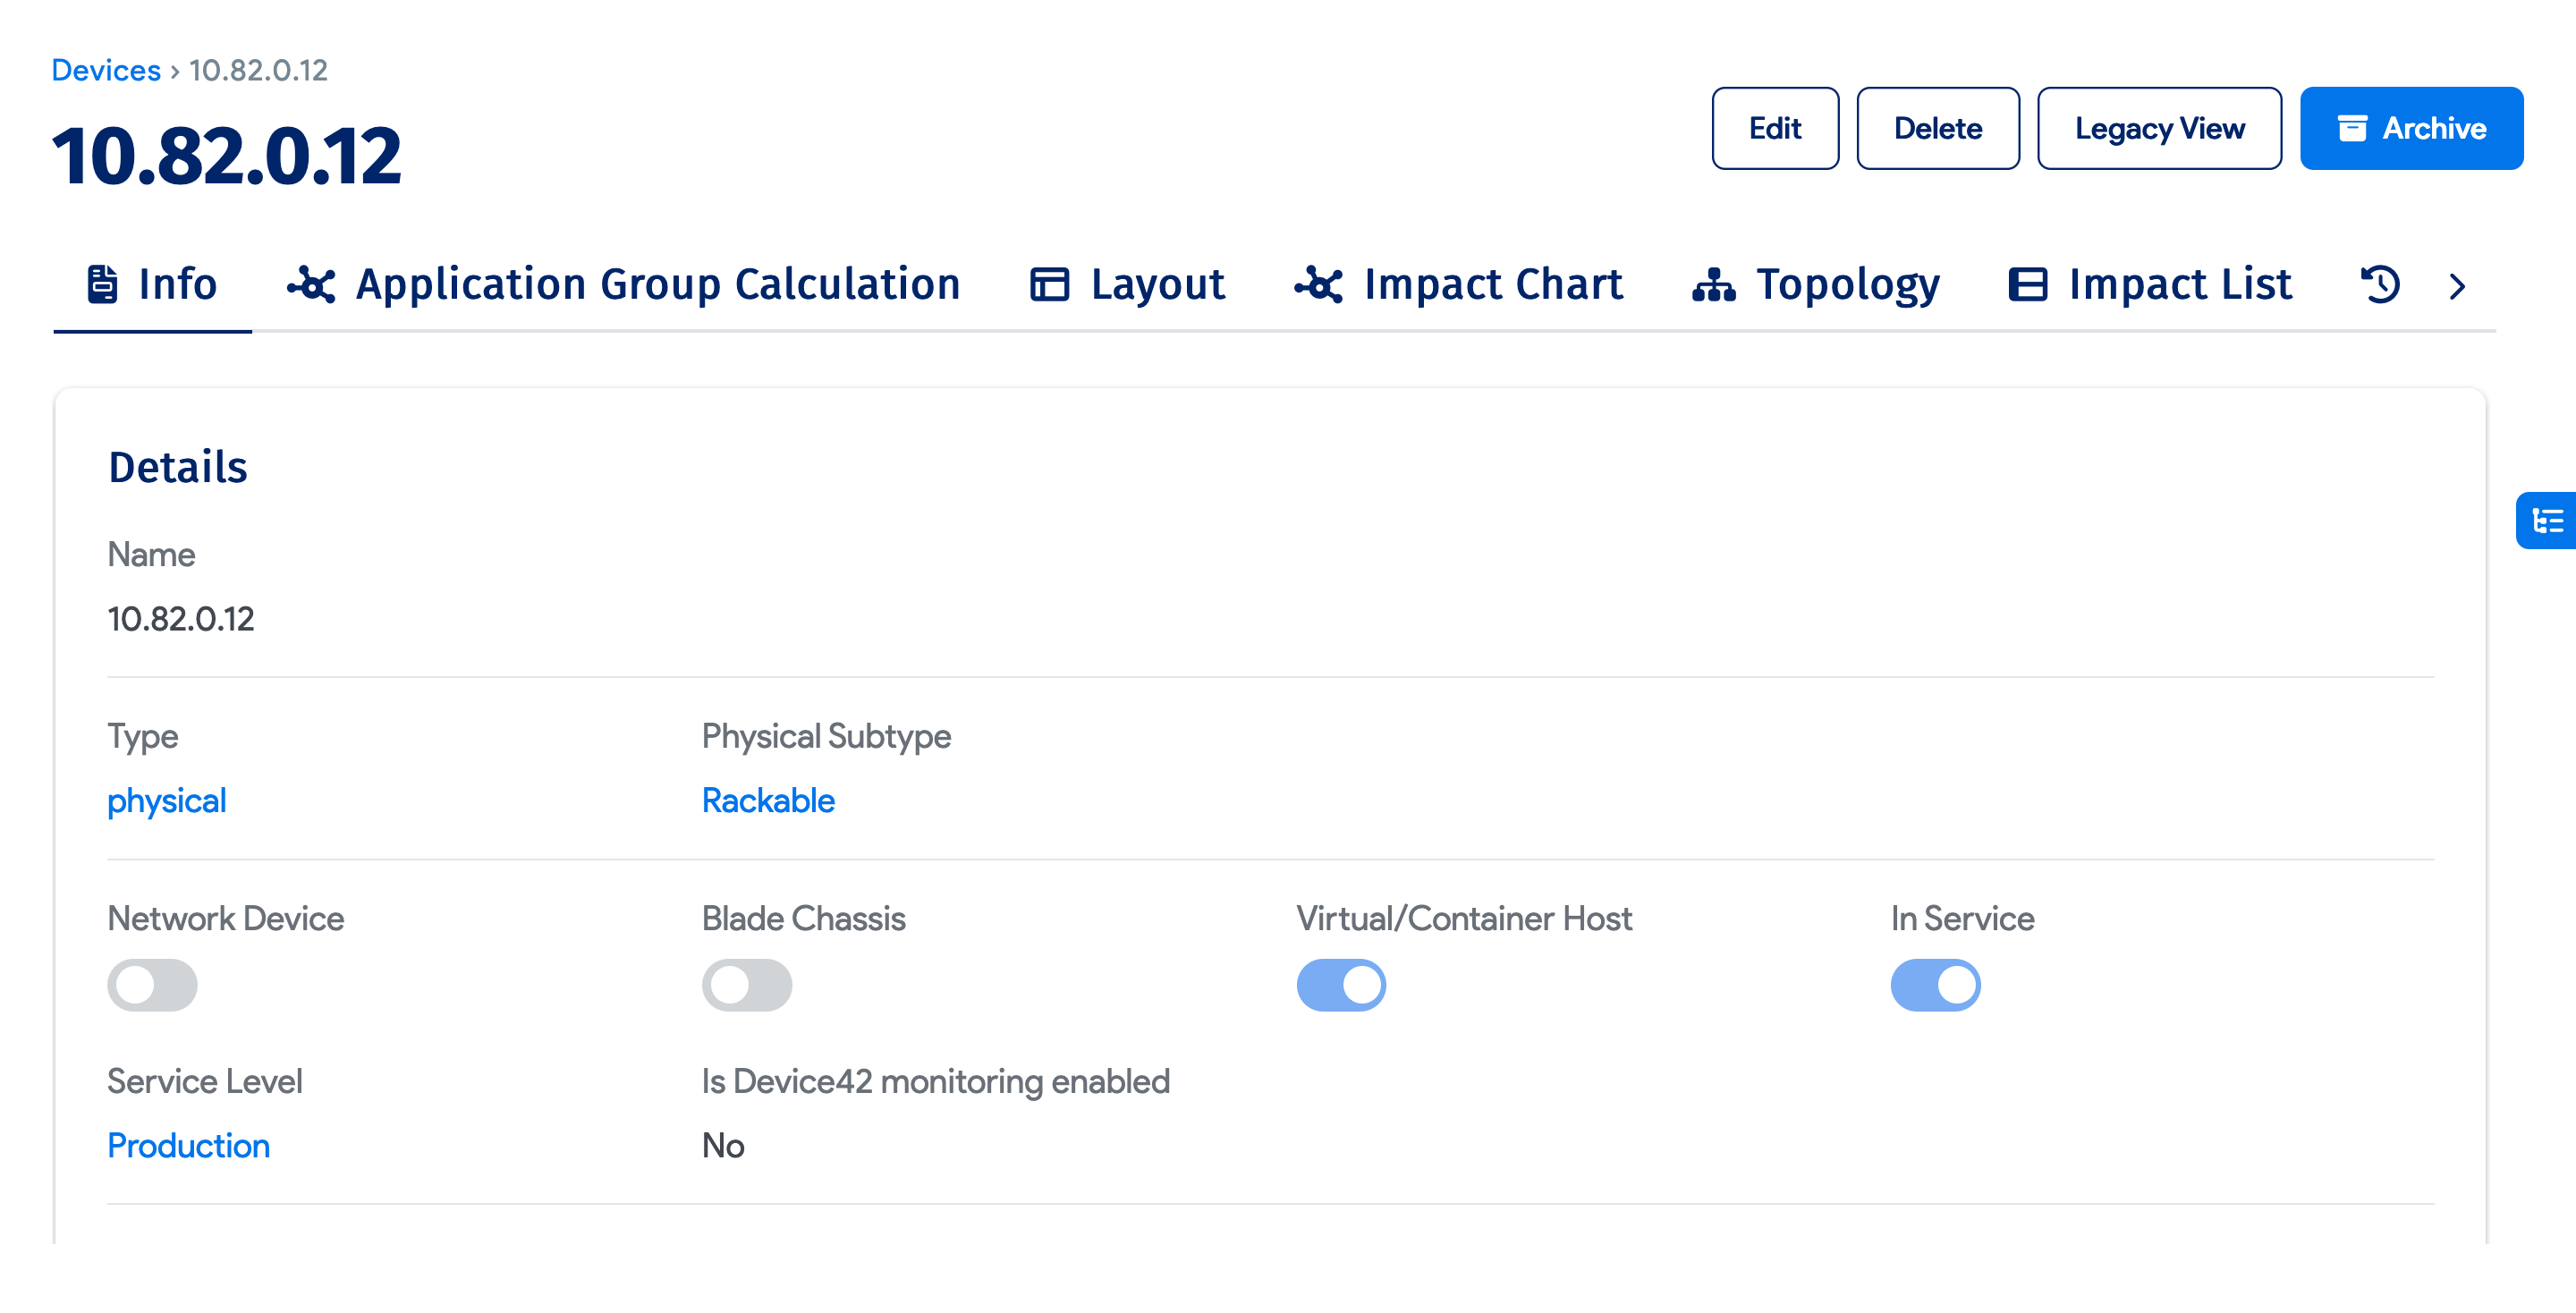
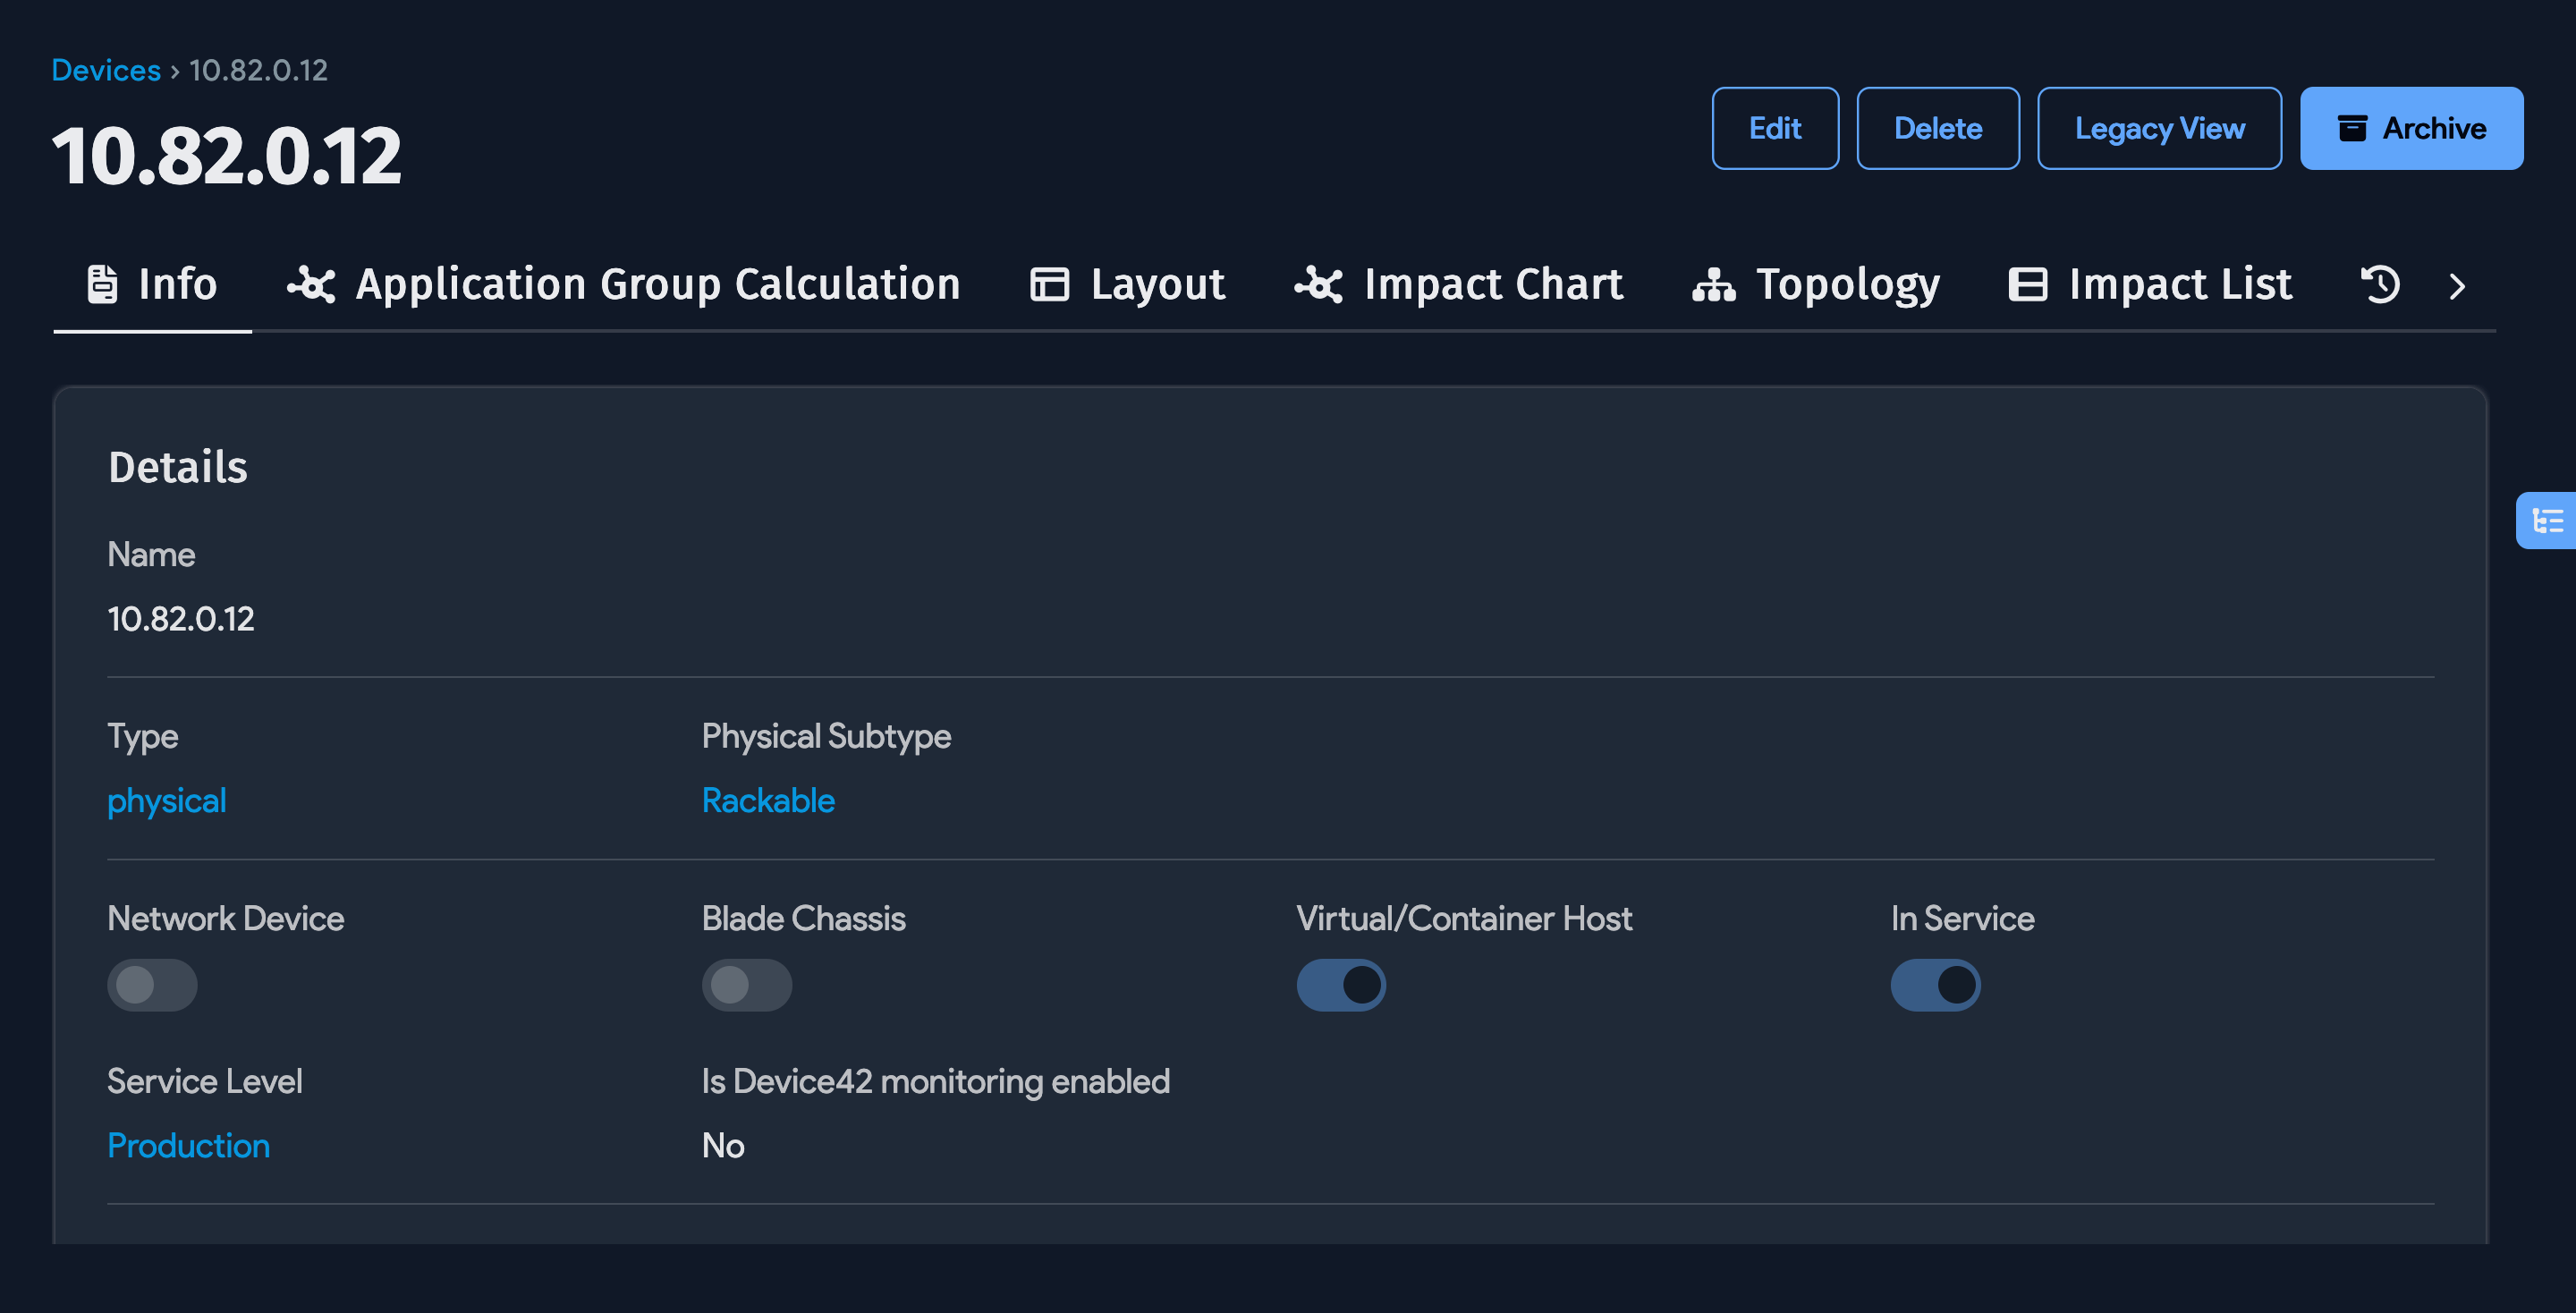
You can now see detailed information about the selected device, including its hardware specifications and when it was added to the system. Notice you can also access the Topology screen (your other option when you hovered) from the details screen.
Topology Charts for Devices
Device topology charts have more detail than the topology charts for other objects like buildings, rooms, and racks. In particular, device topology charts show services, executables, and ports.
A device topology chart displays information in three categories, allowing you to do the following:
- See which services, executables, and application components are running on a given device. Both services and their respective executables are detected automatically. Information about Application Components will be entered by you. Application Components are explained in more detail below.
- See which ports are in use, including details about which services and executables are providing information over those ports. You can also see detailed information about which services and executables on remote devices are accessing data from each in-use port.
- Get a full picture of exactly what would be impacted were a performance or security issue to exist on a given device, which can help you determine whether you need to remove a given device from a service, either temporarily or permanently.
Topology charts provide a full picture of all the services, executables, and applications that could be affected both on the device itself and, more importantly, on other related devices that depend on the device.
For example, if the device is a blade chassis or a virtual host, all the blades or virtual machines would be dependent on the device, and you would see those dependencies. Similarly, if Device42 discovers that a remote device is connecting to a port on the device, you would see the remote device (and its services, executables, and application components) in the topology chart. You can also manually define which application components depend on which other application component (see below), and those custom dependencies will display in the chart as well.
Below is the topology chart for a device. (Don't try to read the details. We'll zoom in below.)
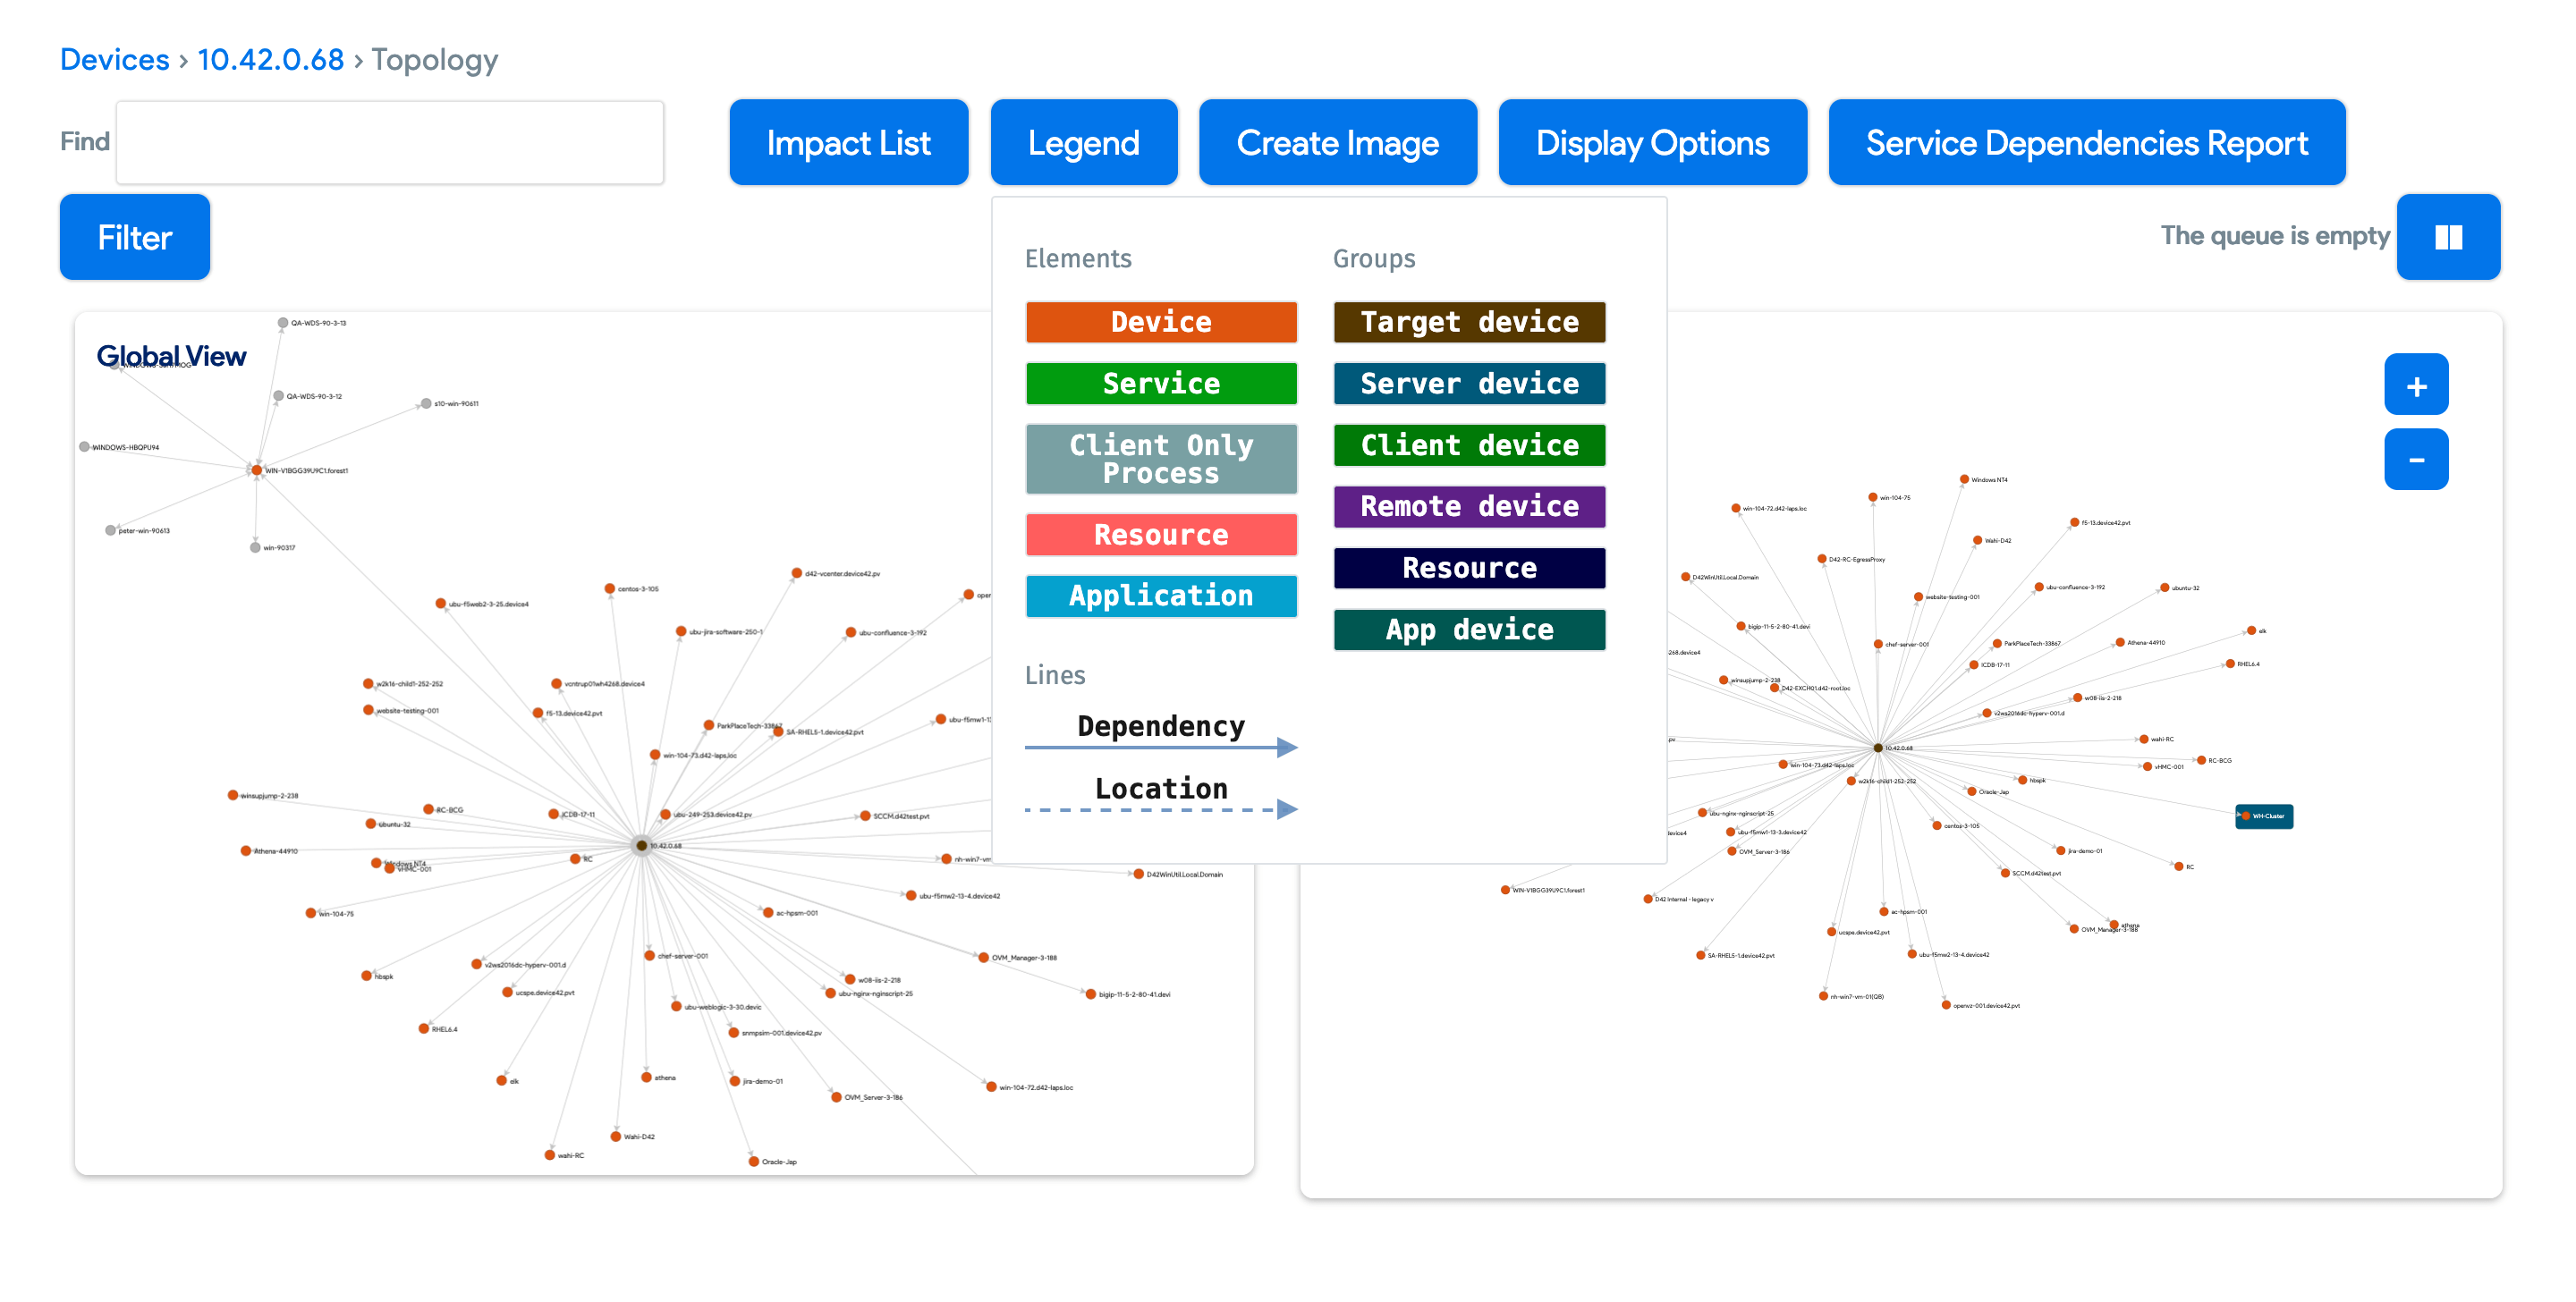
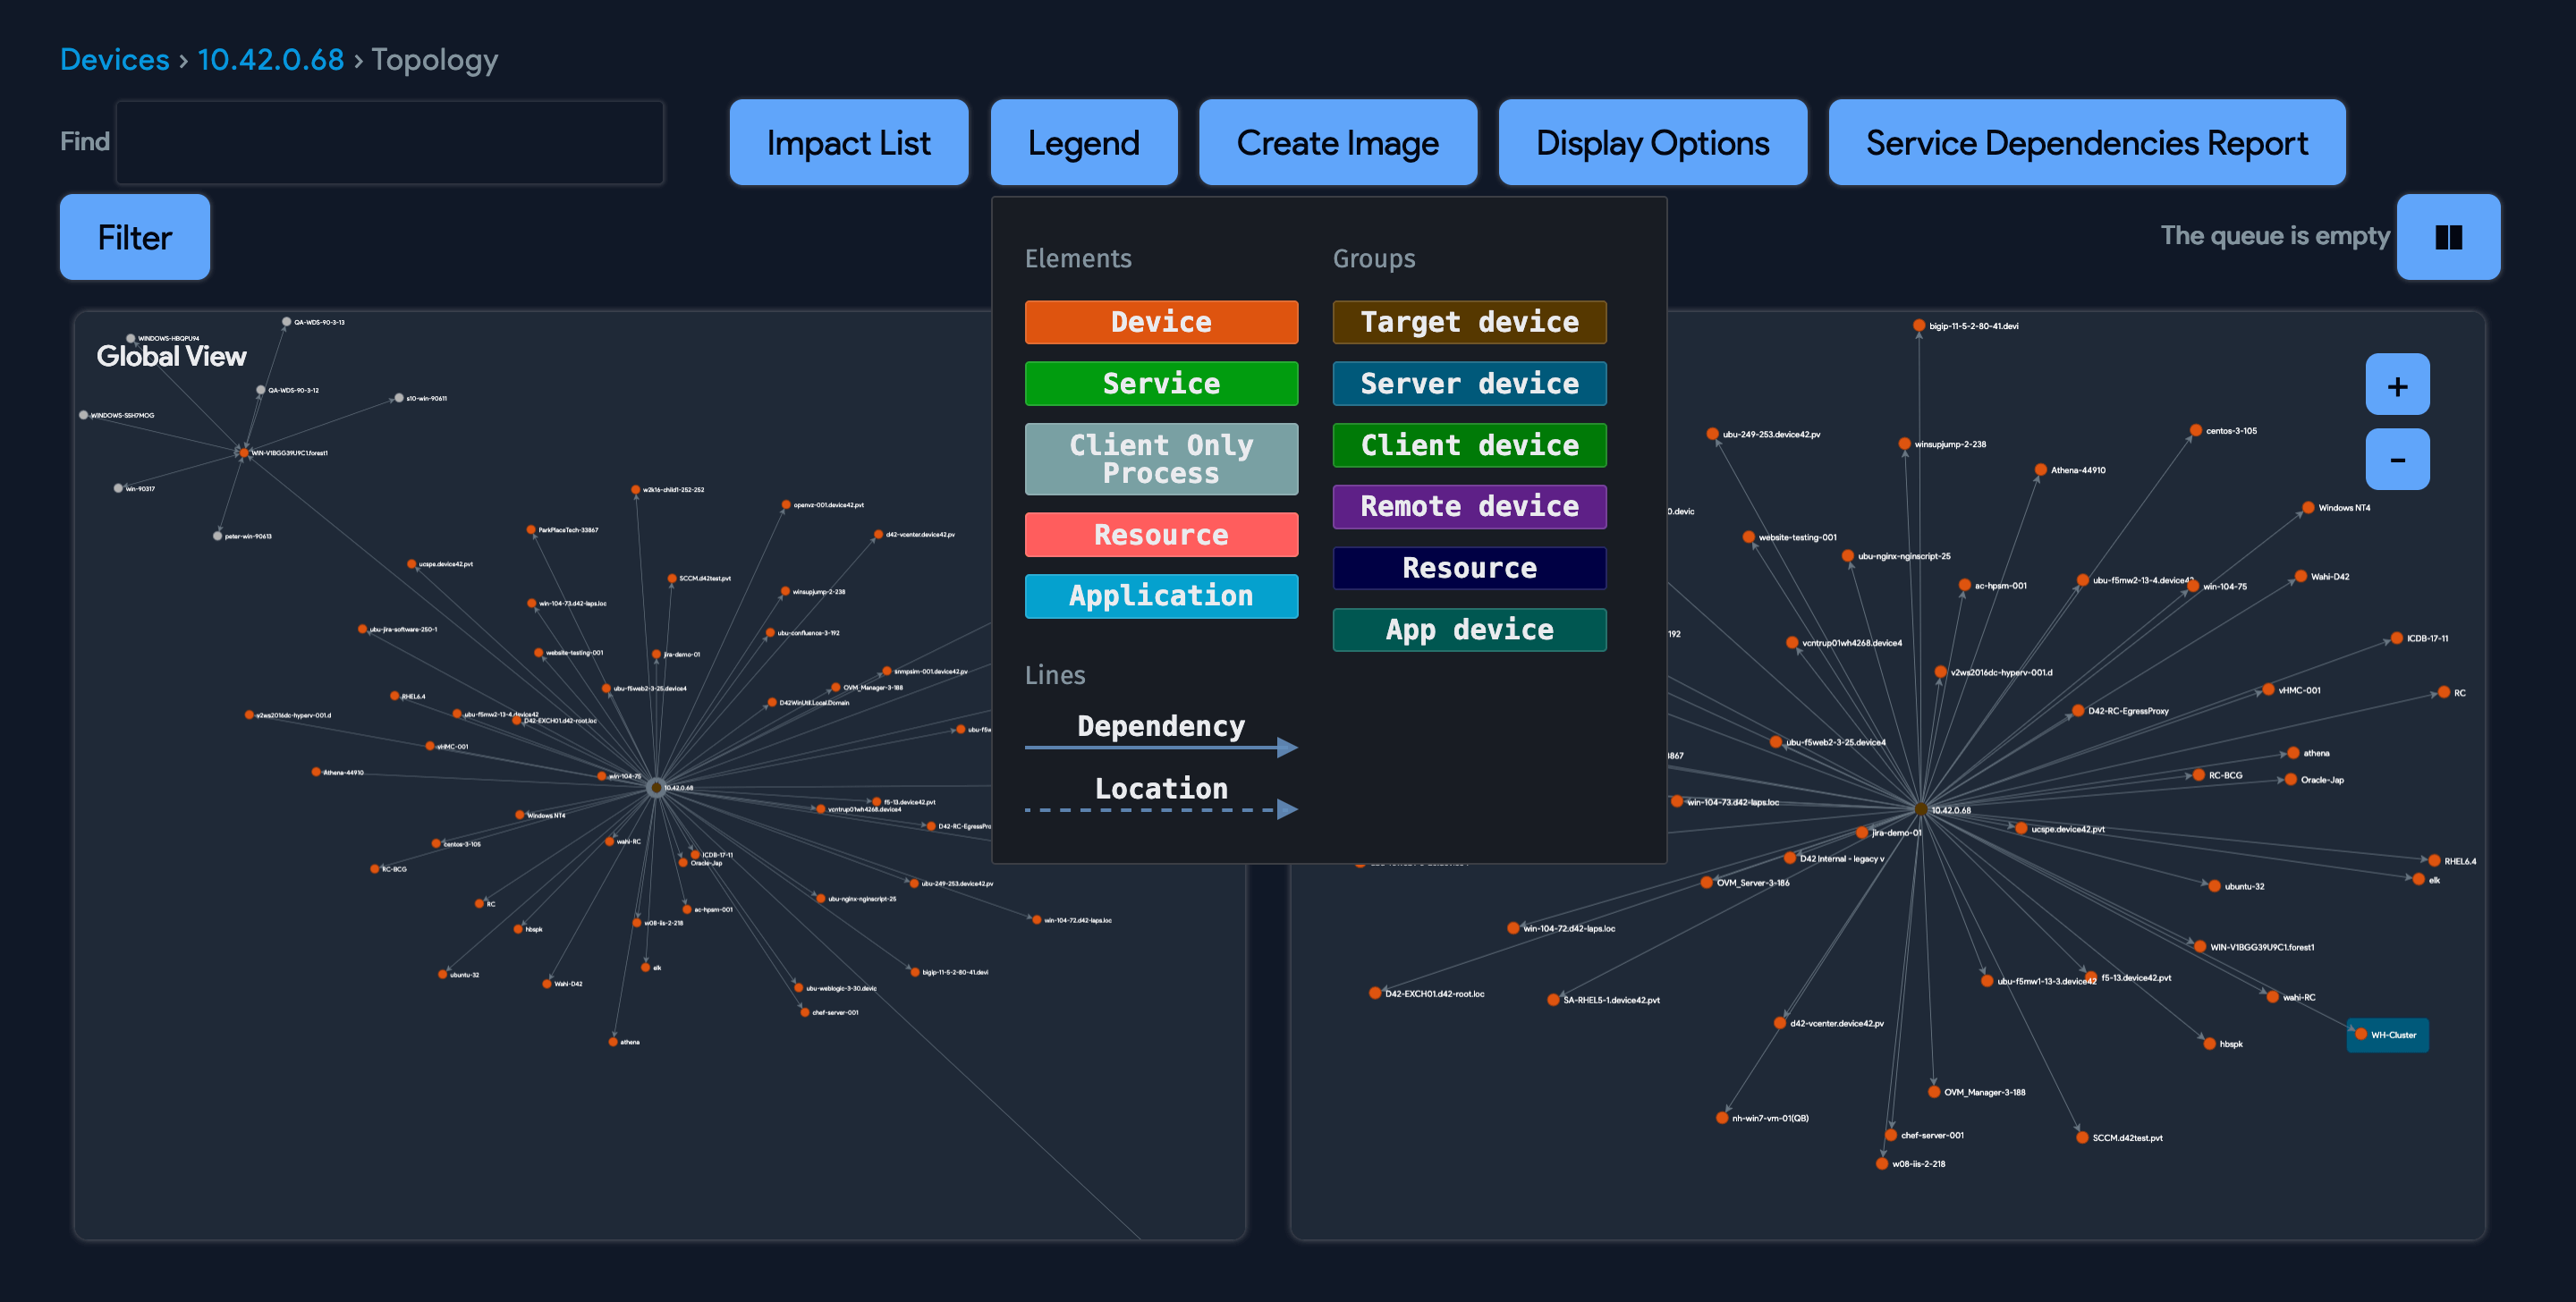
Topology Element Overview:
Global View is a simplified view of device-to-device directionality in relationship. No details of the relationship are viewable here, except the hostnames that have interactions with each other. Any type of device can be visible here. If there is any relationship of services, applications, hypervisor, or virtual, it will be represented in the Global View.
Local View is a complete view of the details for the relationships shown in the Global View. Each Device will have a grouping that contains the device itself, any nested devices (VMs or Containers), services, and application components. The Local View will represent the communication directionality of any services and application components that exist to represent the dependency or impact of each configuration item, depending on the discovered listener or client service connections.
Device Topology Legend
The device topology chart has its own legend:
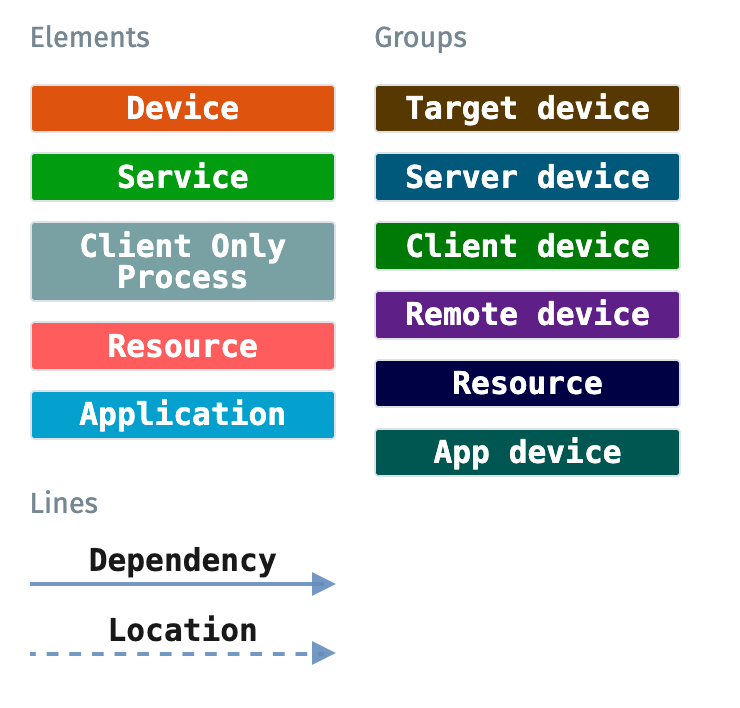
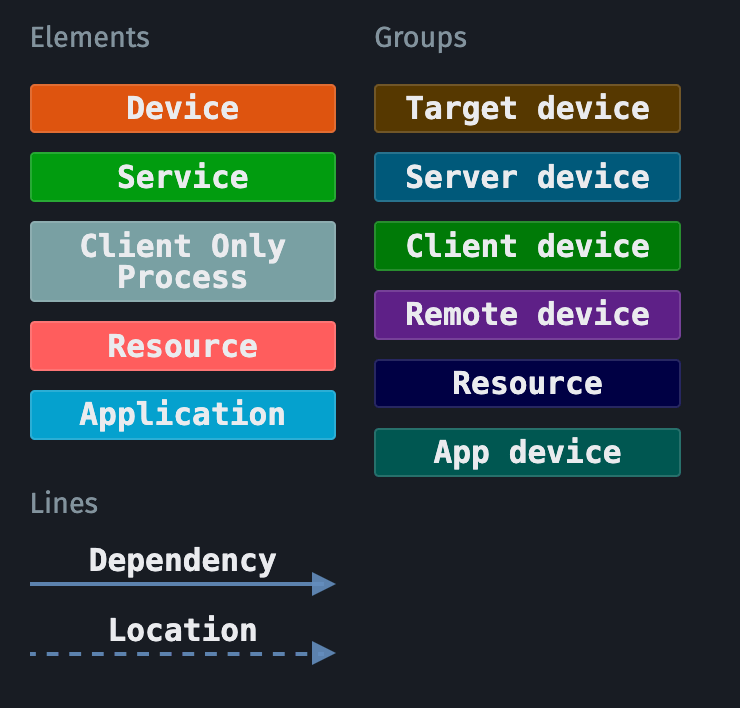
Legend Definitions
Elements:
- Device: Device objects that have been discovered or added with relational service or application data.
- Service or Executable: Discovered or added services, typically all listening services running at point of discovery. Often associated with an application component, Application in the above legend.
- Application: Discovered common applications or an application component that has been added manually and related to any in-view device or service.
Groups:
- Target Device: The point of origin for the Topology, this color highlights the device that the Topology button was selected from.
- Server Device: Device object that is running a service as a listener with clients connecting to it.
- Client Device: Device object that is running a service as a client connecting to a remote listener.
- App Device: A grouping for only device objects that have been related directly to an application component, no services in this case, and typically defined manually in an application component.
Topology Chart Options
Display Options
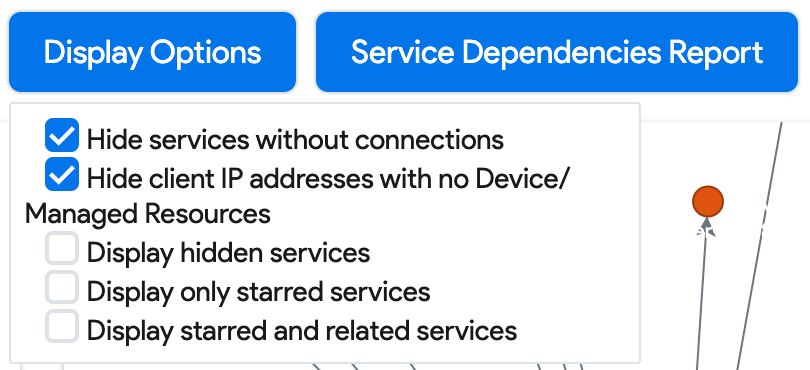
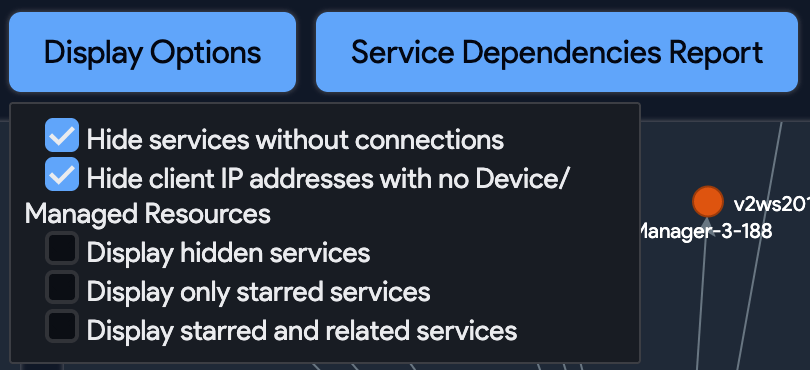
The Display Options are used to manipulate current in-view objects based on the below criteria:
- Hide services without connections: This shows any service objects that have been discovered on an in-view and associated device, but with no connections yet discovered or added. (By default, this box is checked.)
- Hide client IP addresses with no Device/Managed Resources: This shows IP addresses for any remote connections that were found in the netstat table of the in-view discovered devices. These are not yet considered Device objects in the database and are classified as clients or remote connections of the service objects. (By default, this box is checked).
- Display hidden services: This displays any services that have been toggled as "hidden".
- Display only starred services: This displays any services that have been toggled as "starred".
- Display starred and related services: This displays any services that have been toggled as "starred", as well as services that are the client or listener of a "starred" service.
The Service Dependencies Report button generates an XLS file for all listener services with connections to any devices currently in view on the current topology chart. This will include raw data for listener or client devices and service details with port and connection statistic information.
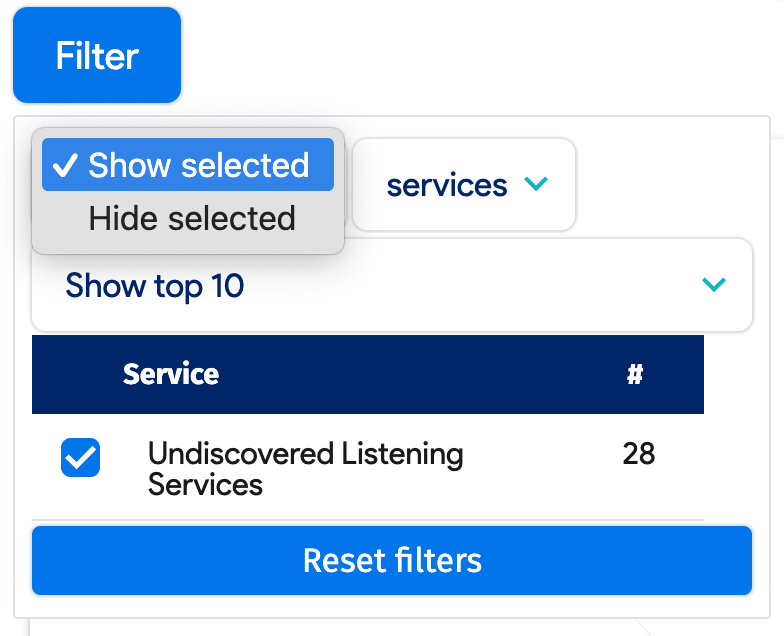
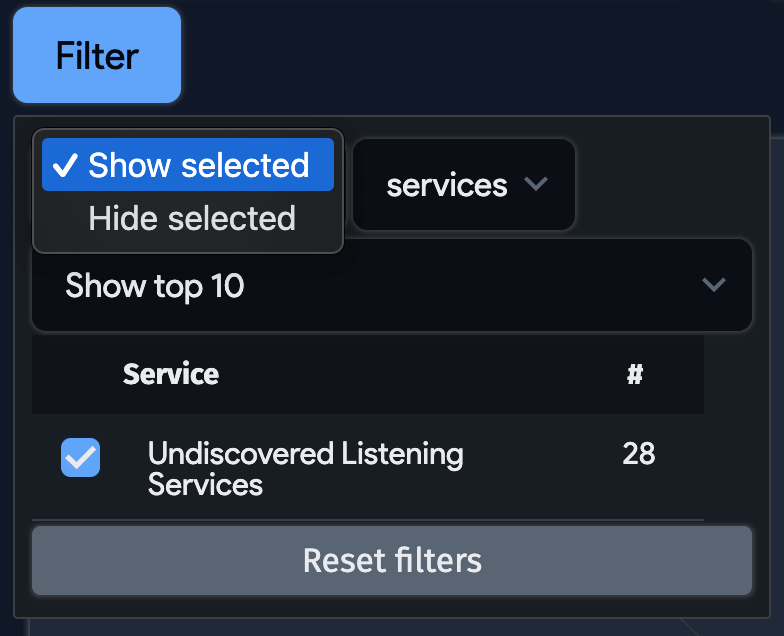
The Filter provides options to Show Top # of services and to select key services that you want shown or hidden in the current topology. Selecting any services will calculate a new topology that takes the selected services into consideration. See the image above.
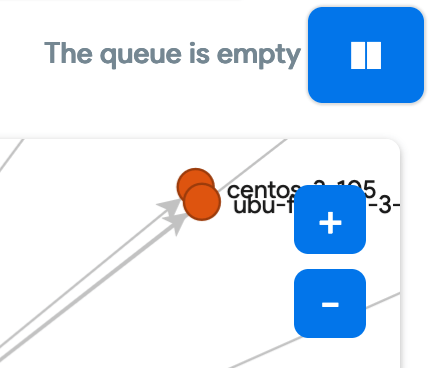
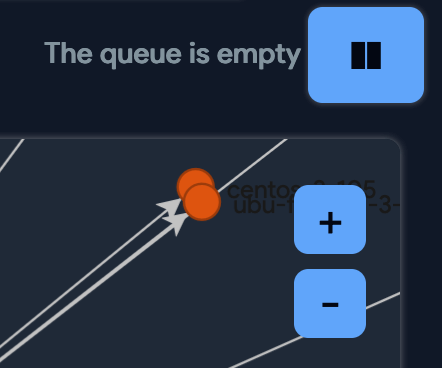
The Pause button allows you to stop the topology calculation, which can be beneficial if the topology selected has a large number of relations, as it allows you to stop calculation at different levels so that you can look at current data and continue the calculation if desired.
Nested Context Menus
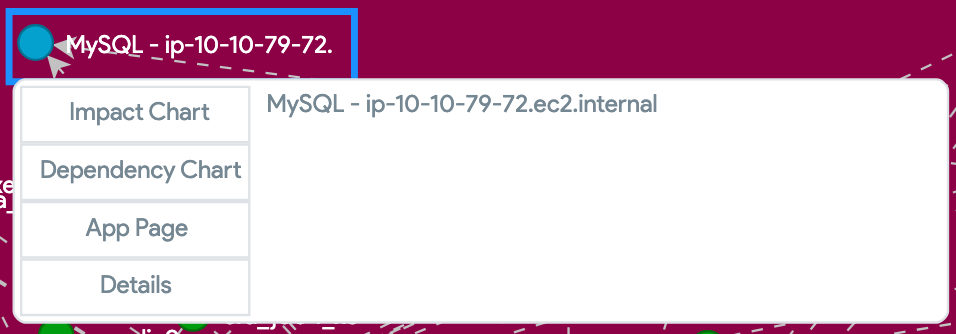
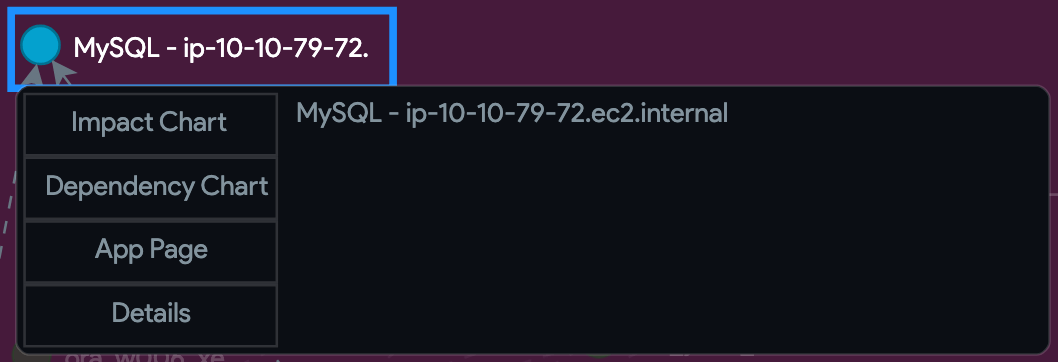
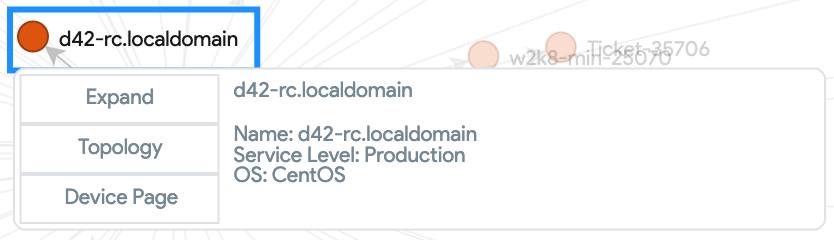
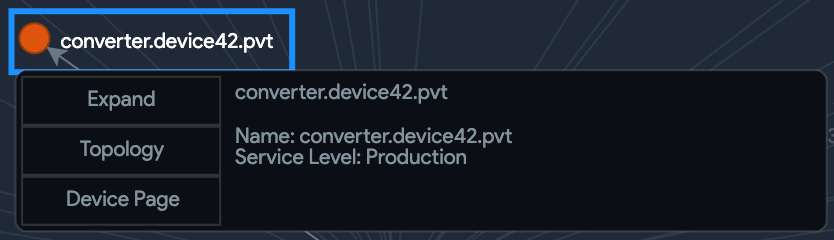
View context menus by hovering your cursor over an in-view object within a topology chart.
- Service Object: Summary details of the related Service.
- Star: Will set the service as "starred" status allowing control with Display Options and a parameter available for queries or reports.
- Hide: Will set the service as "hidden" status allowing control with Display Options and a parameter available for queries or reports. Hidden services will not be in view by default when Topology loads.
- App or Service Page: Will navigate you to the object details view for the related service.
- Device Object: View summary details of the related device.
- Expand/Collapse: Open the device to show all related services to expand the potential impact/dependency in view of the current topology, based on the level of the Target Device.
- Topology: Open a topology for the related device, setting it as the Target Device for the topology to be loaded.
- Device Page: Open the object details view for the related device.
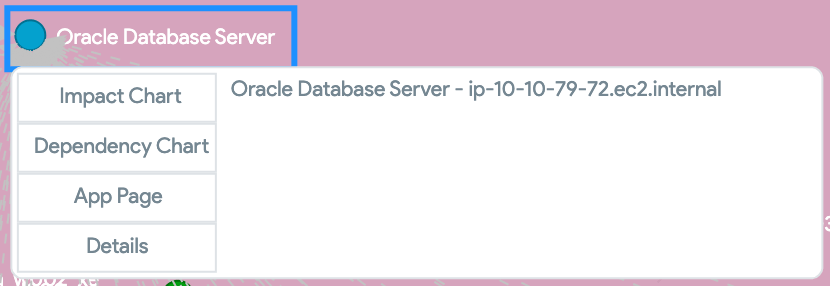
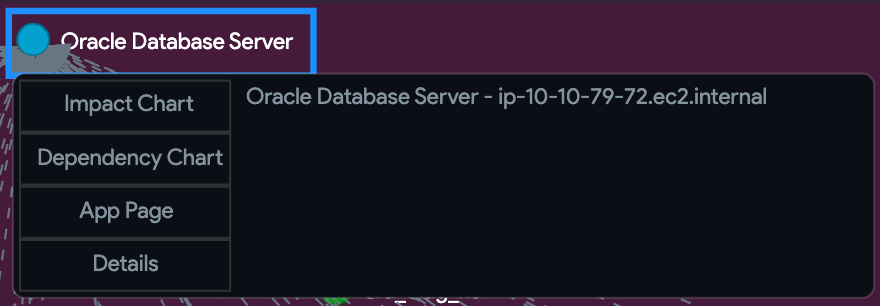
- Application Component Object: View summary details of the related application component.
- Impact Chart: Open a "downstream" view of any application components that rely on the selected application component. The view is simplified to only application component objects.
- Dependency Chart: Open an "upstream" view of any application components that the selected application component depends on. The view is simplified to only application component objects.
- App Page: Open the object details view for the related application component.
- Details: Open a pop-out window for a blob of the configuration file for the related application components added by discovery for any common applications.
Download Images and Service Dependency Reports
Most impact and topology screens have a Create Image button that allows you to download an image in your chosen graph format:
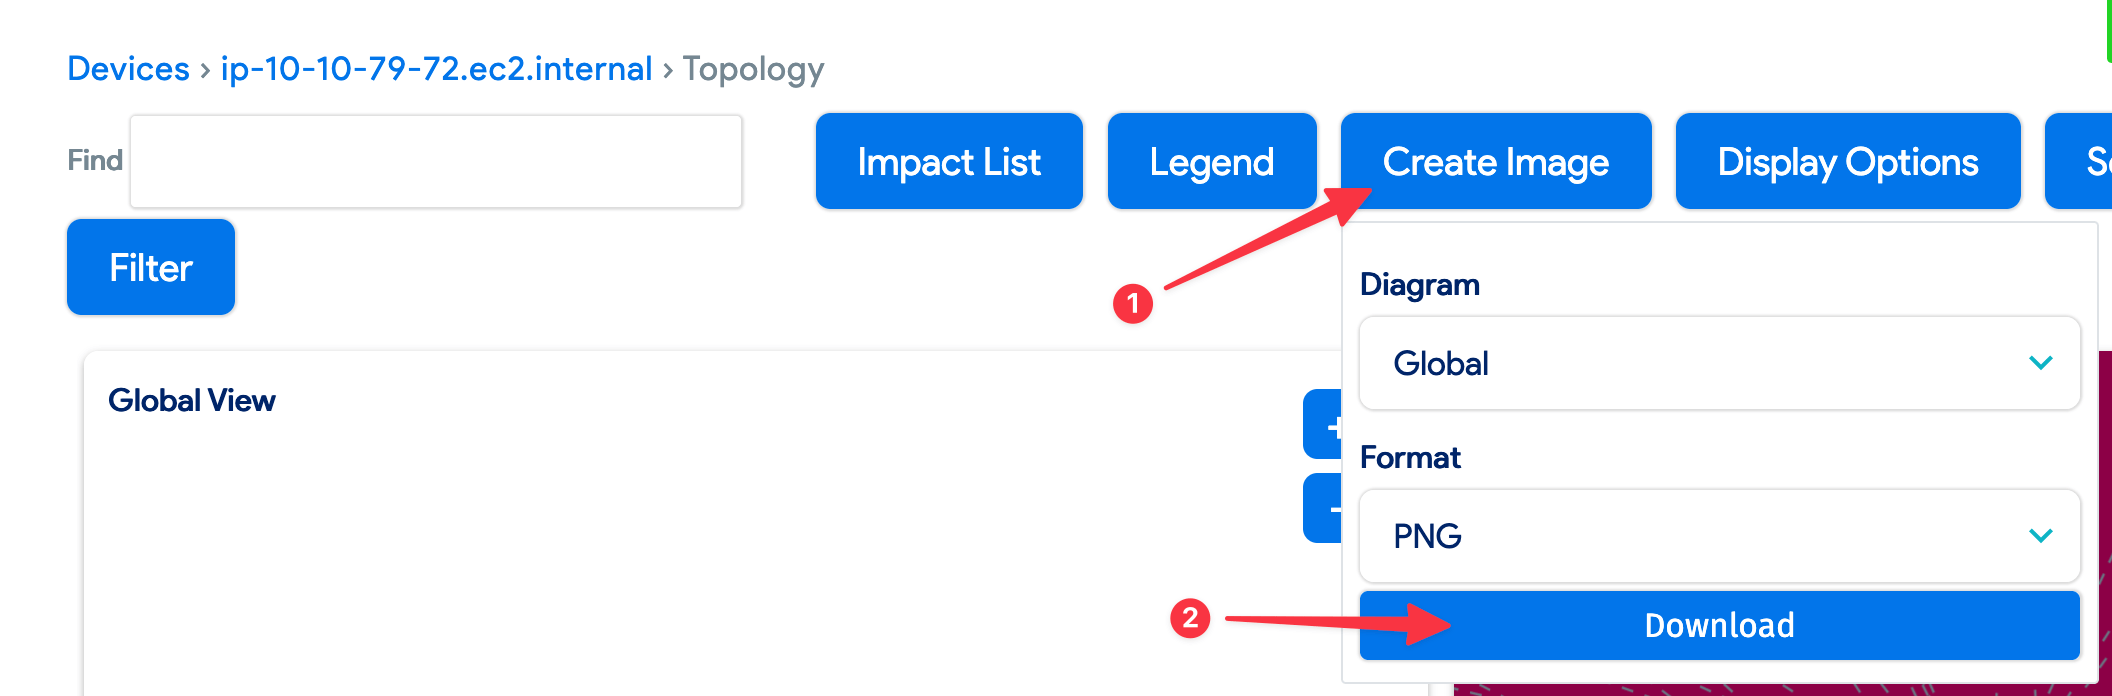
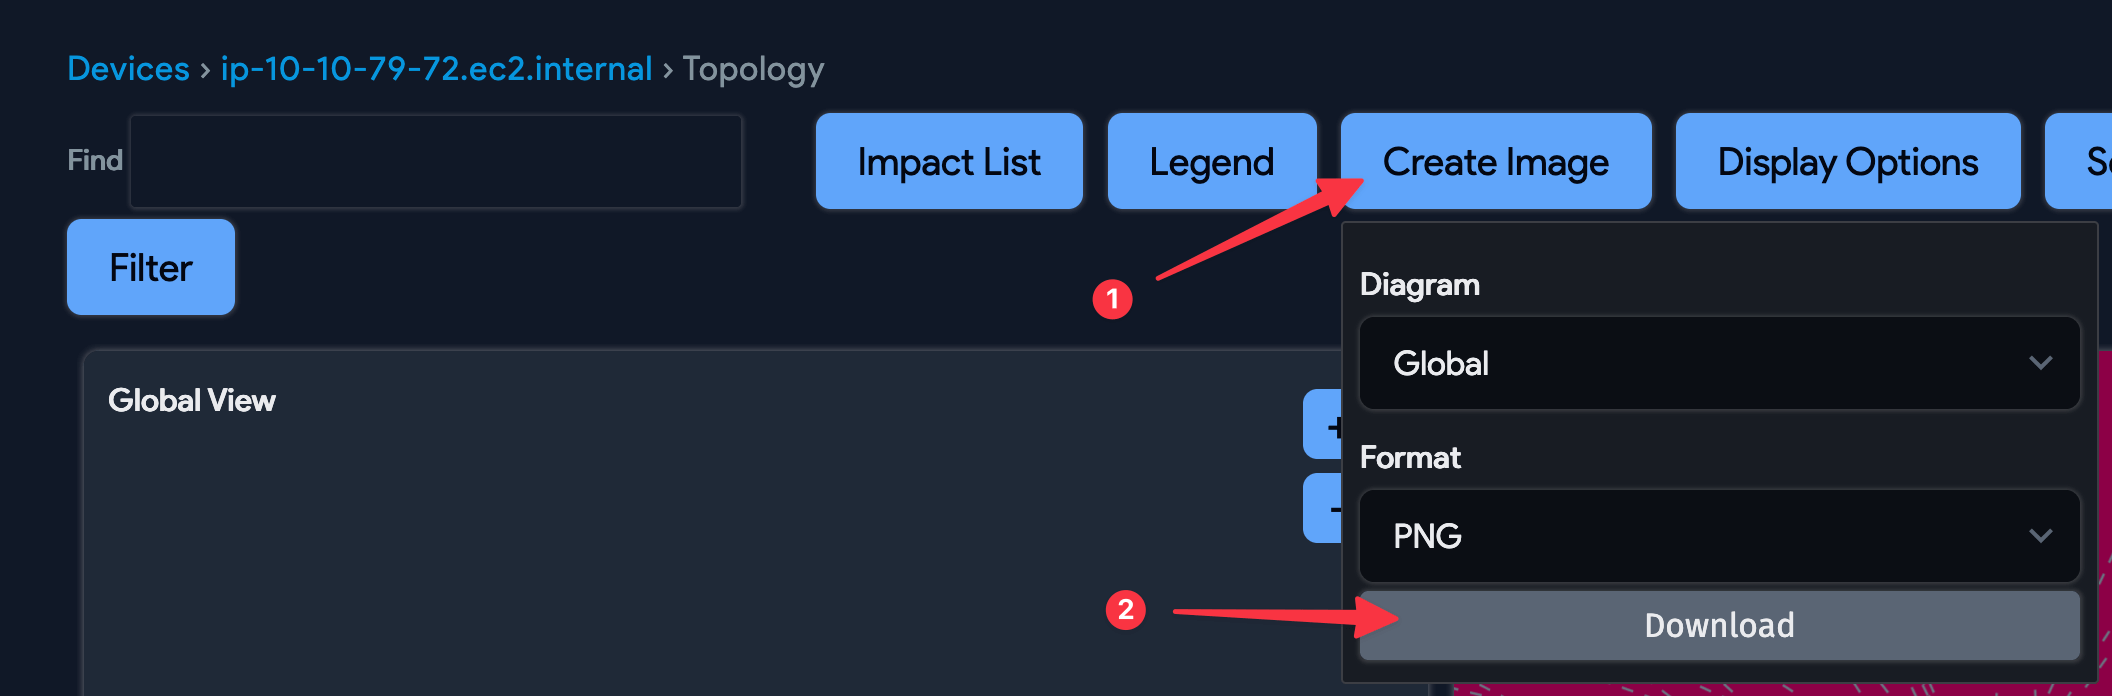
The Create Image button allows you to choose from two layout options: You may choose the Global or the Local view pane, and can also choose either PNG format or SVG (vector) image format. Simply click the Download button to choose your save location, and save the file wherever is convenient for you.
Service Dependencies Report Download
The topology chart view screen offers users a Service Dependency Report download as well. Service dependency reports are generated in real-time, as soon as the button is clicked, and delivered as an Excel file containing a list of all source machines, listening ports, services, and any remote machines that are connected to those services. Users may also download previously requested service dependency reports by visiting Reports > Excel Reports Status:
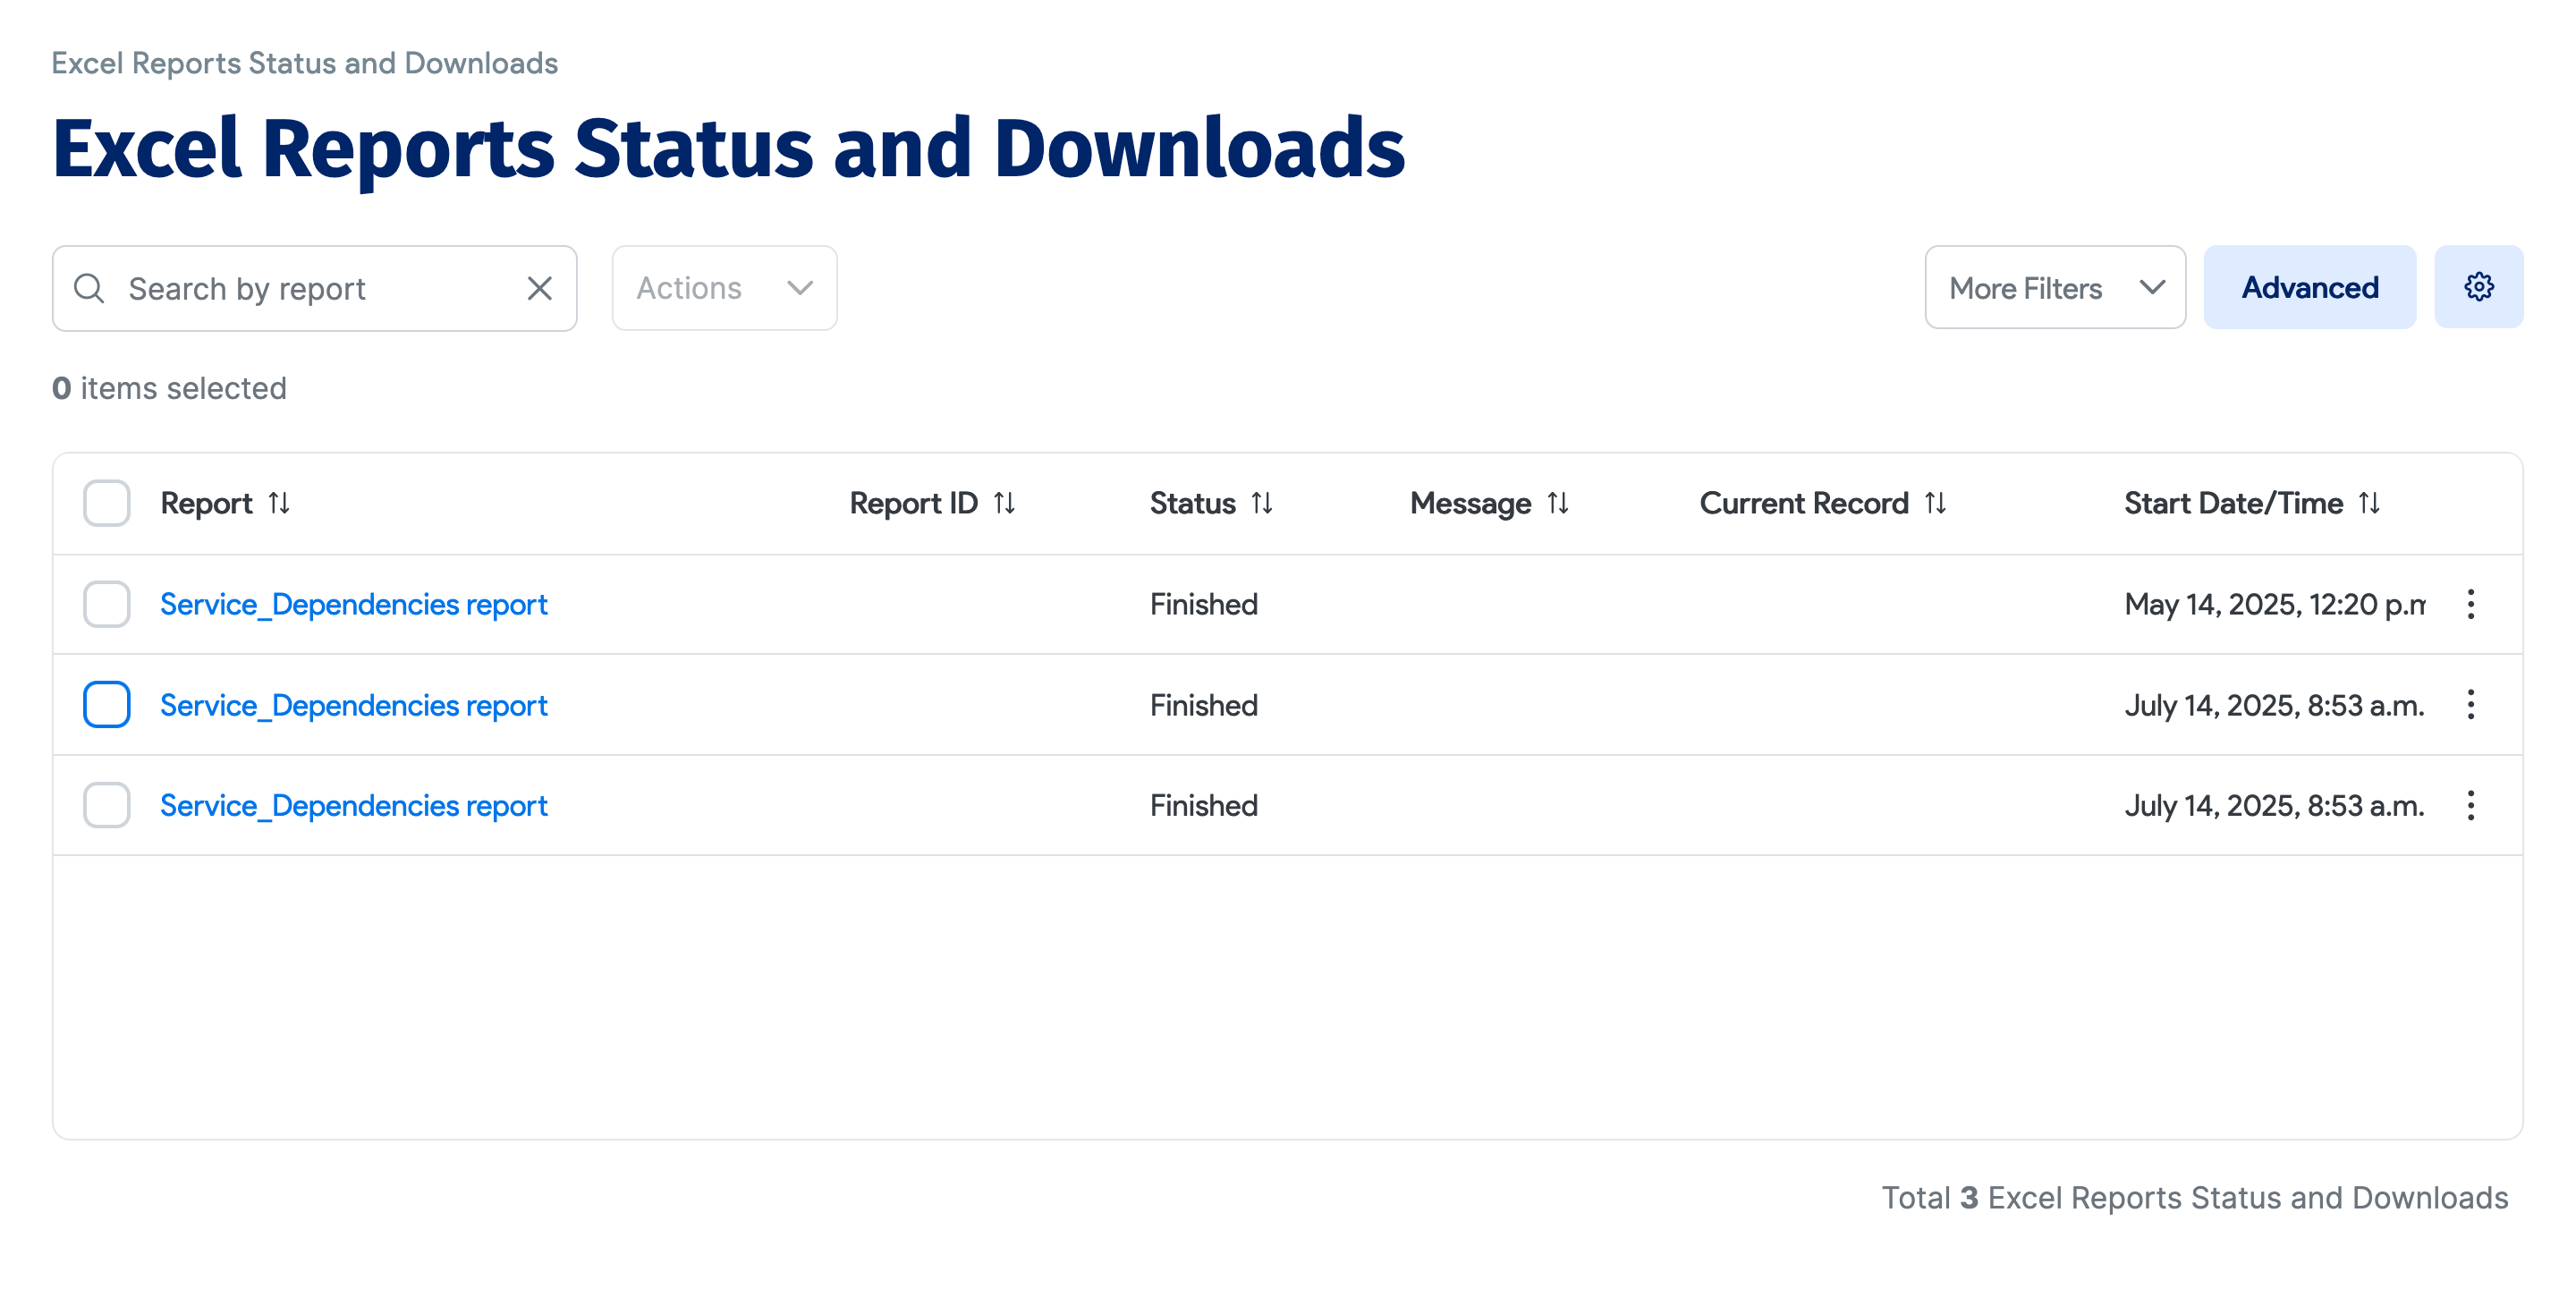
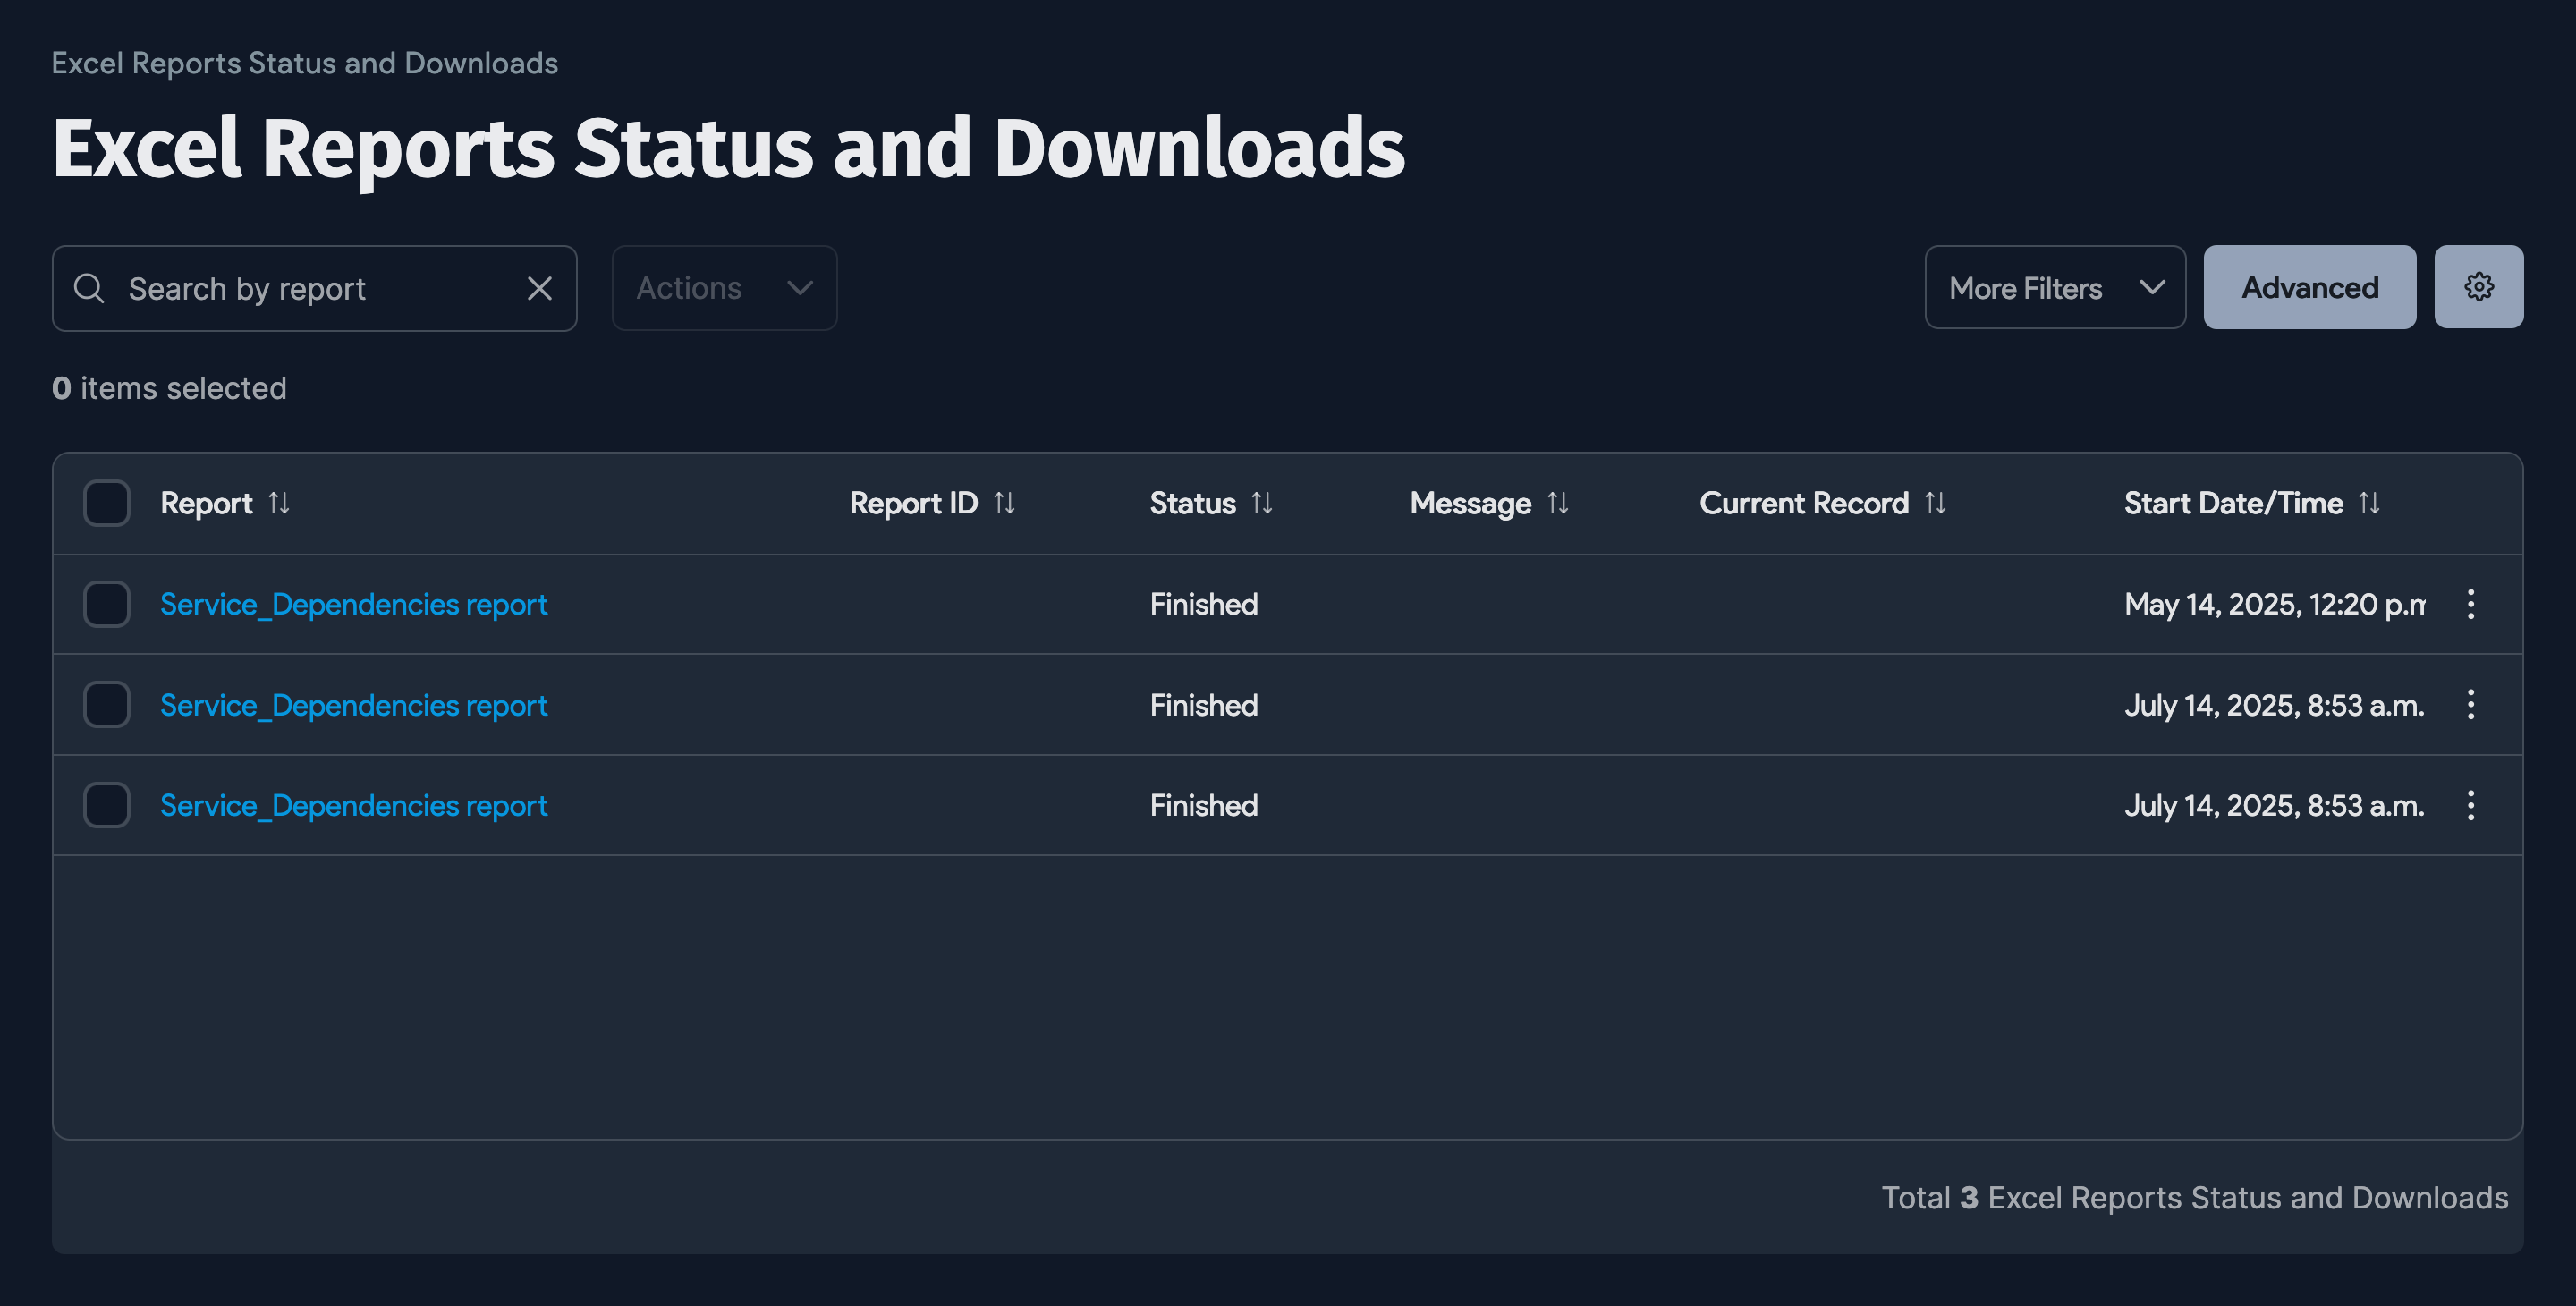
For a sample report and field explanations, see the Service Dependencies Report section below.
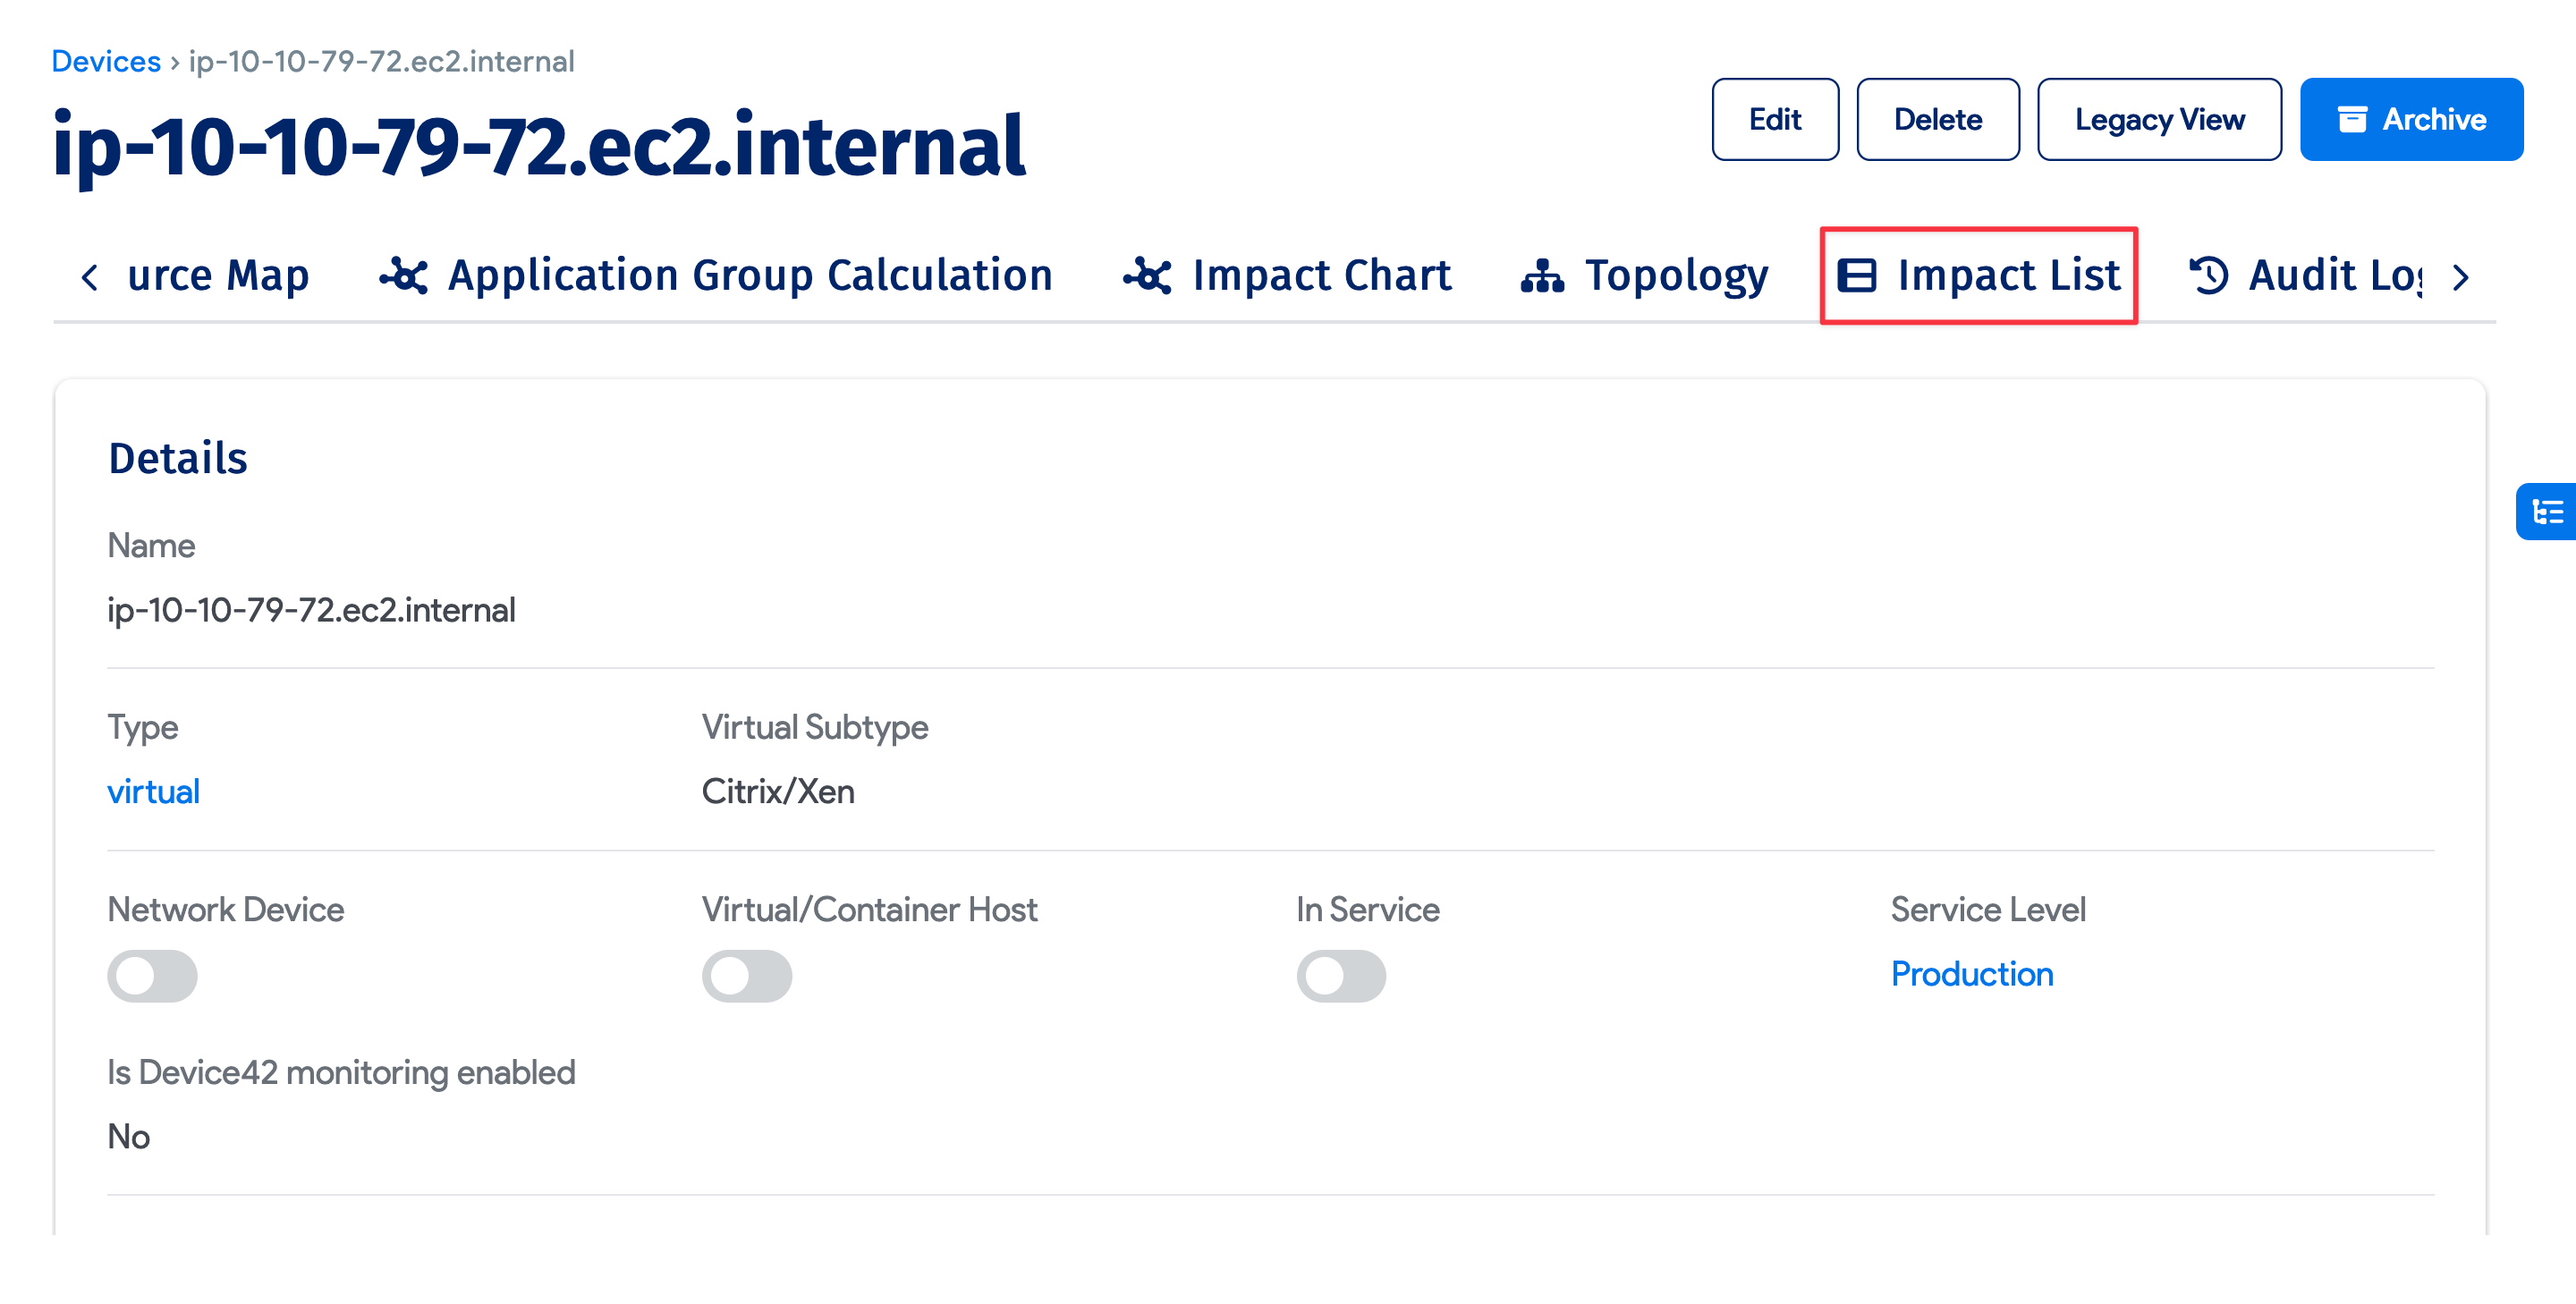
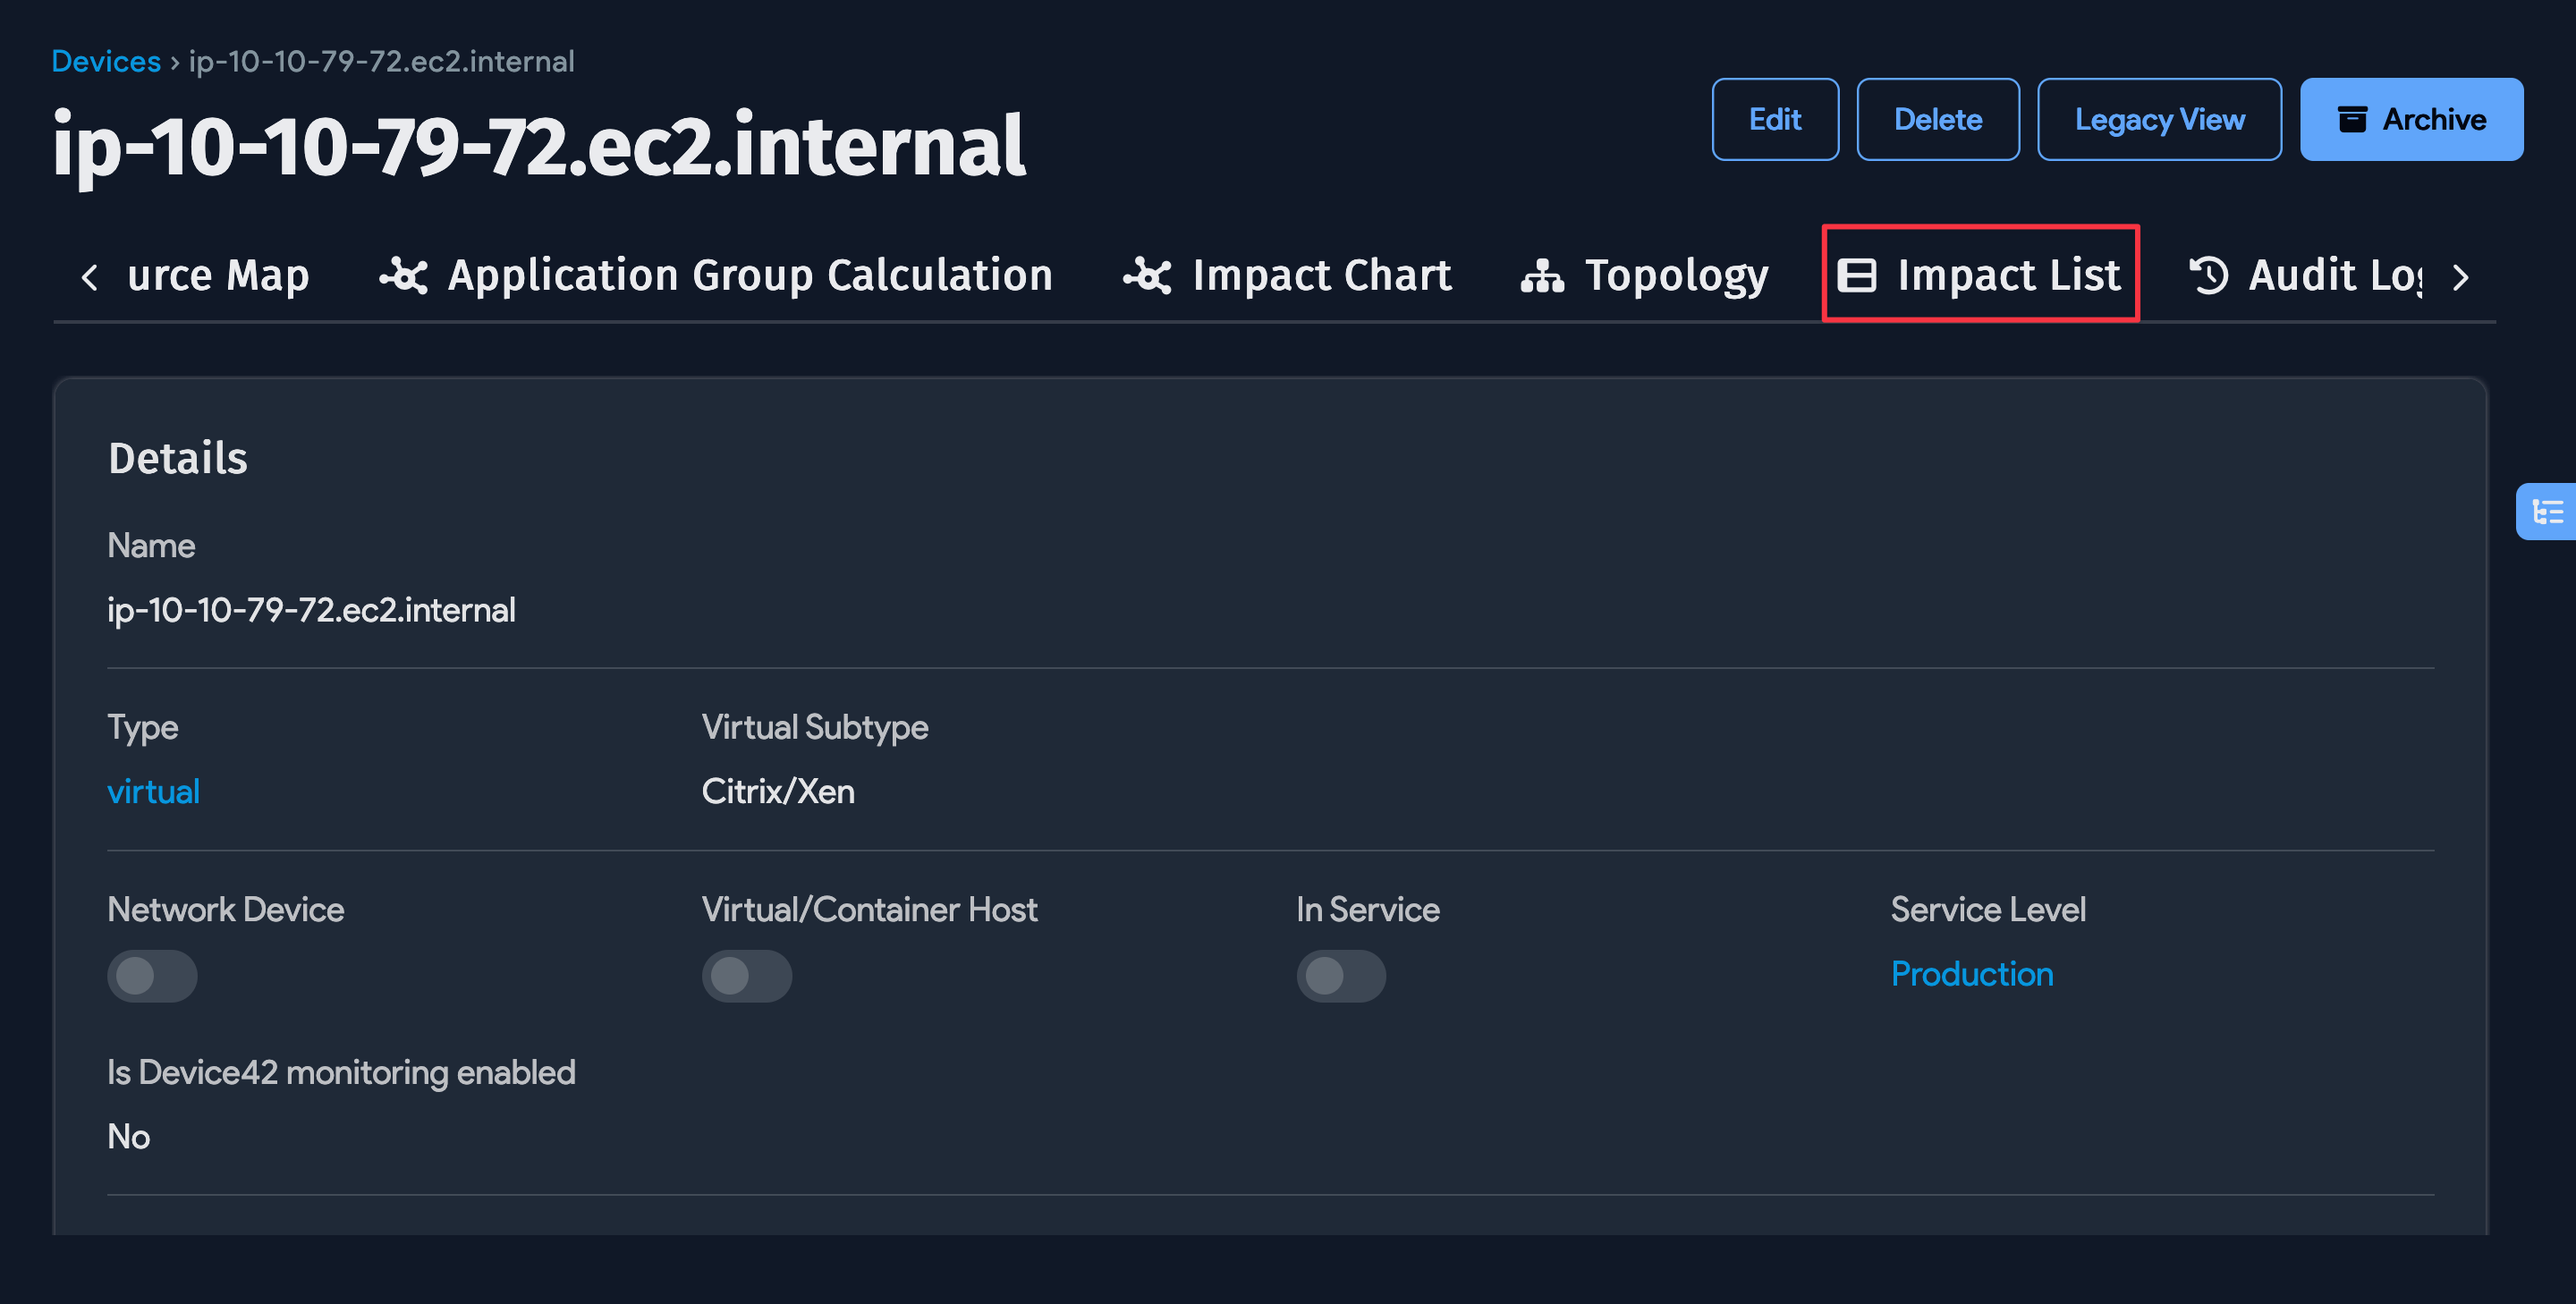
Impact Lists
Clicking the Impact List navigation button will bring you to a hierarchical and contextual text-based view of the topology. All of the same objects and behavior are included in the impact list, and you can expand a configuration item to view related and nested items.
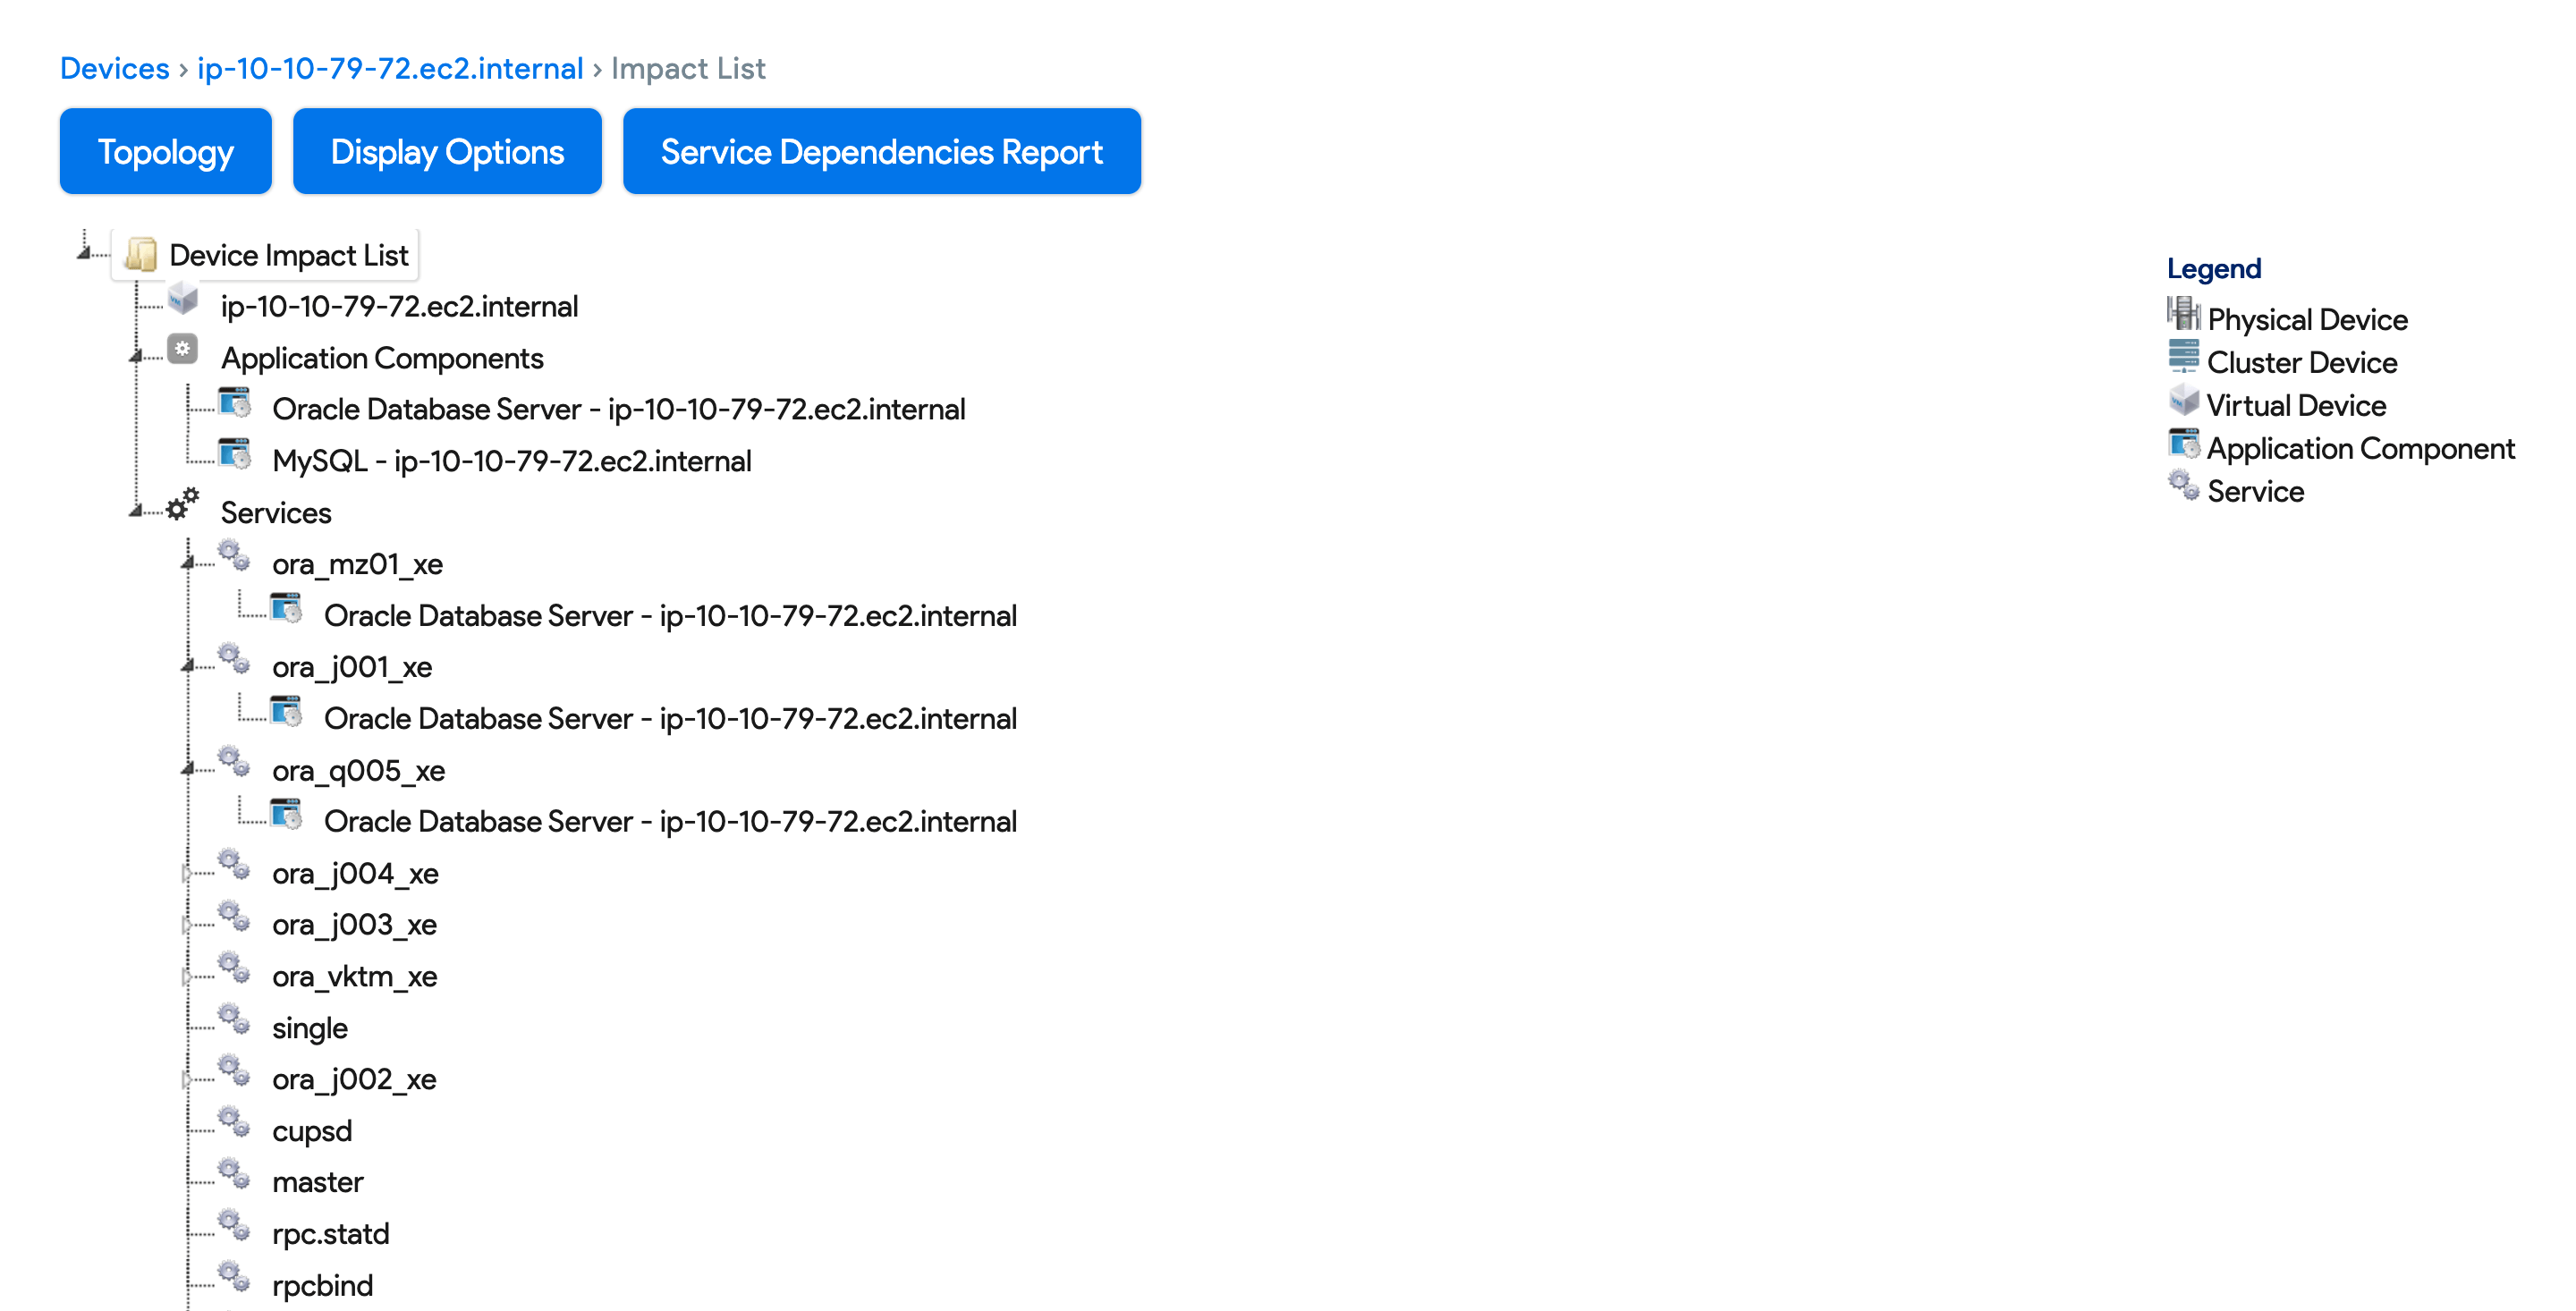
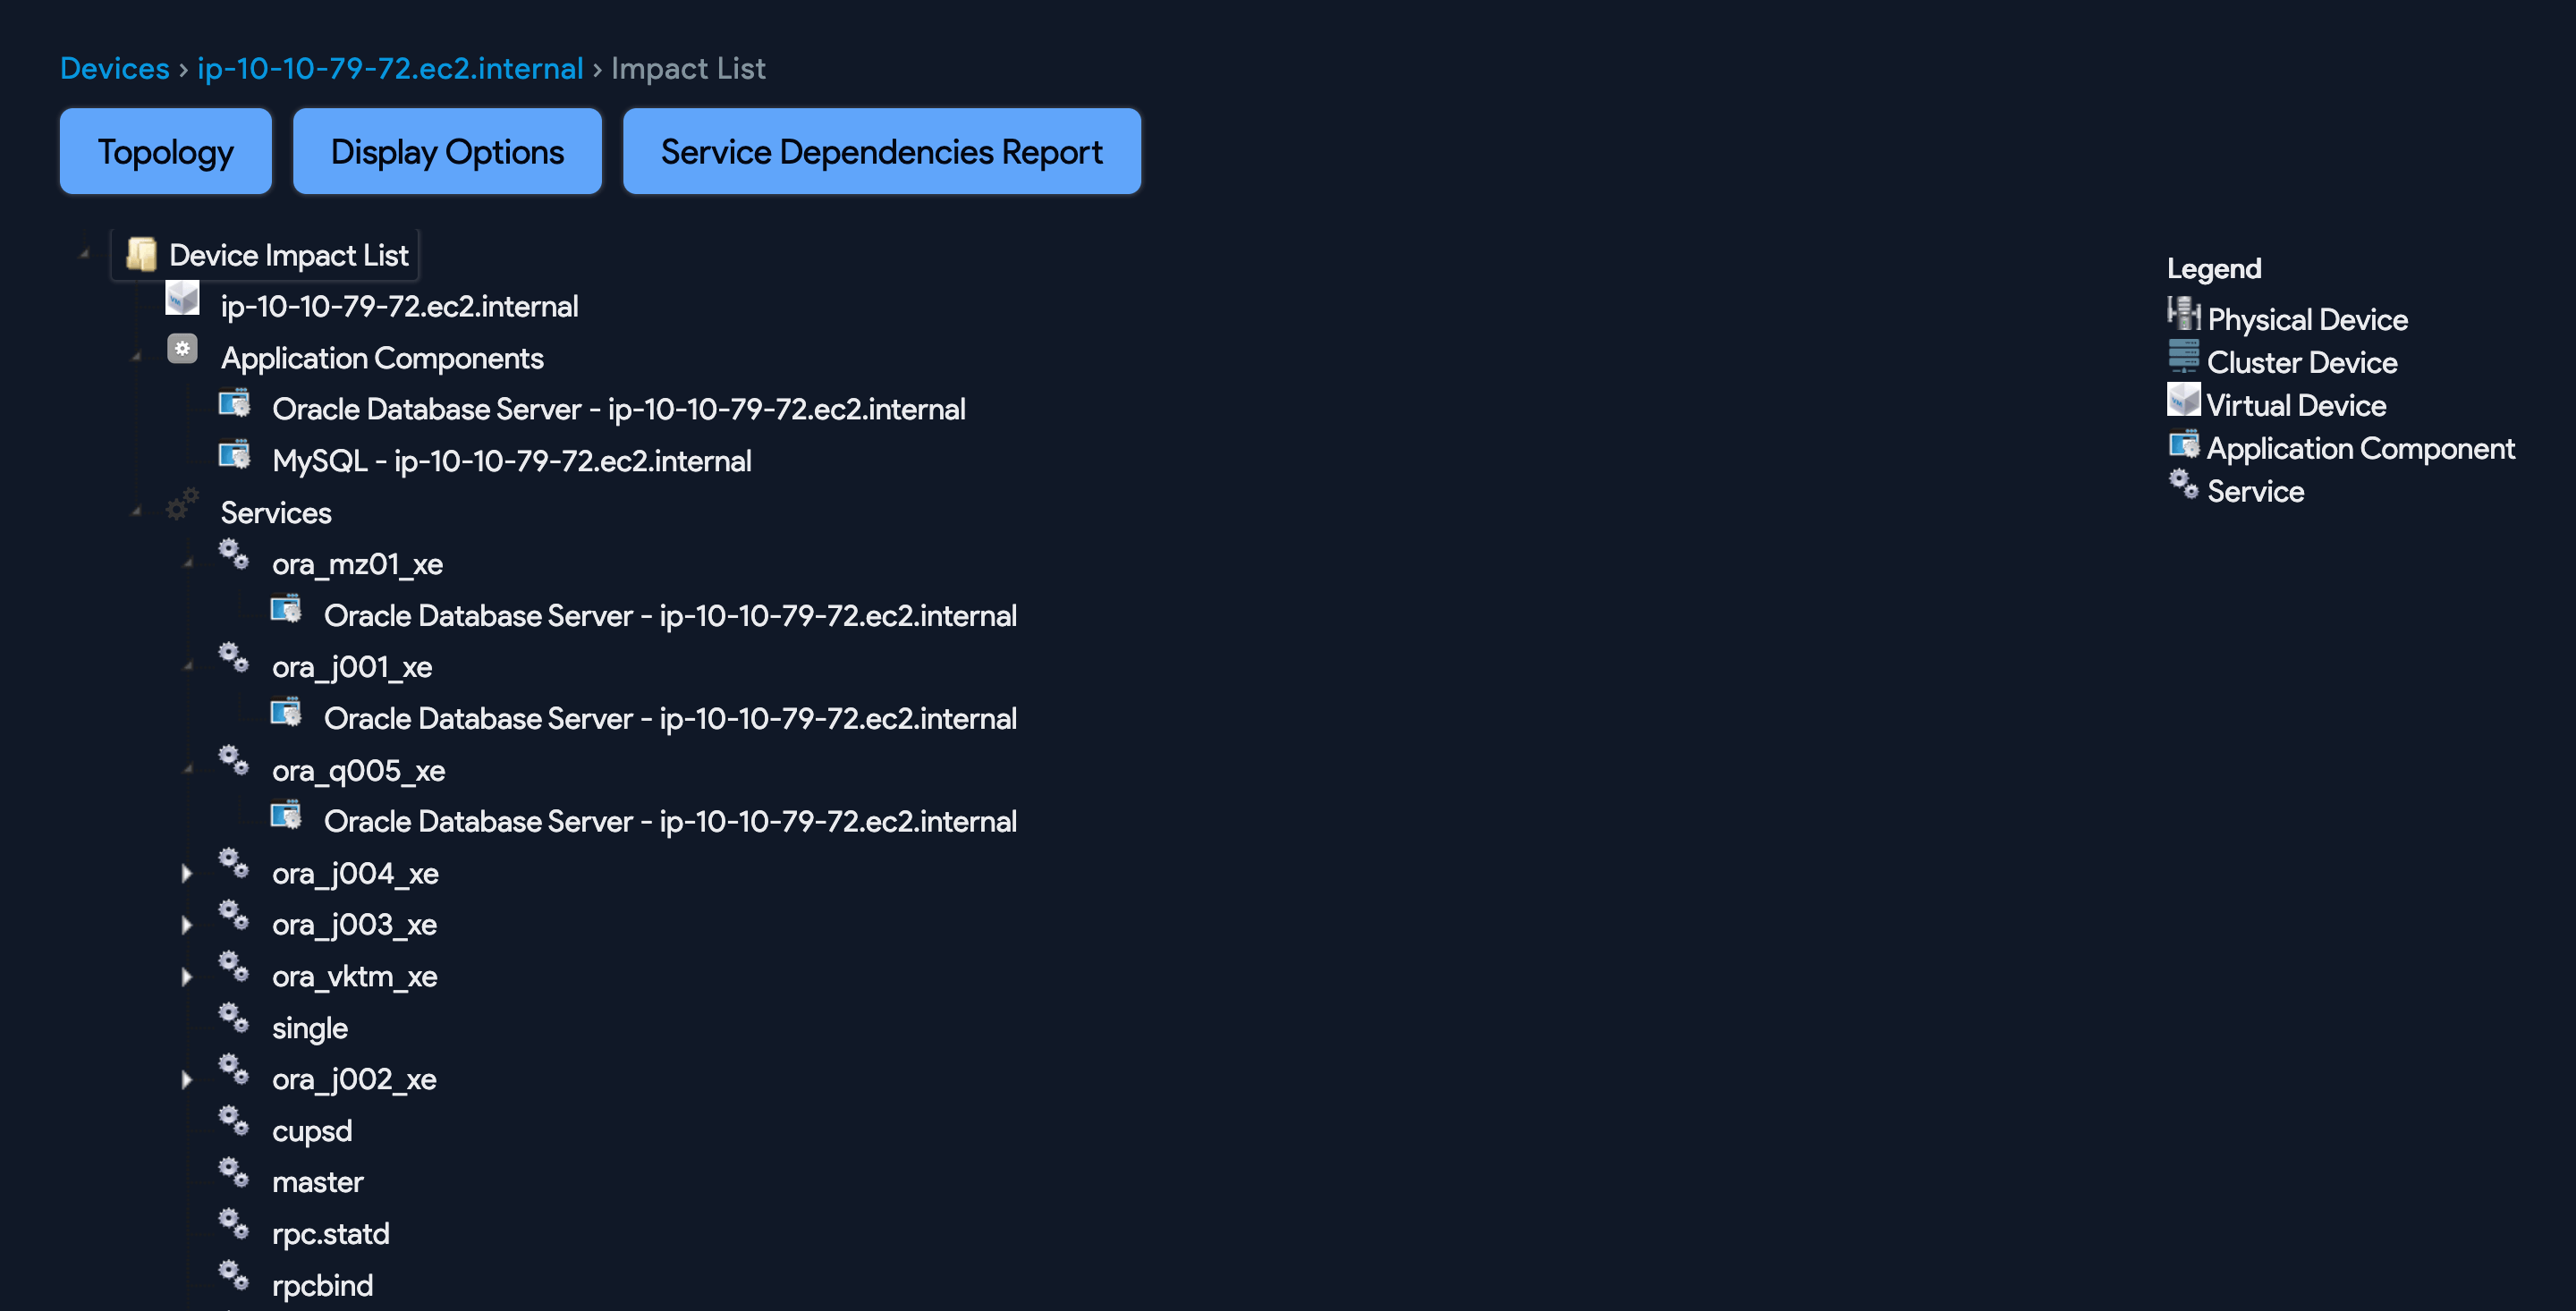
An impact list is simply a list version of an impact graph. Impact lists are typically available for most devices. The following is an example of an impact list for a device:
The full impact list for a device. Sometimes, it is useful to hide services without connections, which significantly reduces clutter by hiding services you may not be concerned with (many services that fit this criteria are standard operating-system components). See the example following the full list for more details:
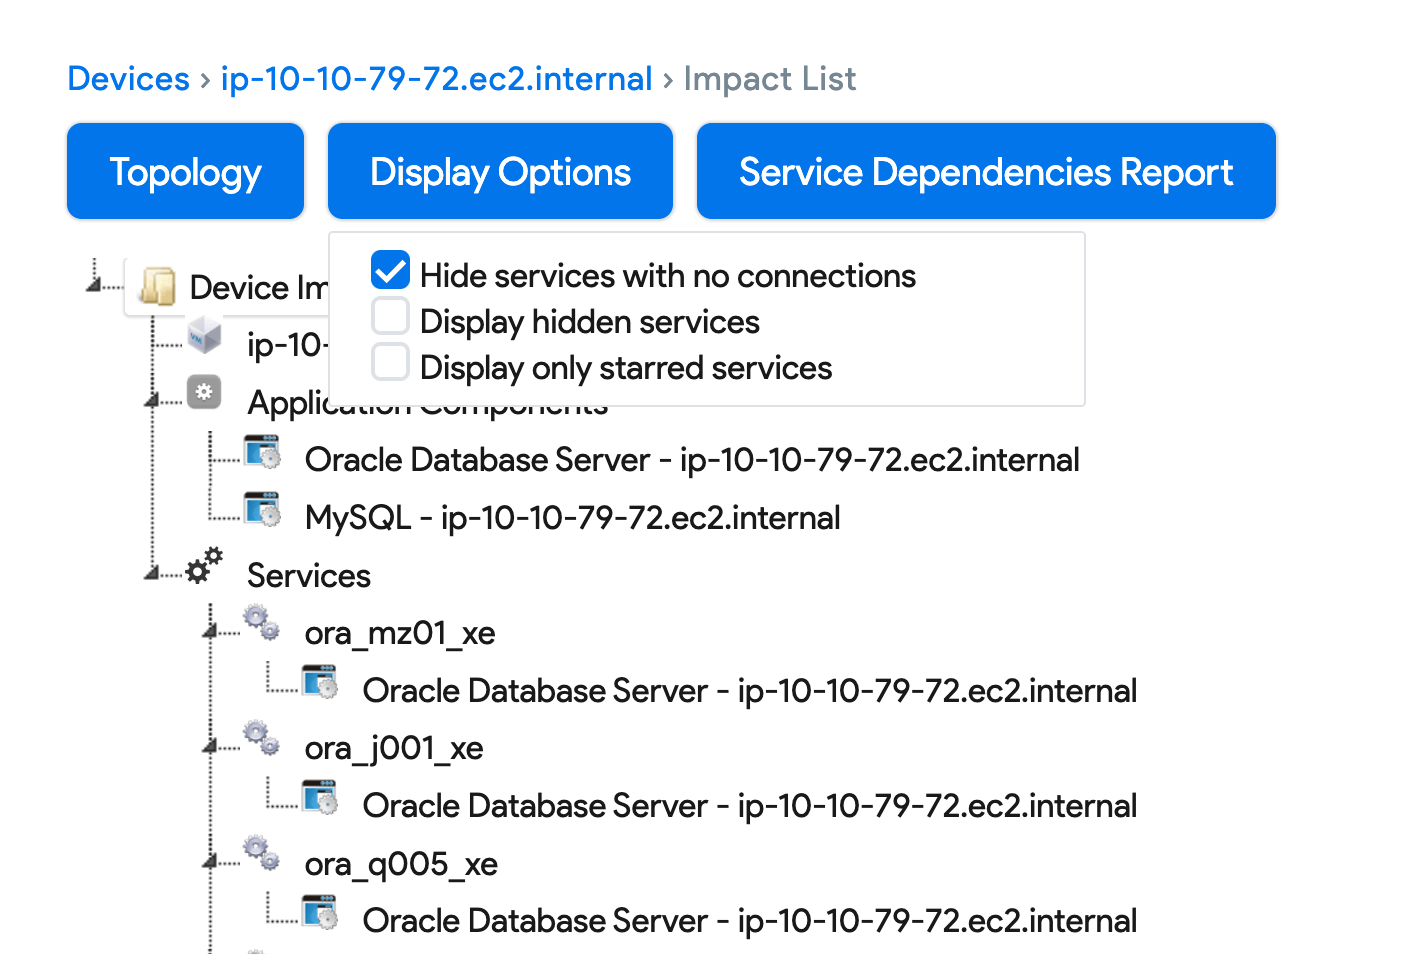
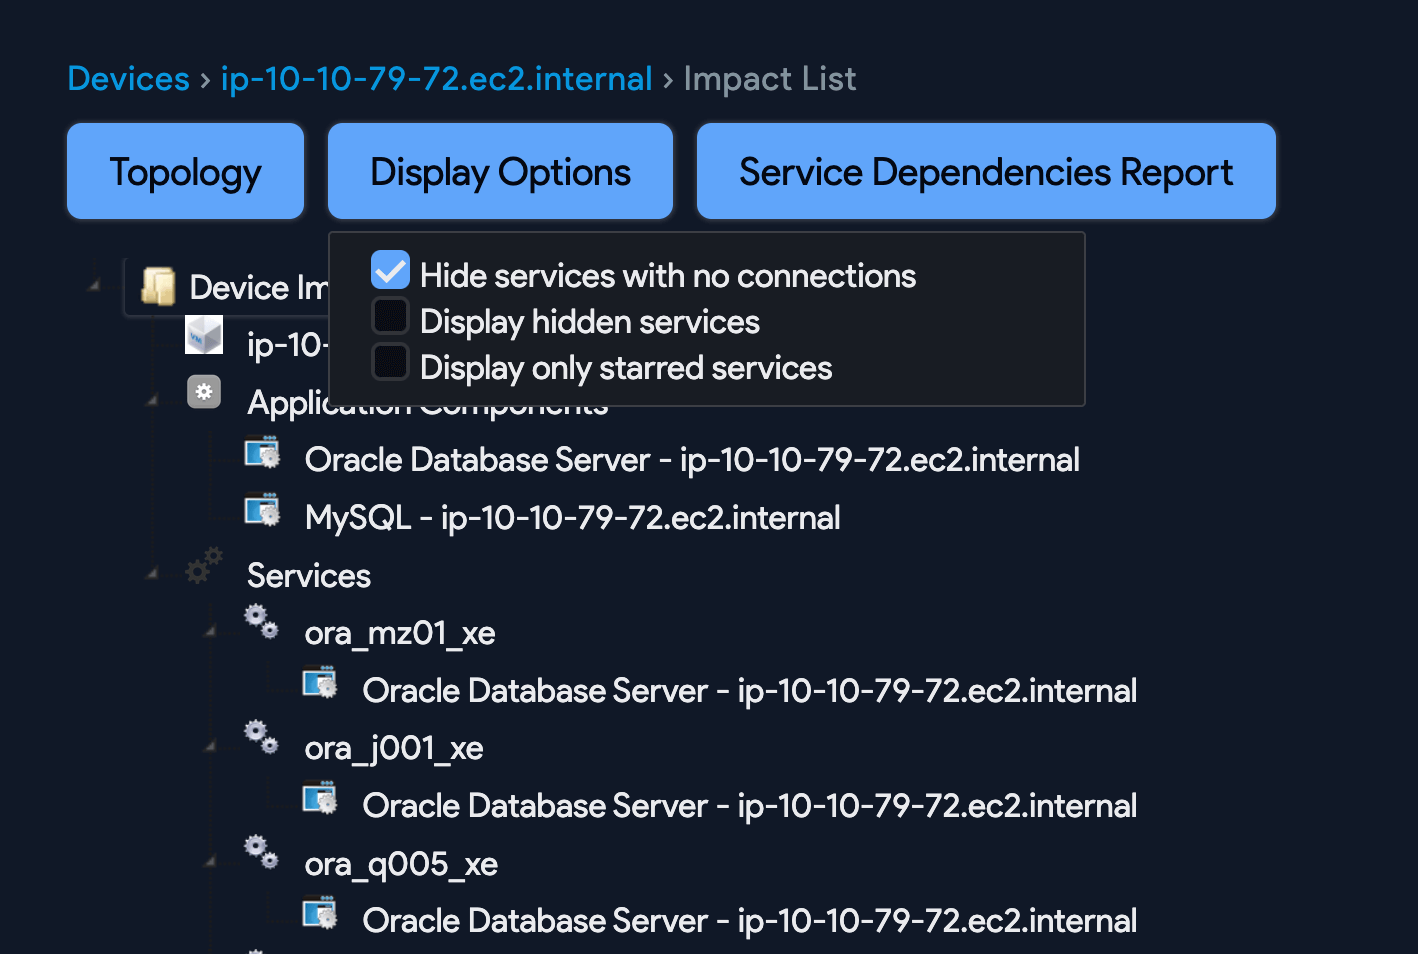
Impact List Display Options
The Display Options allow you to hide of services without connections, to forcibly display hidden services, or even to show only the services you've starred:
Service Dependencies Reports
Service dependencies reports can be downloaded via buttons on impact lists and topology charts. Service dependency reports are delivered as Excel files (.XLSX), and each contain a list of all source machines, listening ports, and services, as well as any remote machines that are connected to those services.

Field Definitions
- Listener name: Listener hostname
- Listener IP: Listening IP address
- All listener device IPs: Discovered IP addresses
- Listener service: Listener service found
- Listener port: Port listener found on
- Listener OS: Listener operating system
- Listener is Virtual: Yes or no - Is listener a VM?
- Client Listener Hardware: Listener hardware type
- Client name: Client hostname
- Client Service: Service name
- Client OS: Client operating system
- Client is virtual: Yes or no - Is client a VM?
- Client Hardware: Client hardware type
- Client Stat Type: Netstat or netflow - Which was discovered?
- Client Connection First Found: Date or time
- Client Connection Last Found: Date or time
- Total Client Connections Detected: Running total count - since first found
- Detected Average Minutes Between Client Connections: Time, in minutes, since last connection(s) found
- Average # of Connections from the client: Running average of connections found since first found
- Latest detected # of Connections from the client: Integer count of # of connections found as of last check
- Latest contiguous stats - Client connection First Found: Date or time when this stat was first found, if the connection is different (different ports connected than connected from last discovery)
- Latest contiguous stats - Client connection Last Found: Date or time when this stat was last rediscovered (if the connection is different, or different ports connected than were connected when last discovered)
- Latest contiguous stats - Total Client connections Detected: Count; only includes connections found during latest (different ports connected from last discovery)
- Latest contiguous stats - Detected Average Minutes Between client connections: Time in minutes; only goes from latest (different ports connected from last discovery)
Dependency Charts (Graphs)
A dependency chart (previously a 'dependency graph') can also be generated for any Application Component, and will show all the devices, services, executables, and application components that the application component requires to function. A sample dependency chart for a database application is shown below:
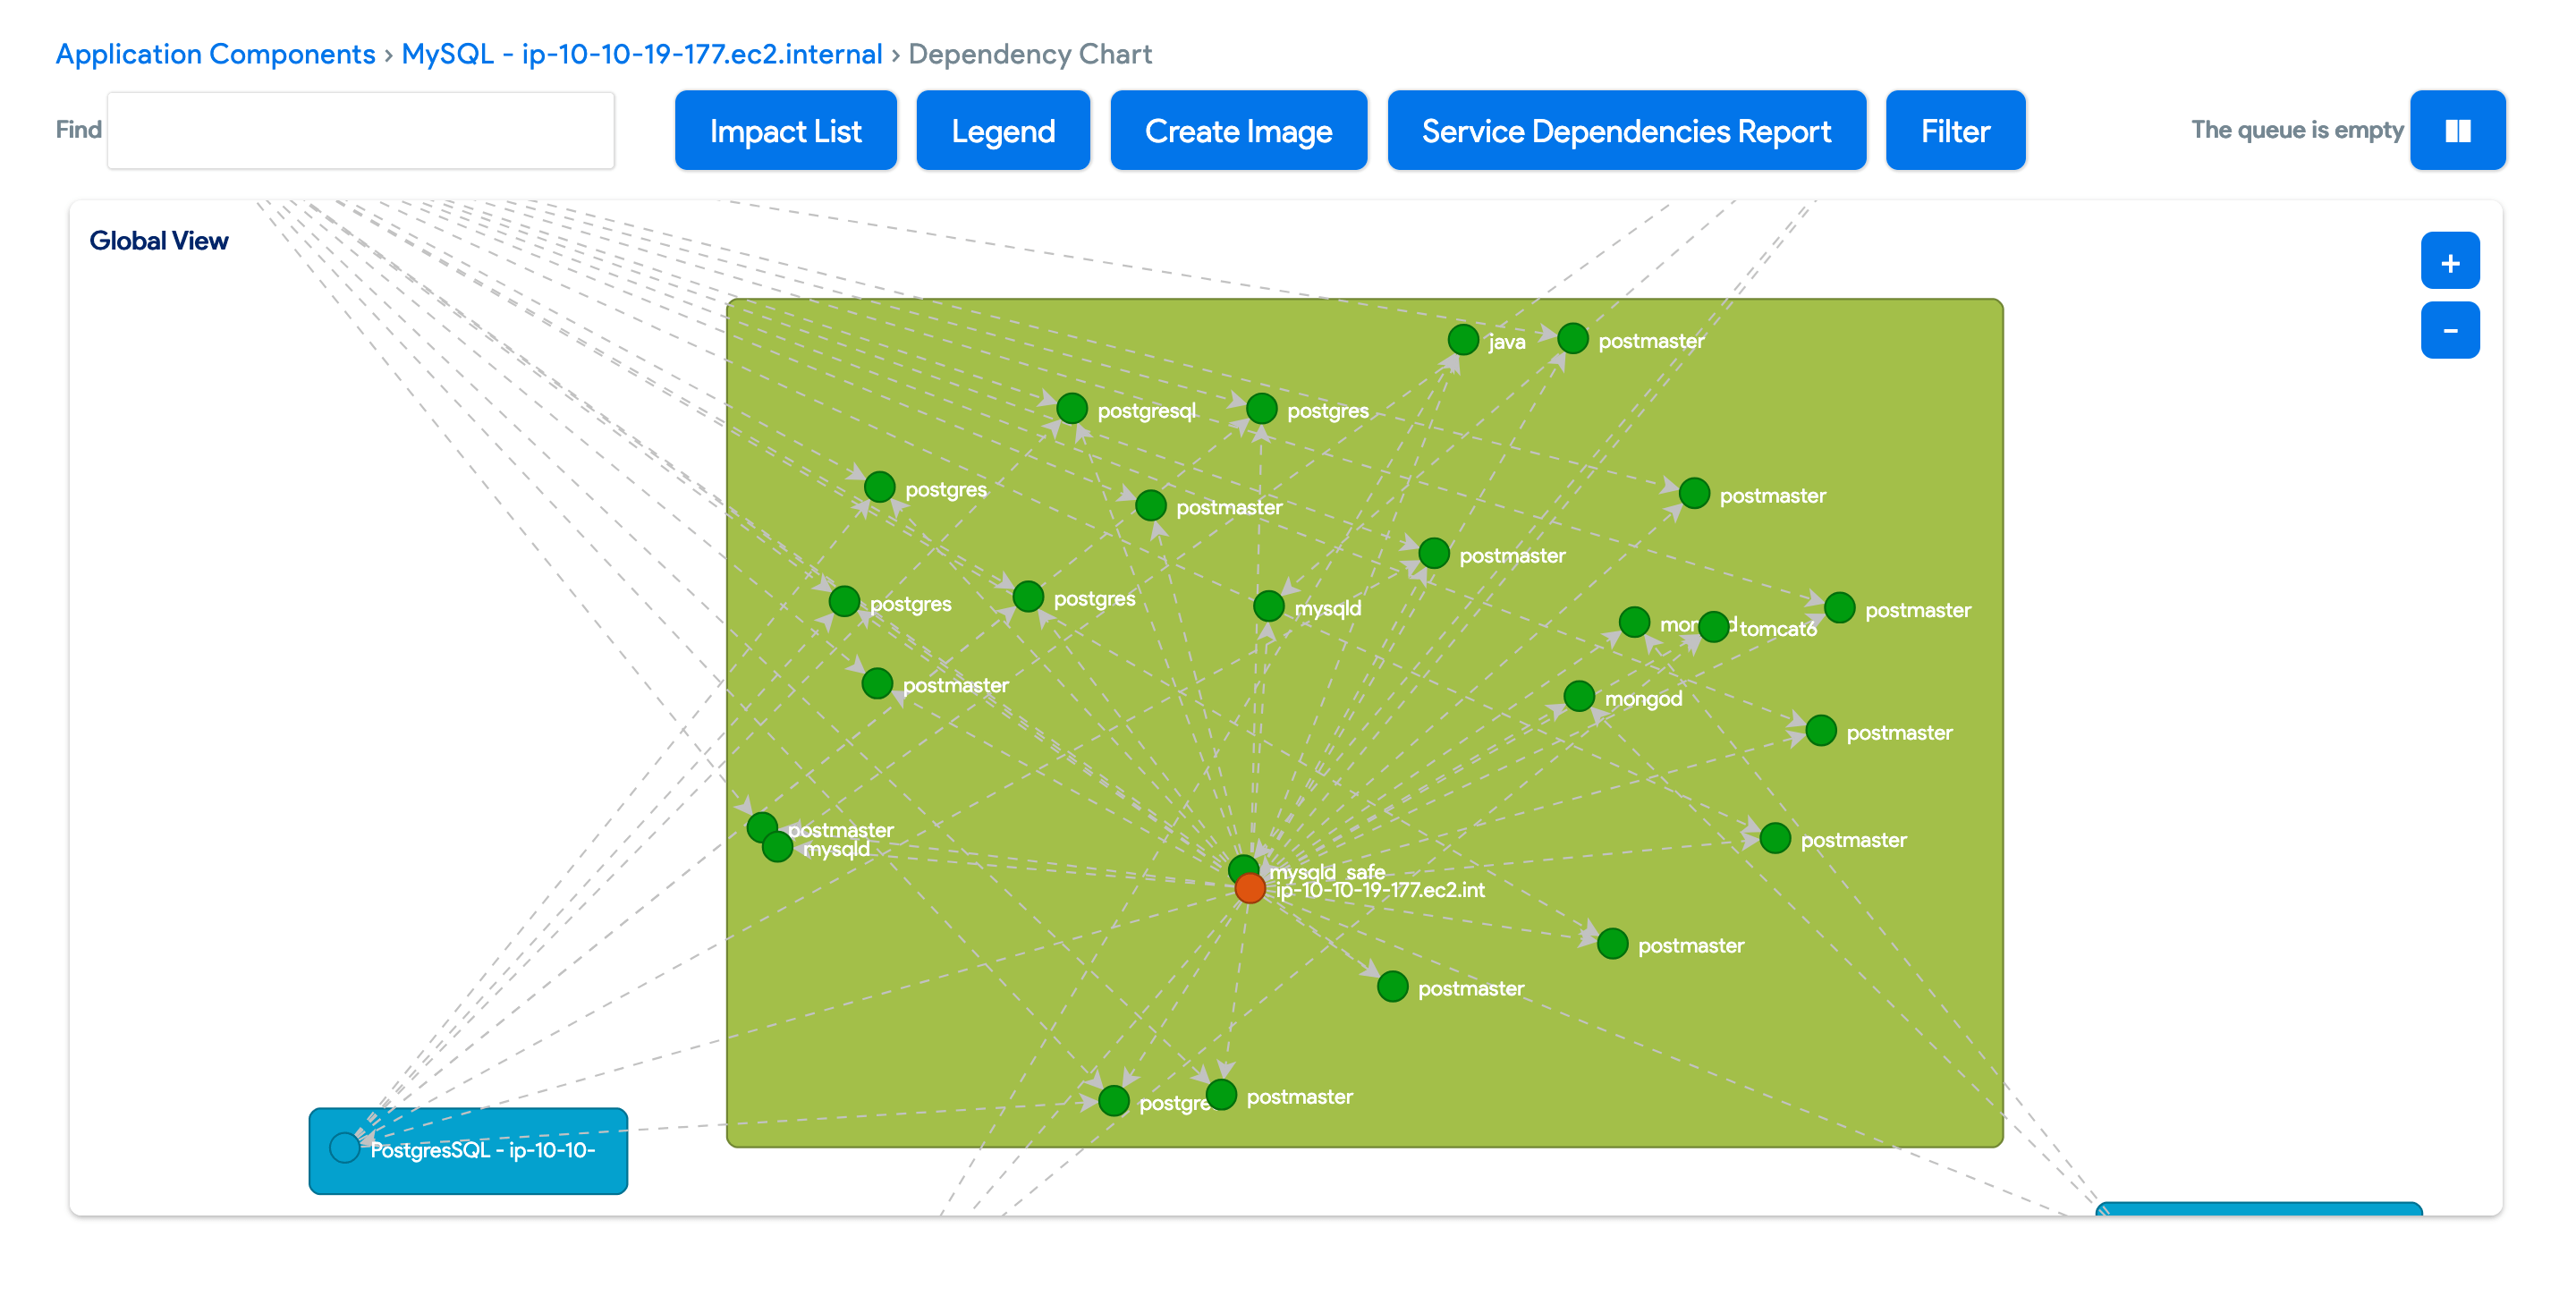
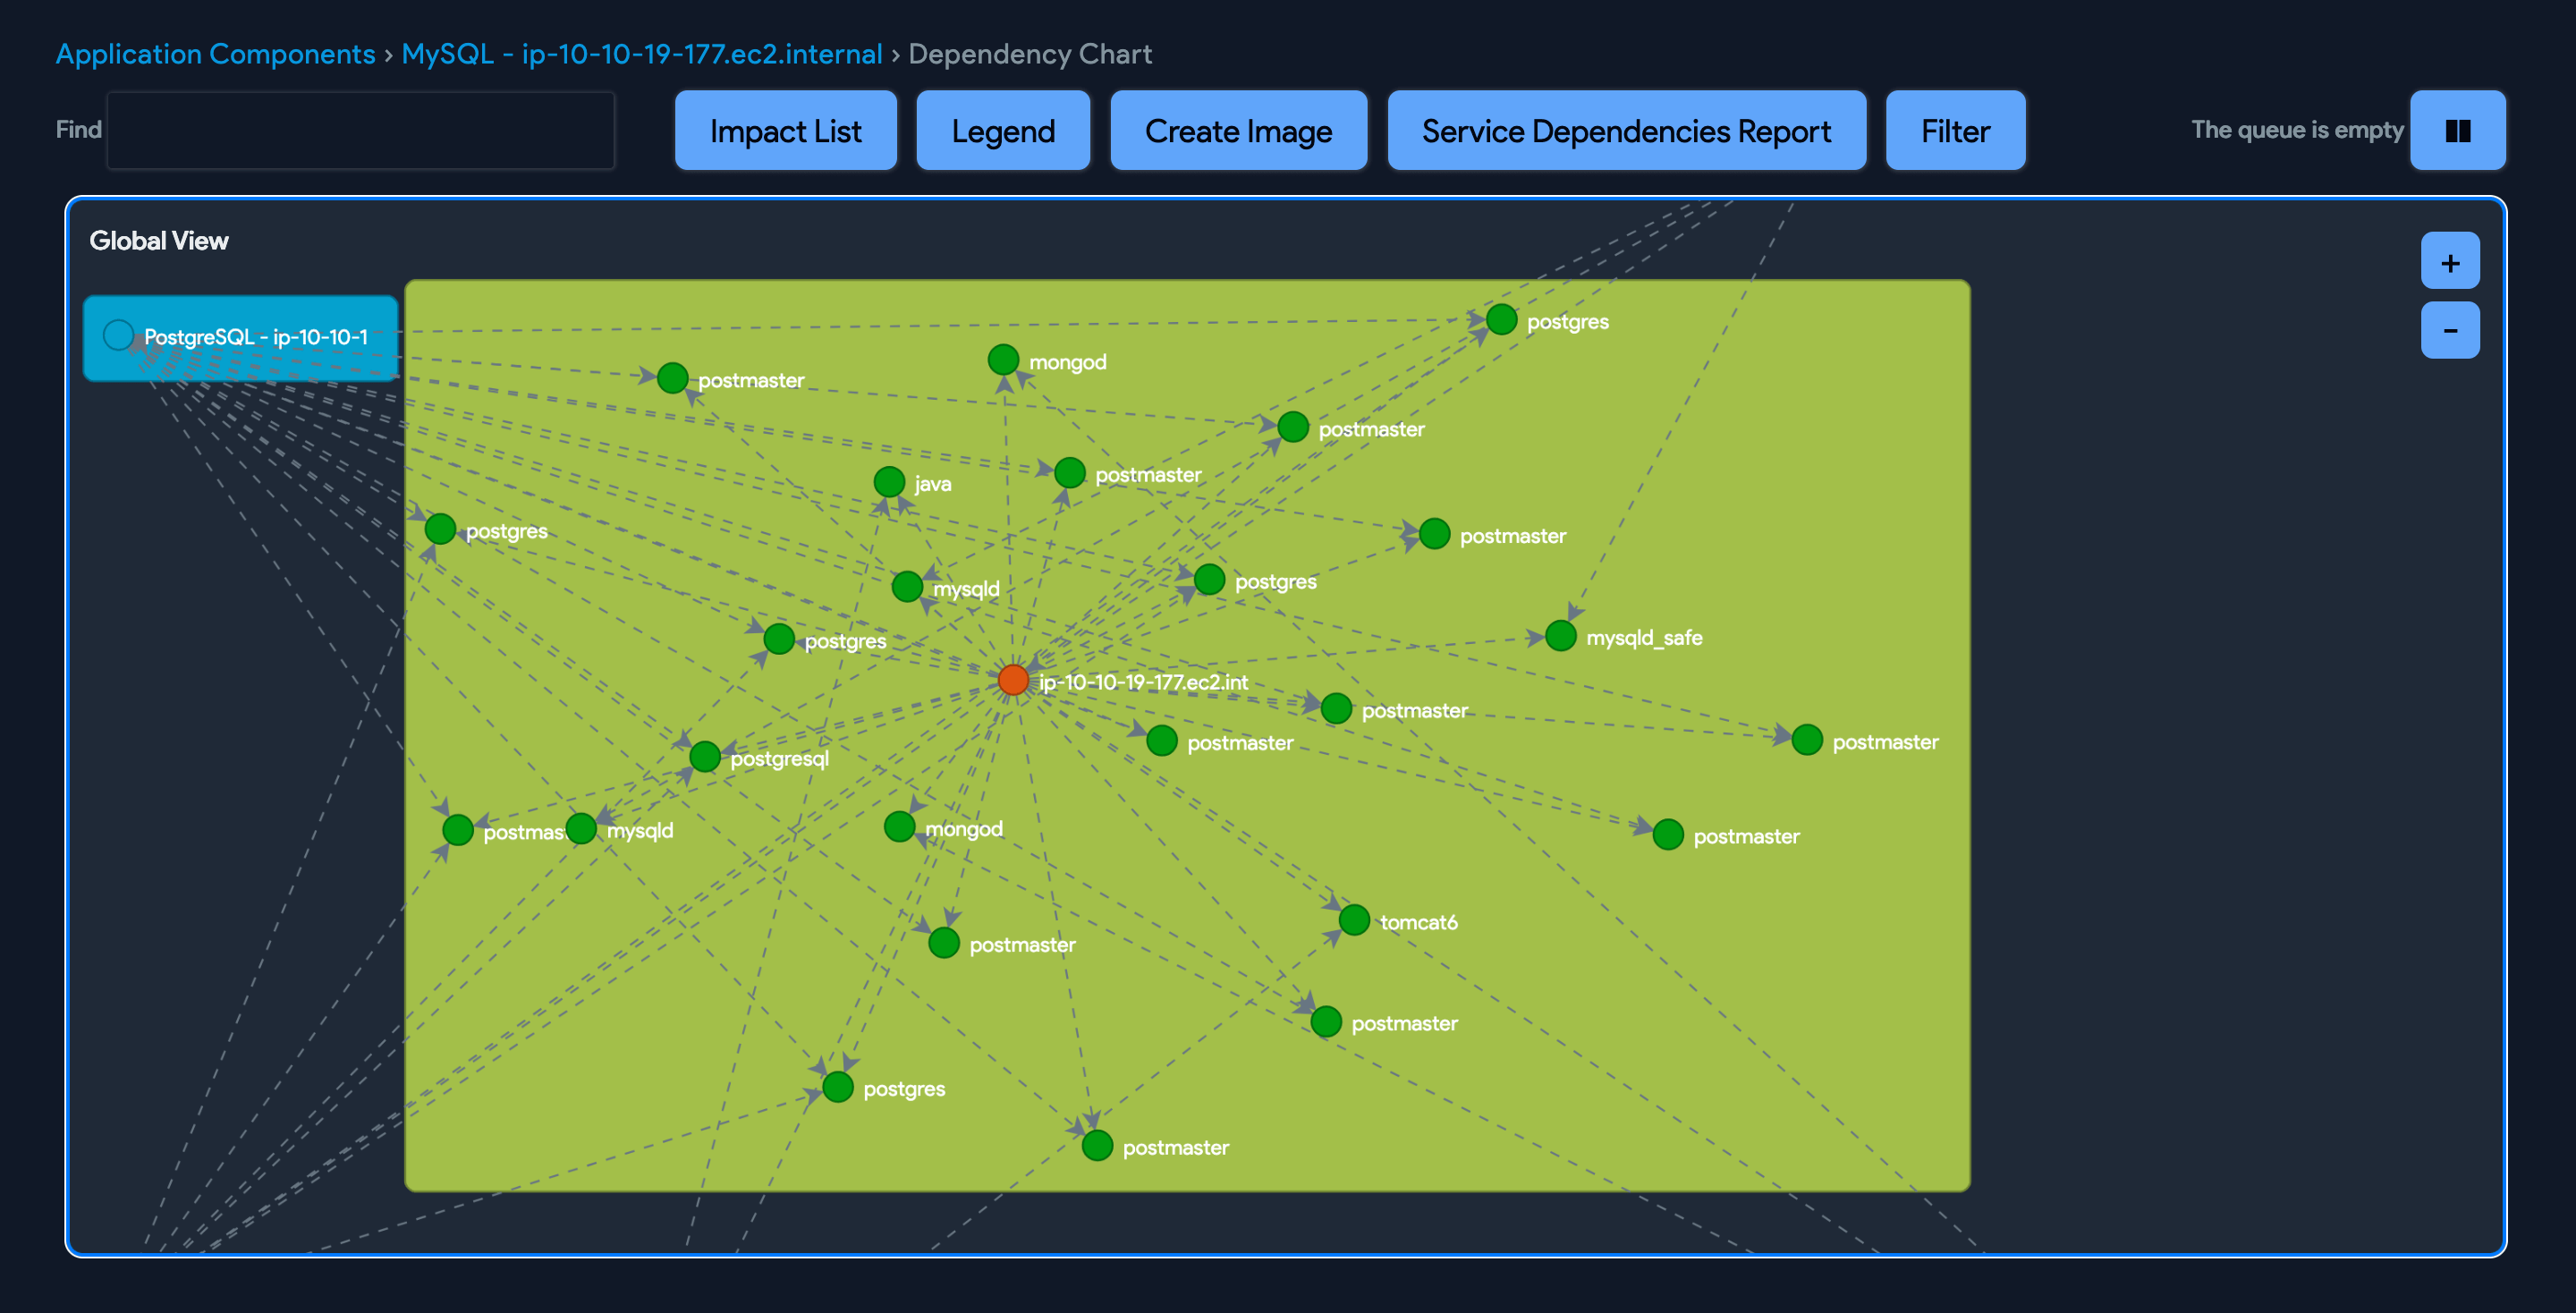
How Are Dependencies Created in Device42?
One question that comes up in almost every demo is, "How are all these dependencies created?" Nearly all the dependencies you saw in the above charts were automatically created by autodiscovery in combination with internal Device42 correlation processes.
It should be fairly obvious how all the physical dependencies are created: buildings have rooms, which have racks, which have devices. The blades in a chassis are dependent on their blade host, while virtual machines (VMs) are dependent on their virtual host(s).
Software and services that are discovered on a virtual or physical machine are dependent on that machine. Many of the service-to-service dependencies or software are autodiscovered.
Only some application components need to be manually entered. If a service is defined to be an application component, then the application component dependencies are all known.
You may, however, want to define application components that are not tied to a service or that are composed of multiple services. These application components and their dependencies can be defined through forms, spreadsheets imports, or API calls.
The Device42 Main Appliance in conjunction with the WDS (Windows discovery service) performs autodiscoveries. You can exclude servers, remote IP addresses, and even service ports to reduce the noise by limiting discovery to only things you care to see. Example exclusions might be:
- Windows listening ports: Port 3389 is excluded by default.
- Windows remote ports: Add any remote ports you want to exclude.
- Linux listening ports: Port 22 (SSH) is excluded by default.
- Linux remote ports: Add any remote ports you want to exclude.
- Remote IP Addresses: Exclude remote IPs, like your monitoring server IPs.