Buildings and Rooms
From the main menu, navigate to the Buildings list page under Infrastructure > DataCenter > Buildings to view and enter information about the buildings that house your data centers. In Device42, a room is part of a building. You can add rooms, racks, and other asset details to a building's information.
Users with the necessary permissions can access the Room Layout View to see how the room layout represents a room and its objects.
Buildings List Page
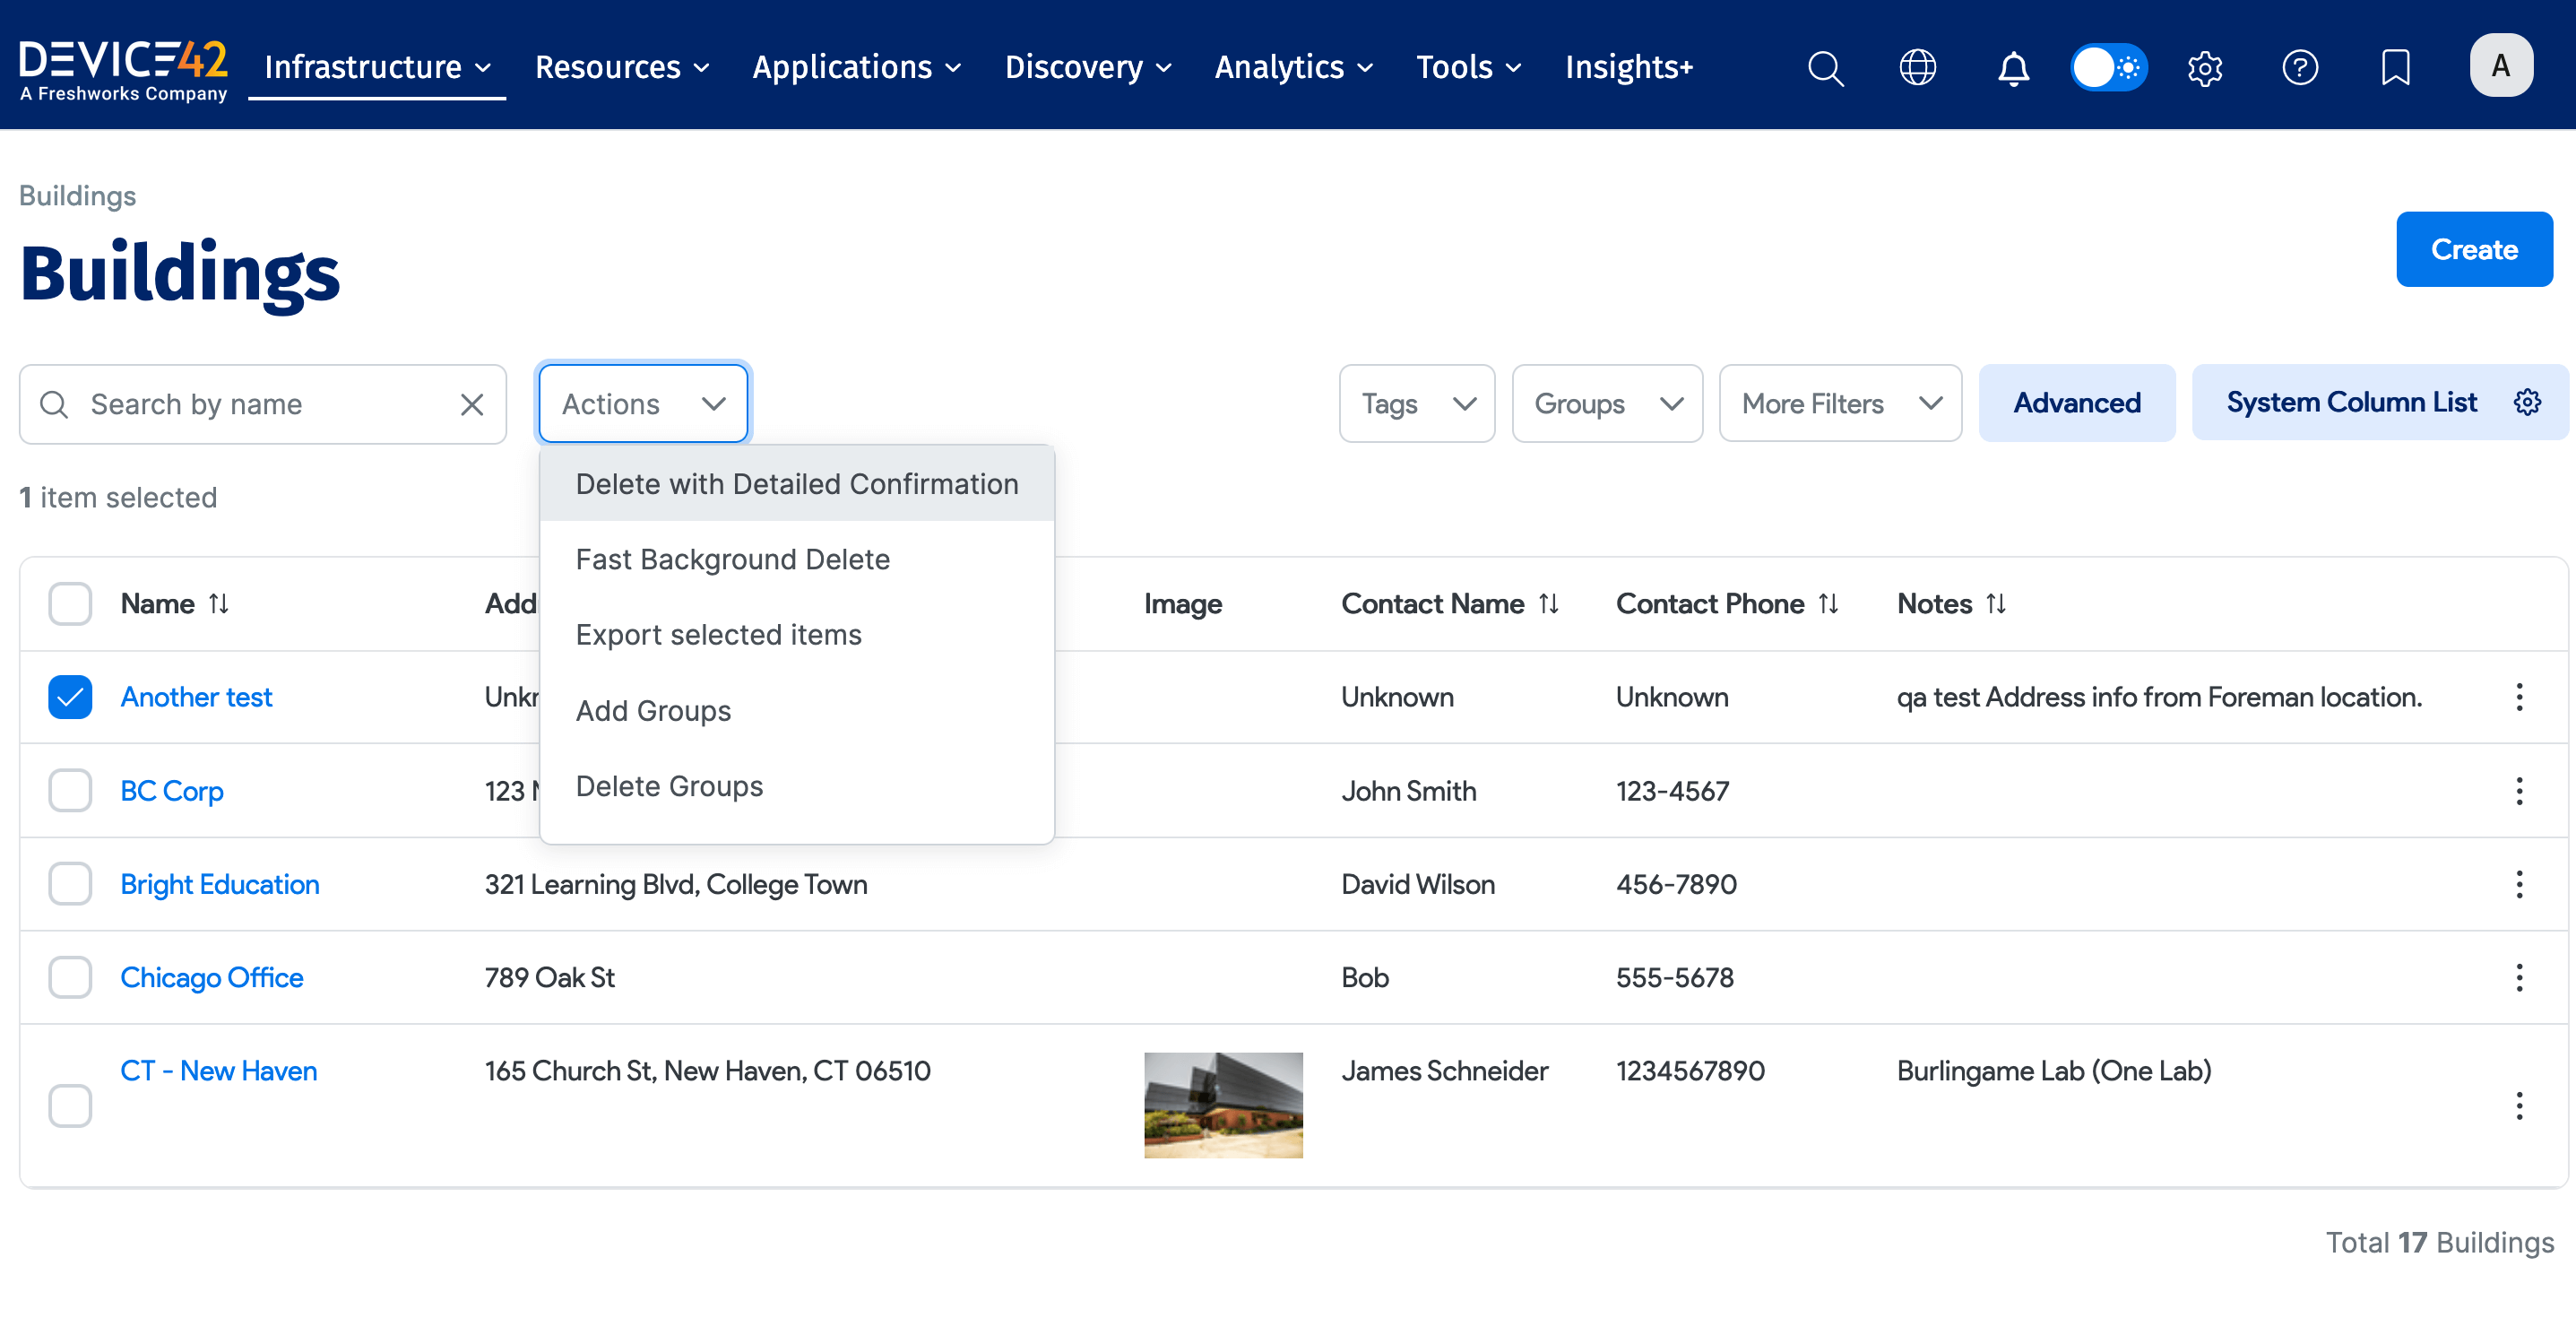
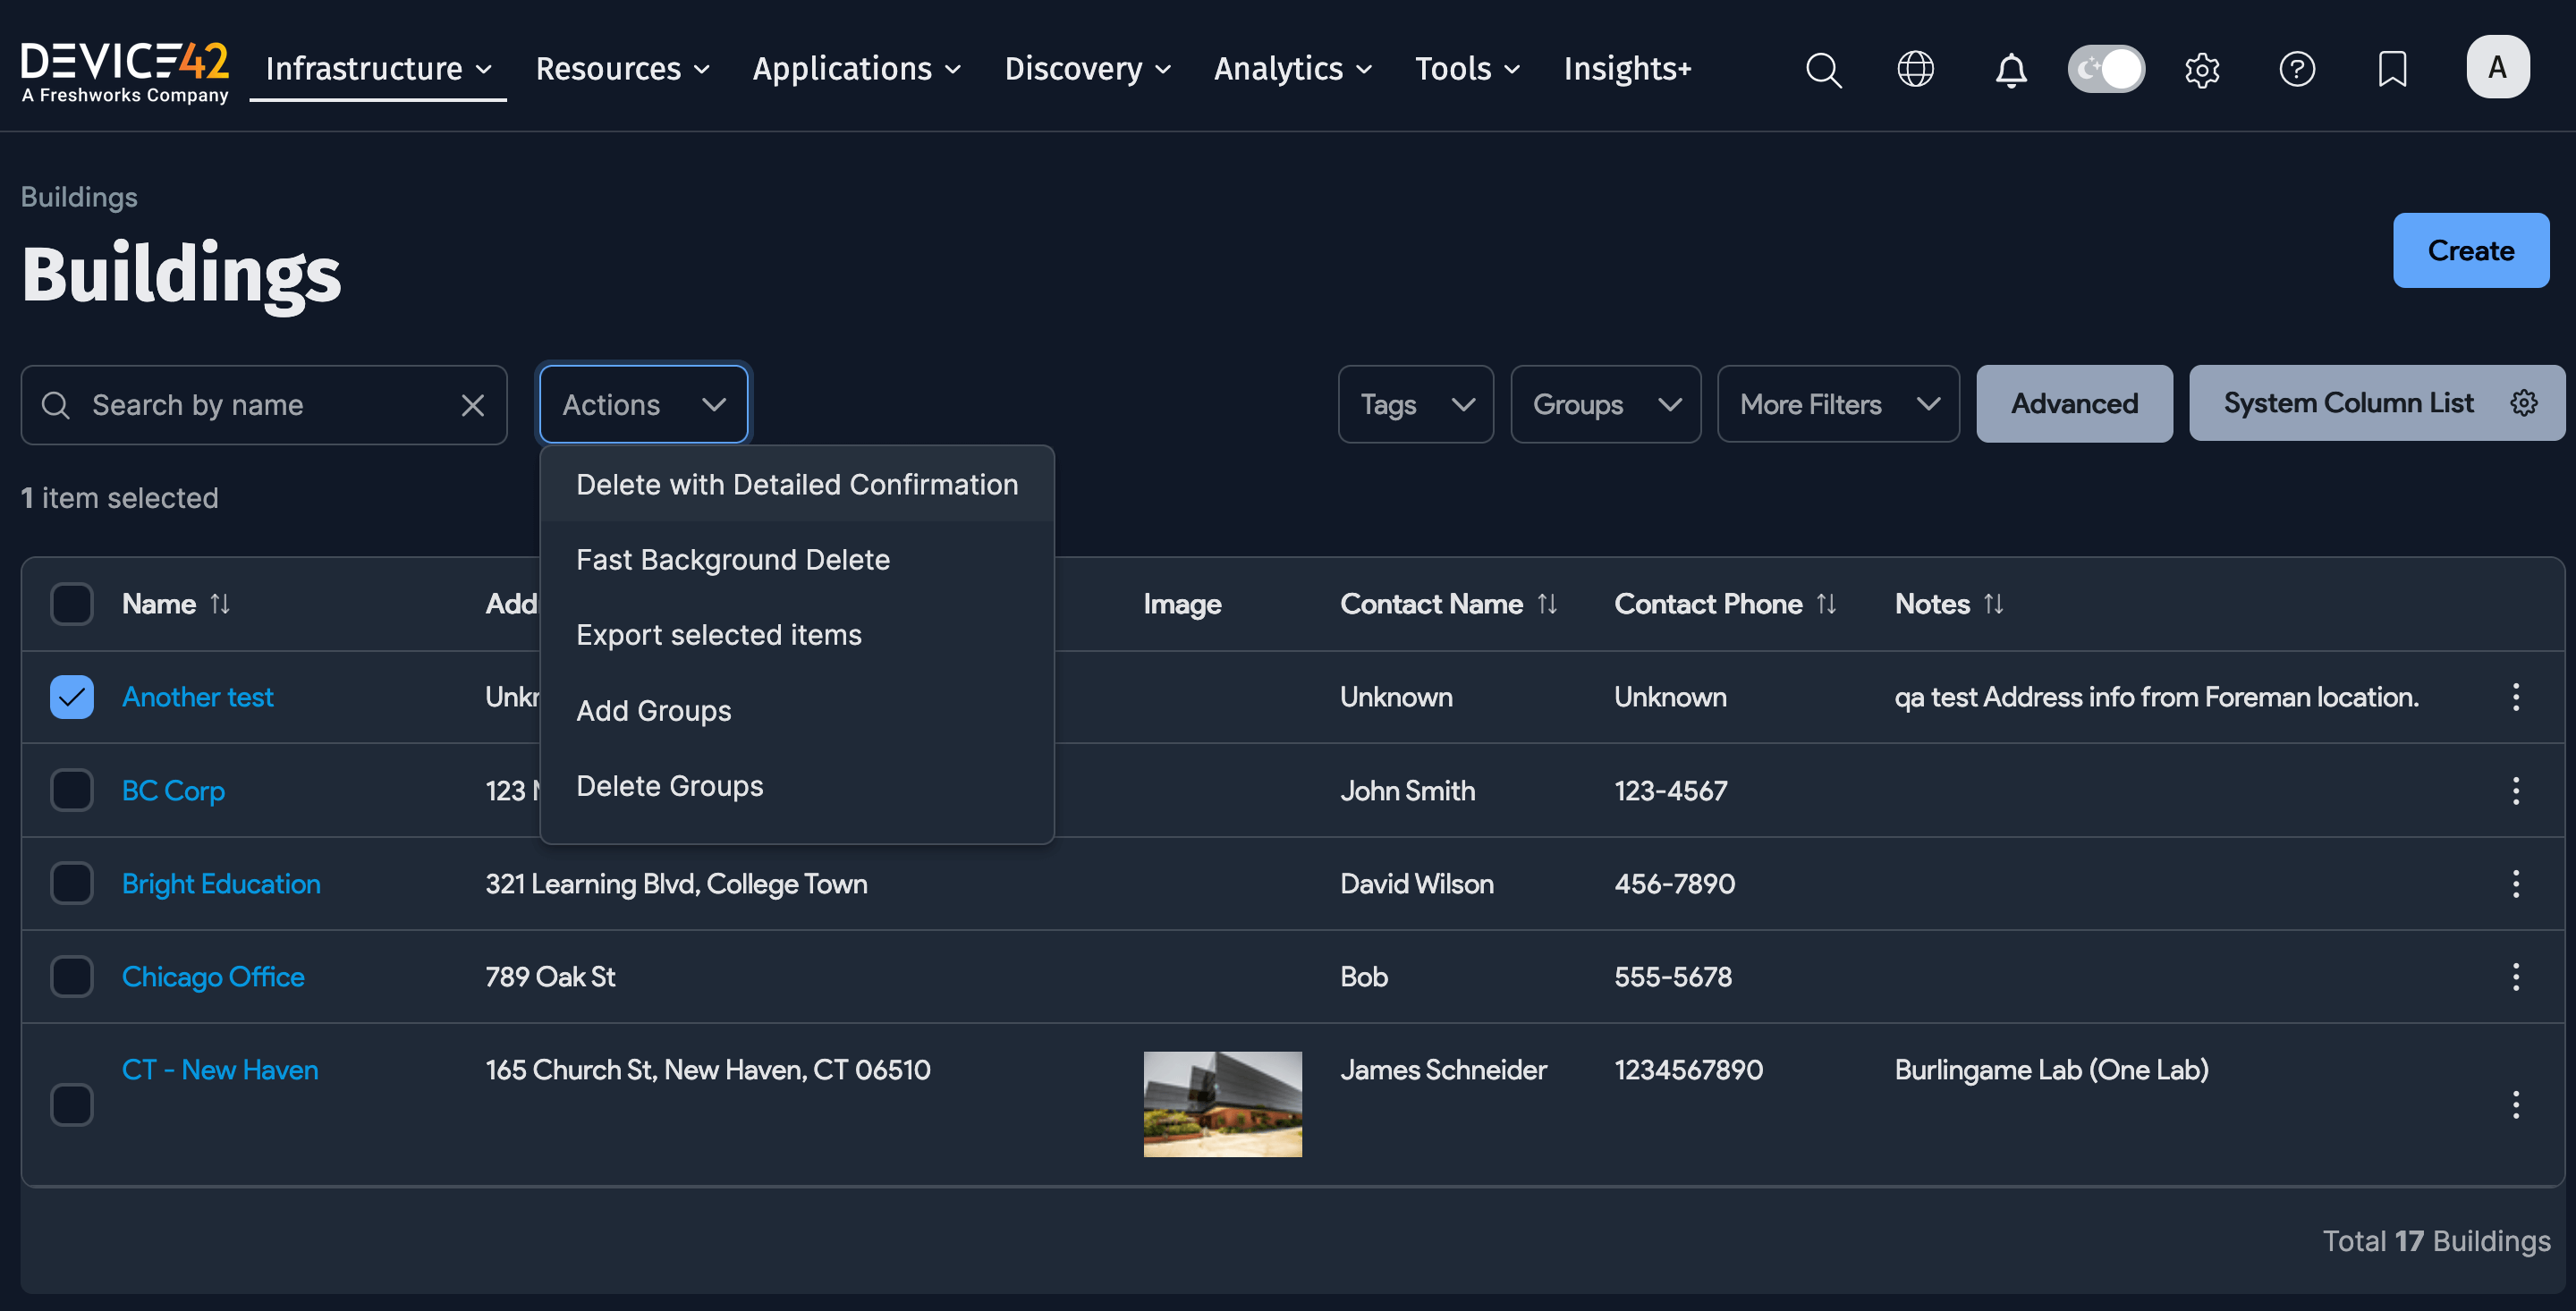
You can view, edit, and Create new buildings from the Buildings list page, as well as perform bulk and individual Actions on selected buildings.
To narrow down the list of buildings, filter it using the Tags, Groups, and More Filters dropdown menus above the grid.
You can add an image, like a floor plan or photo, to a building and view the image from the list page.
View Building Details
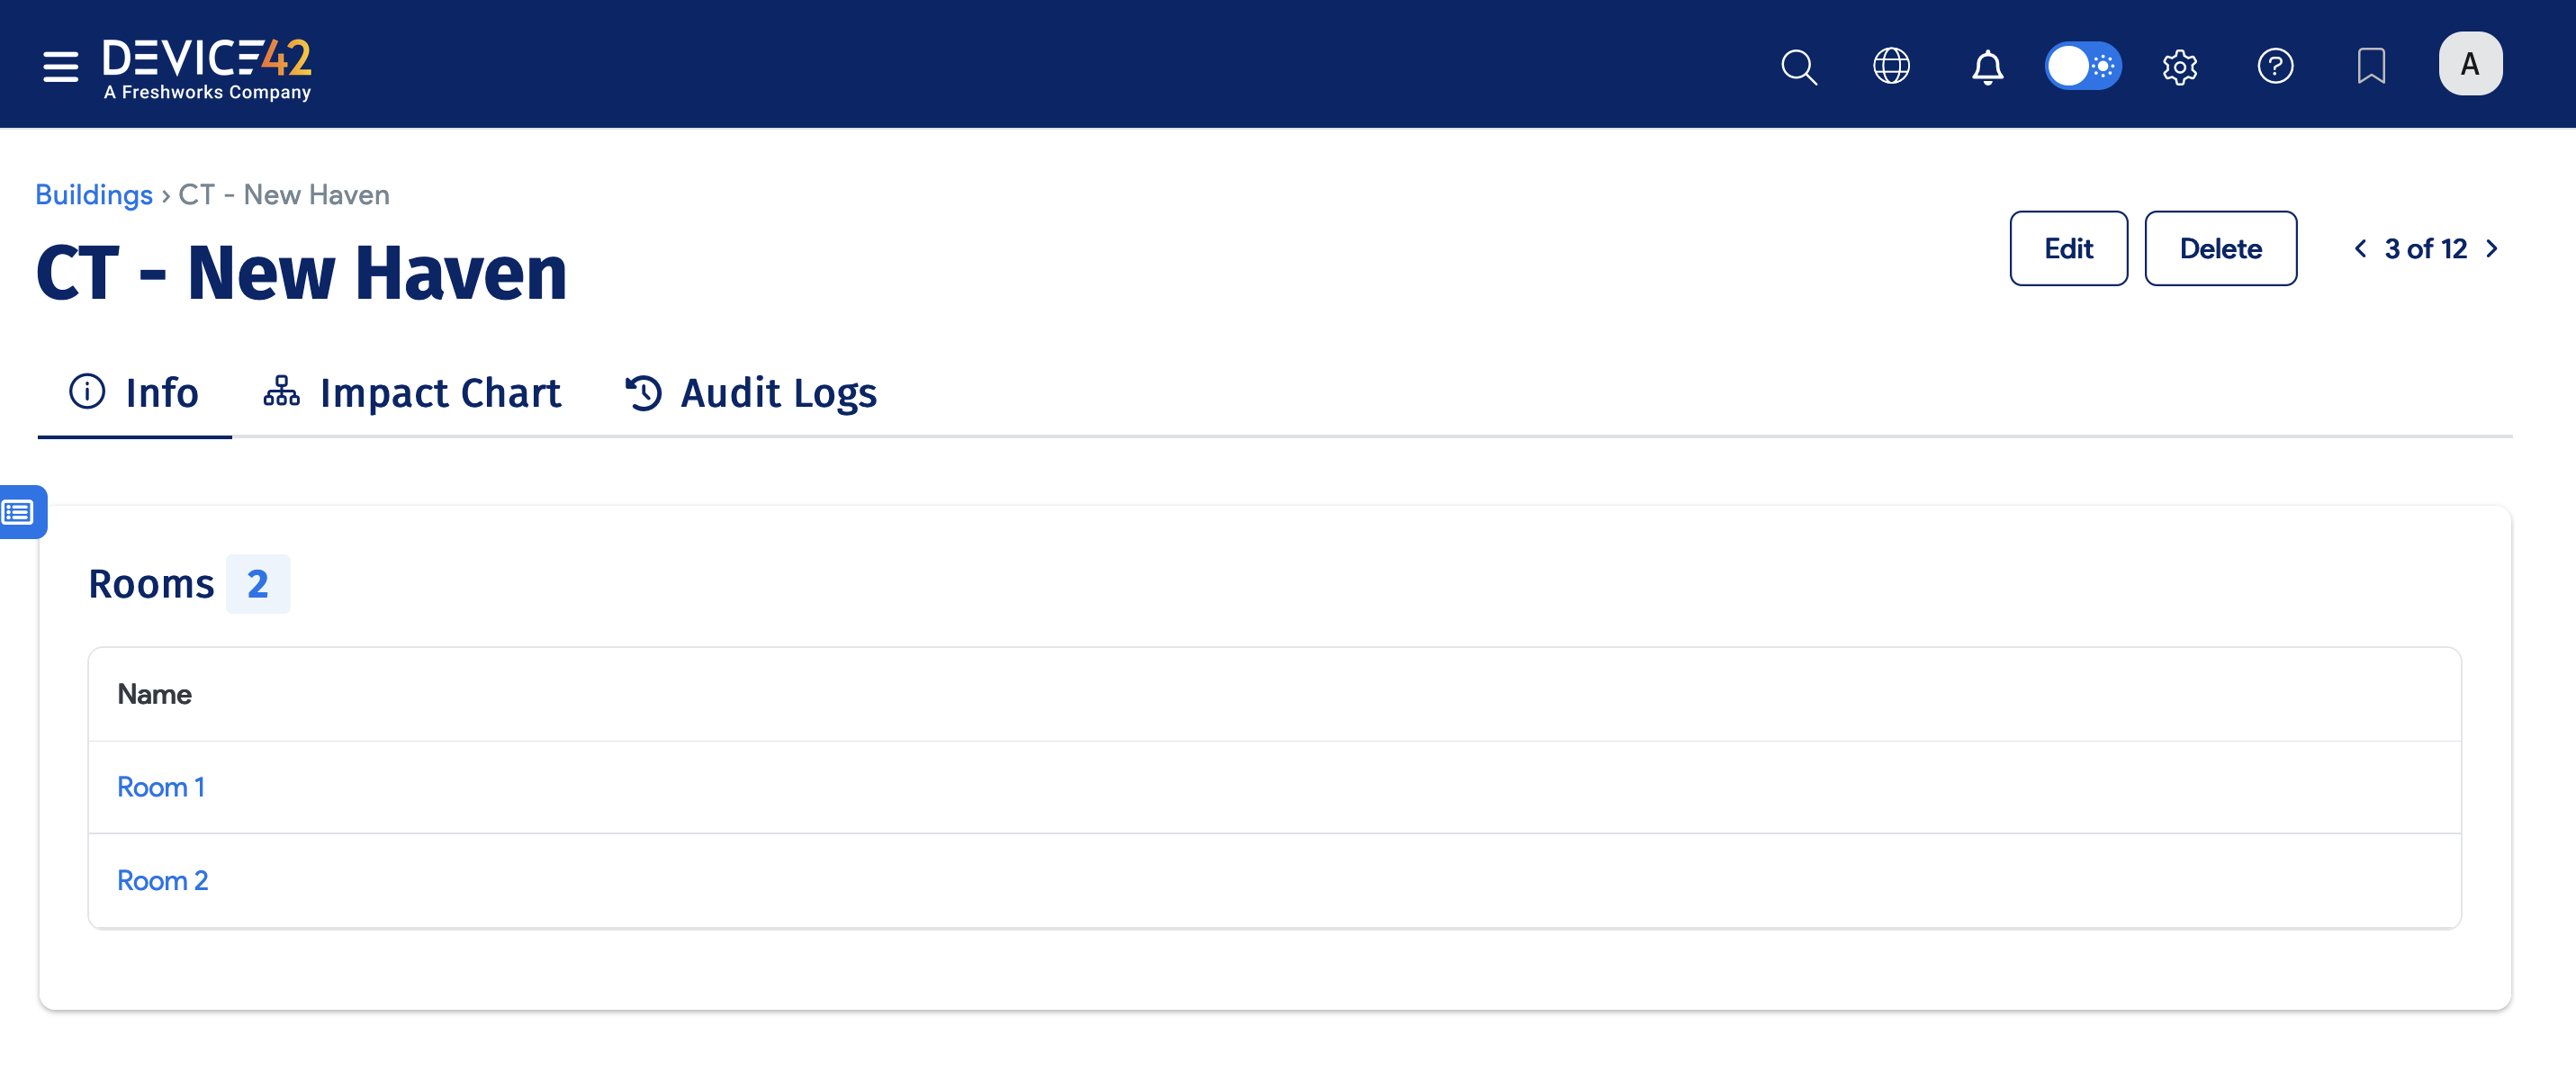
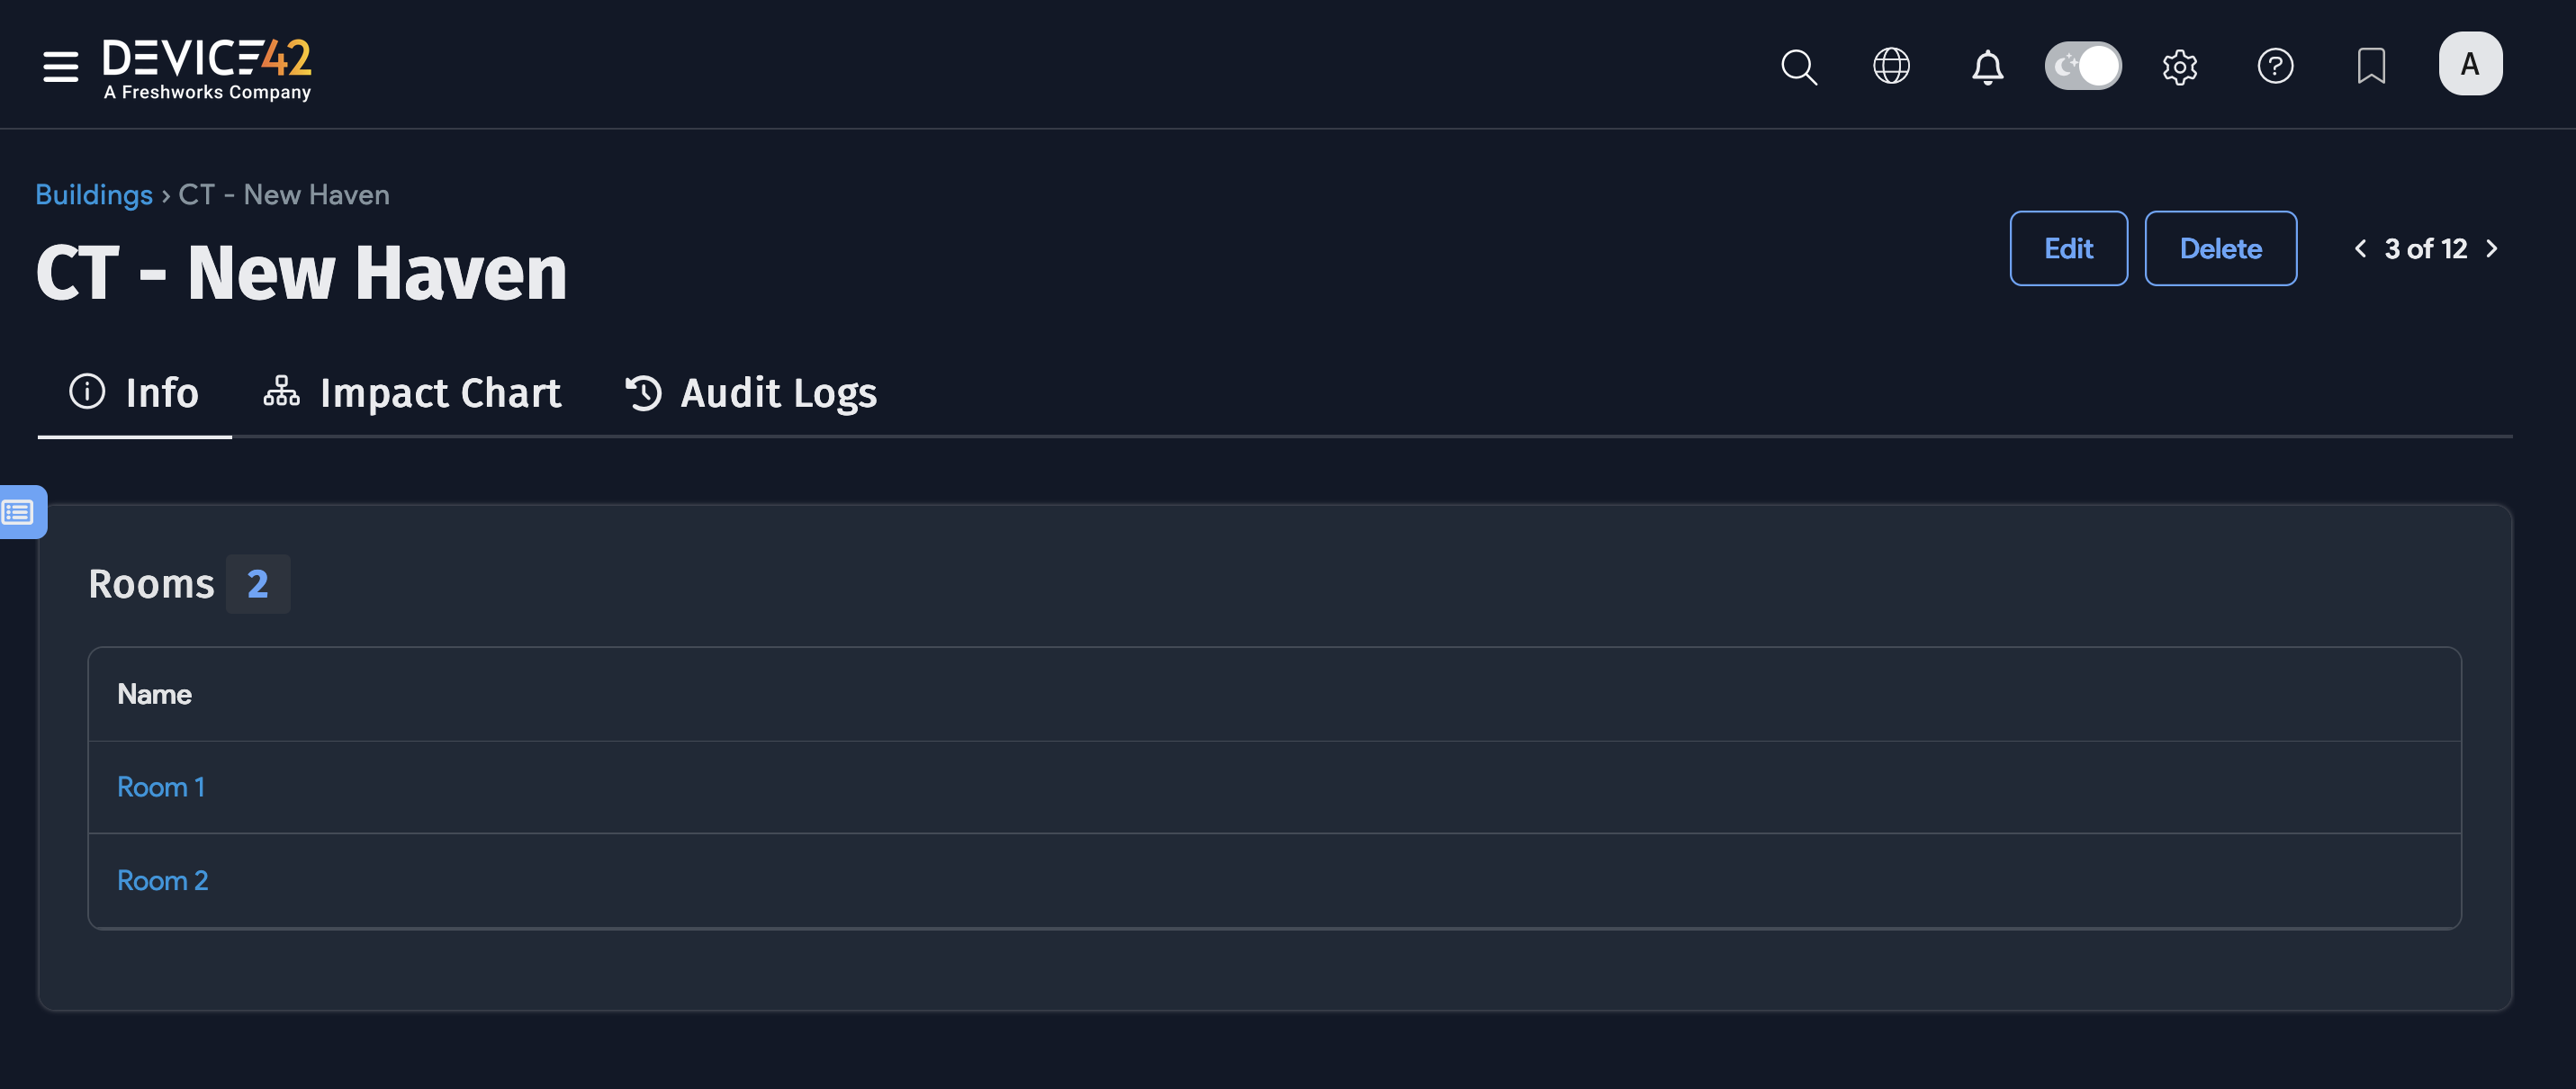
You can add rooms to an existing building by opening the building view from the list page and clicking the Edit button. When a room is added, click on the room name from the building view to see that room's details.
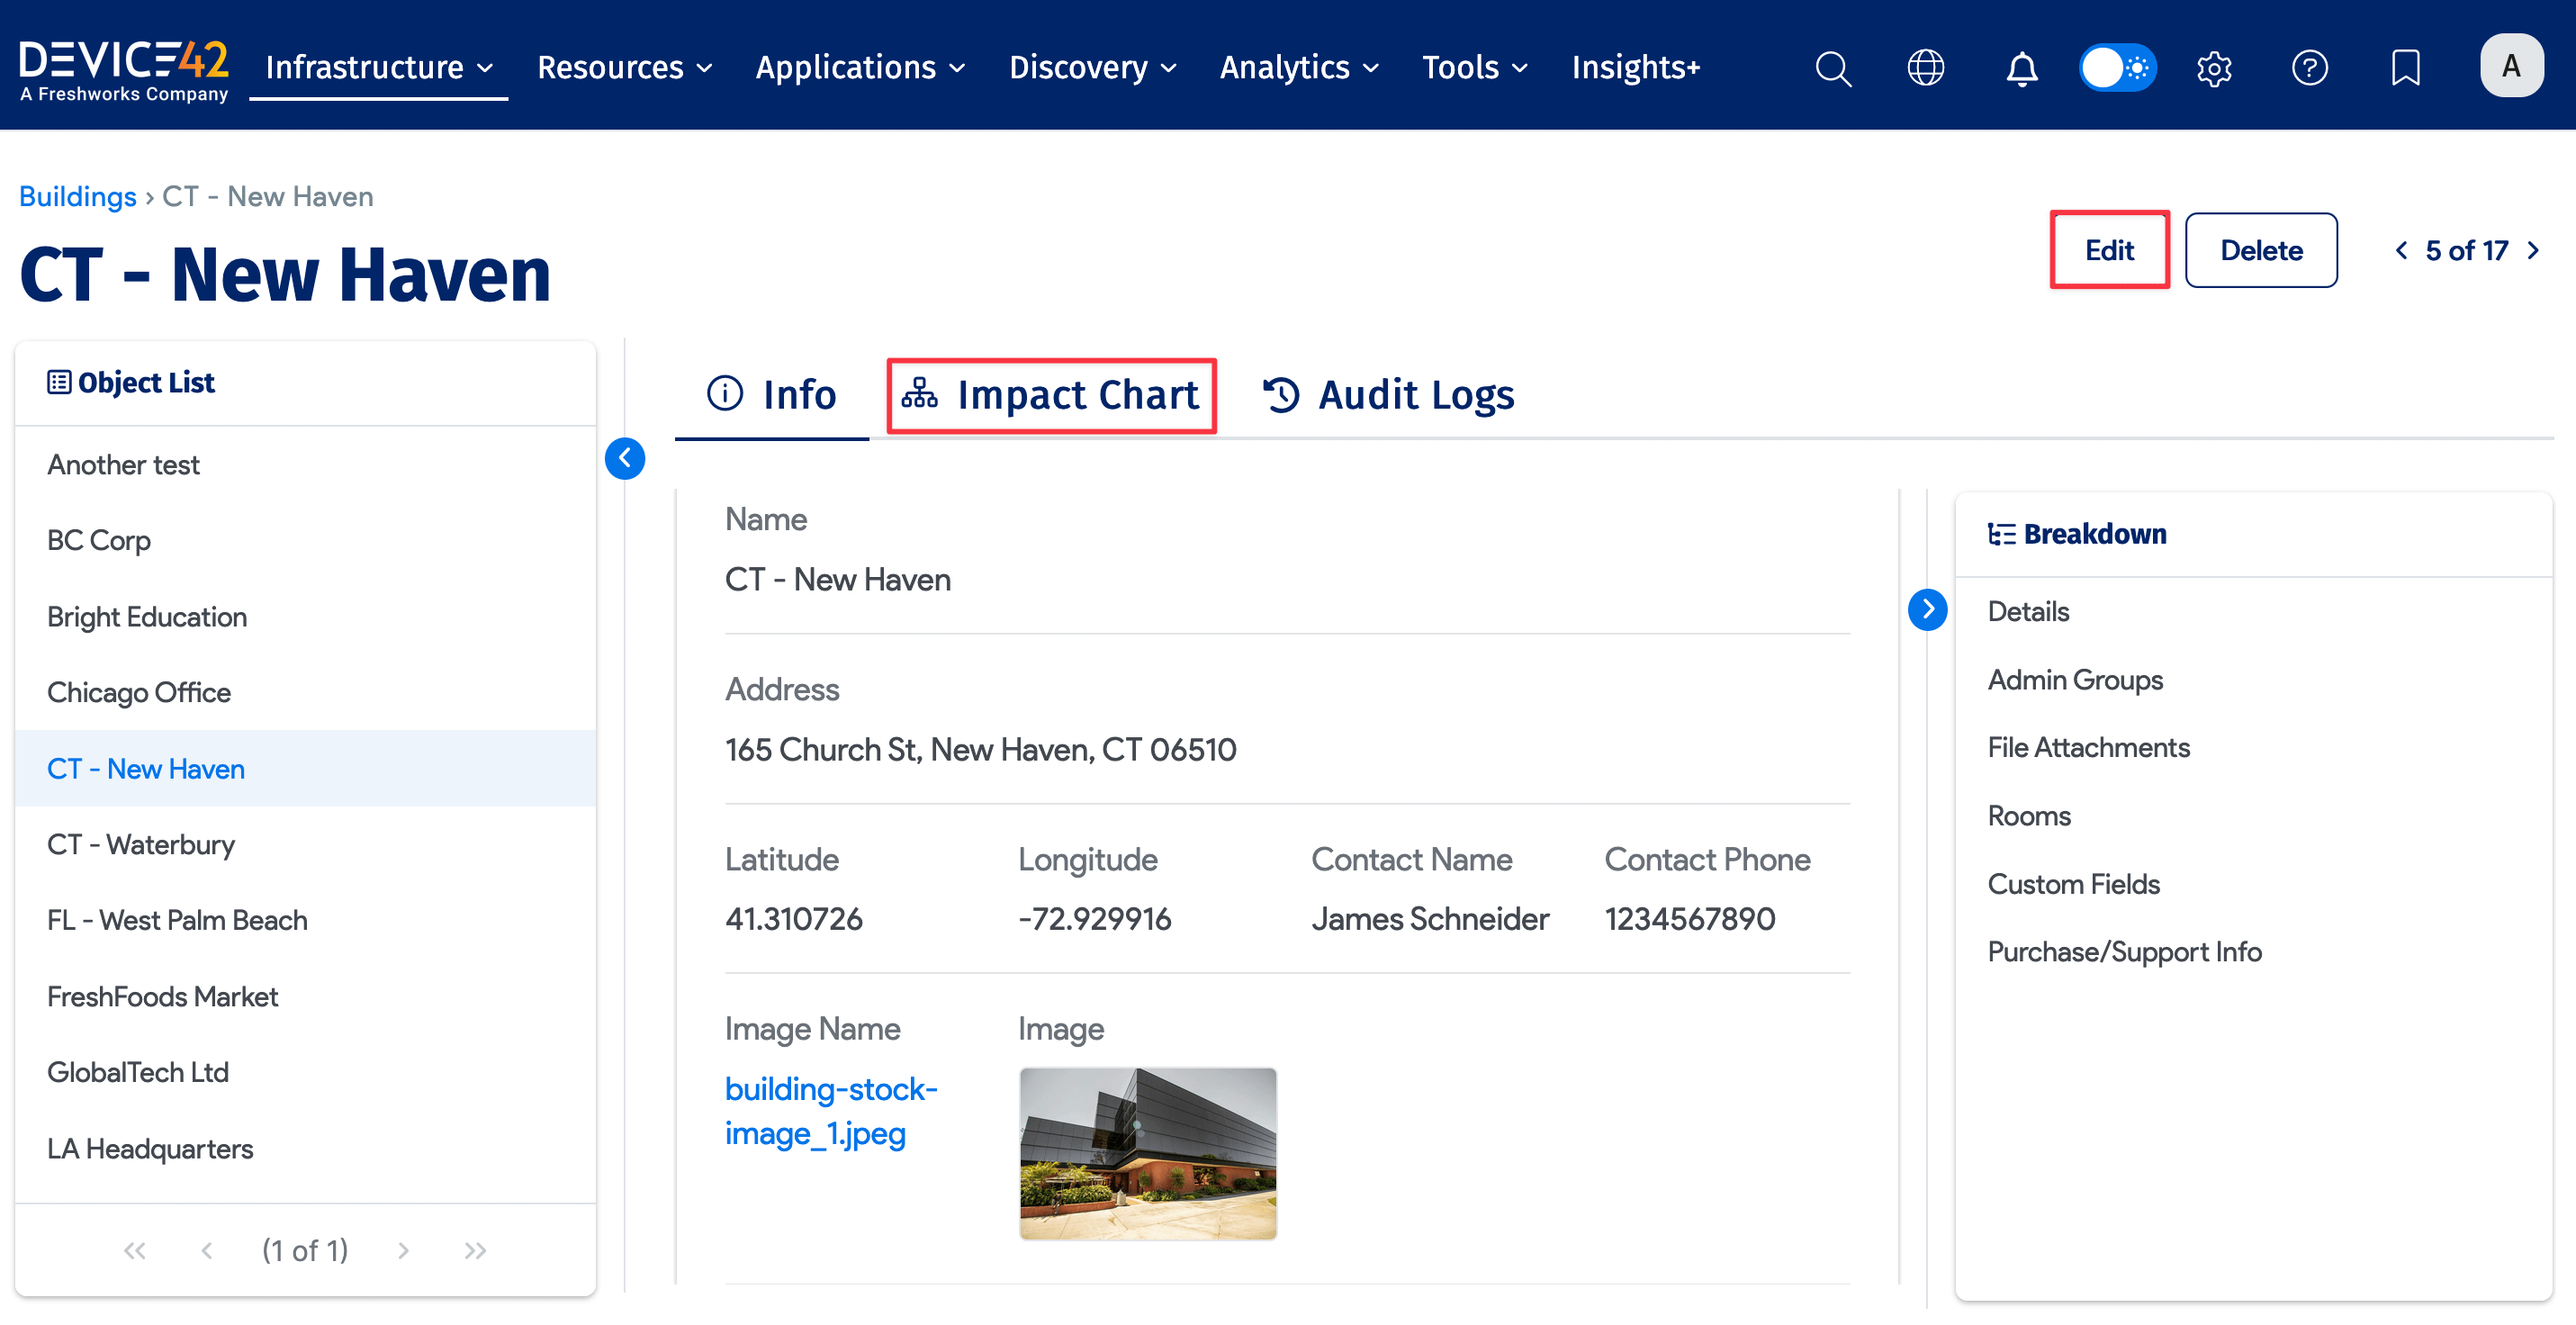

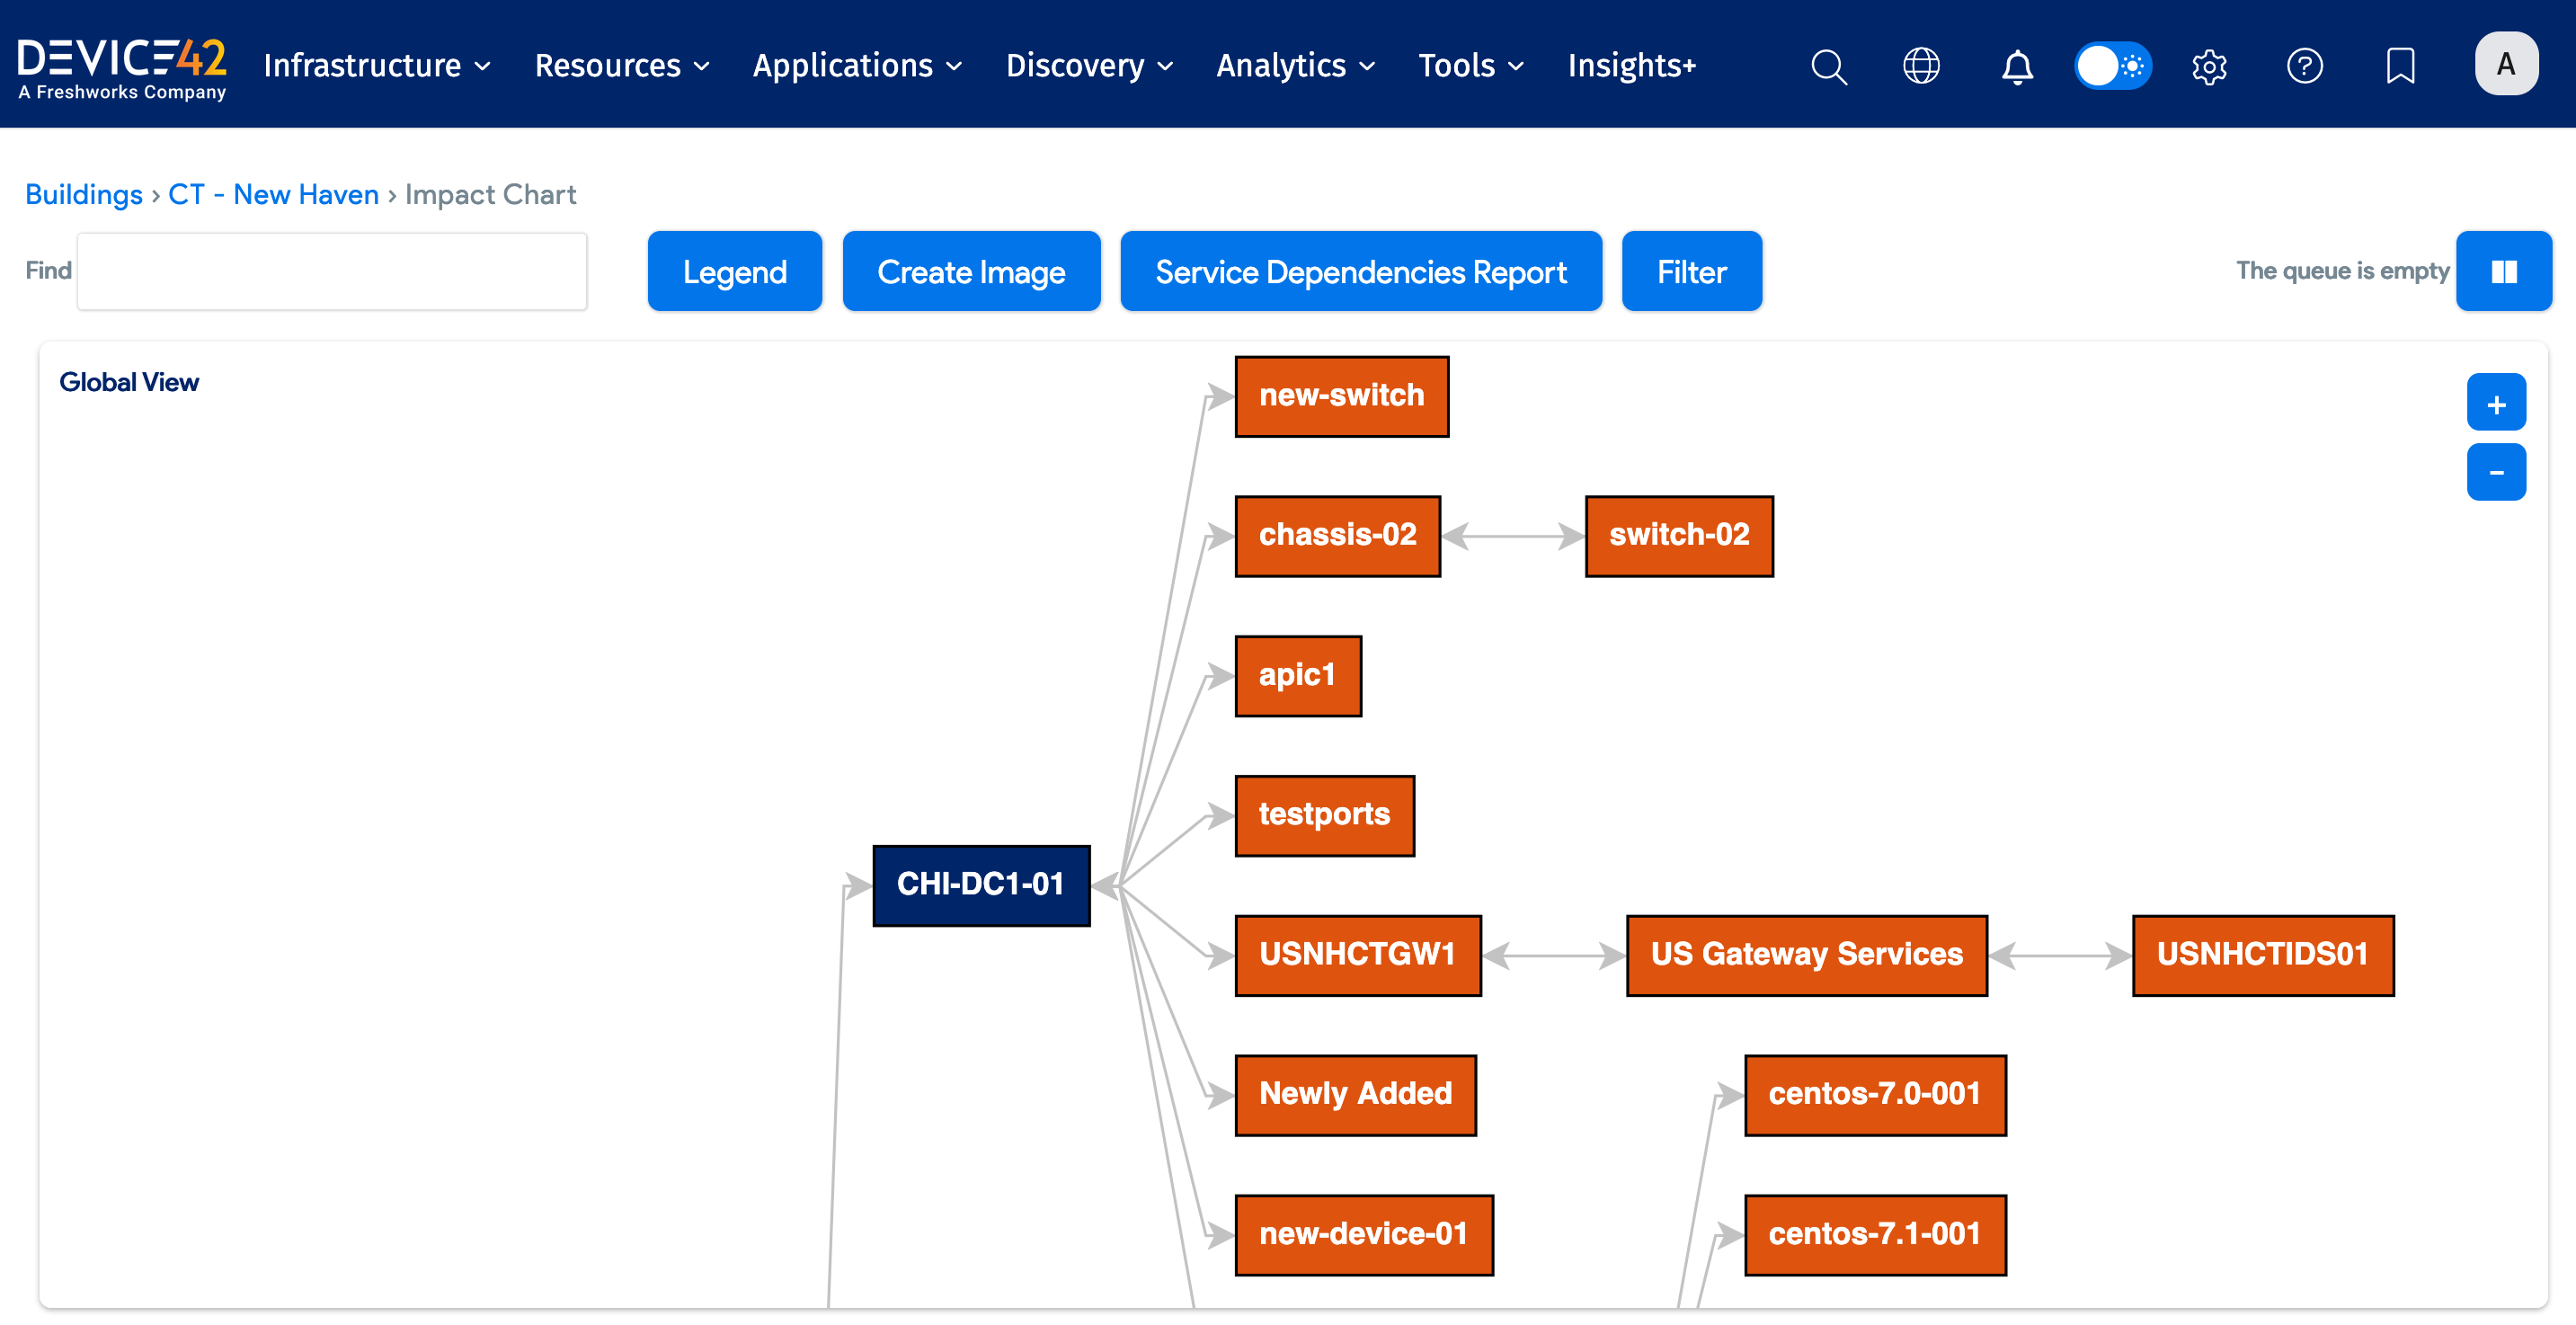
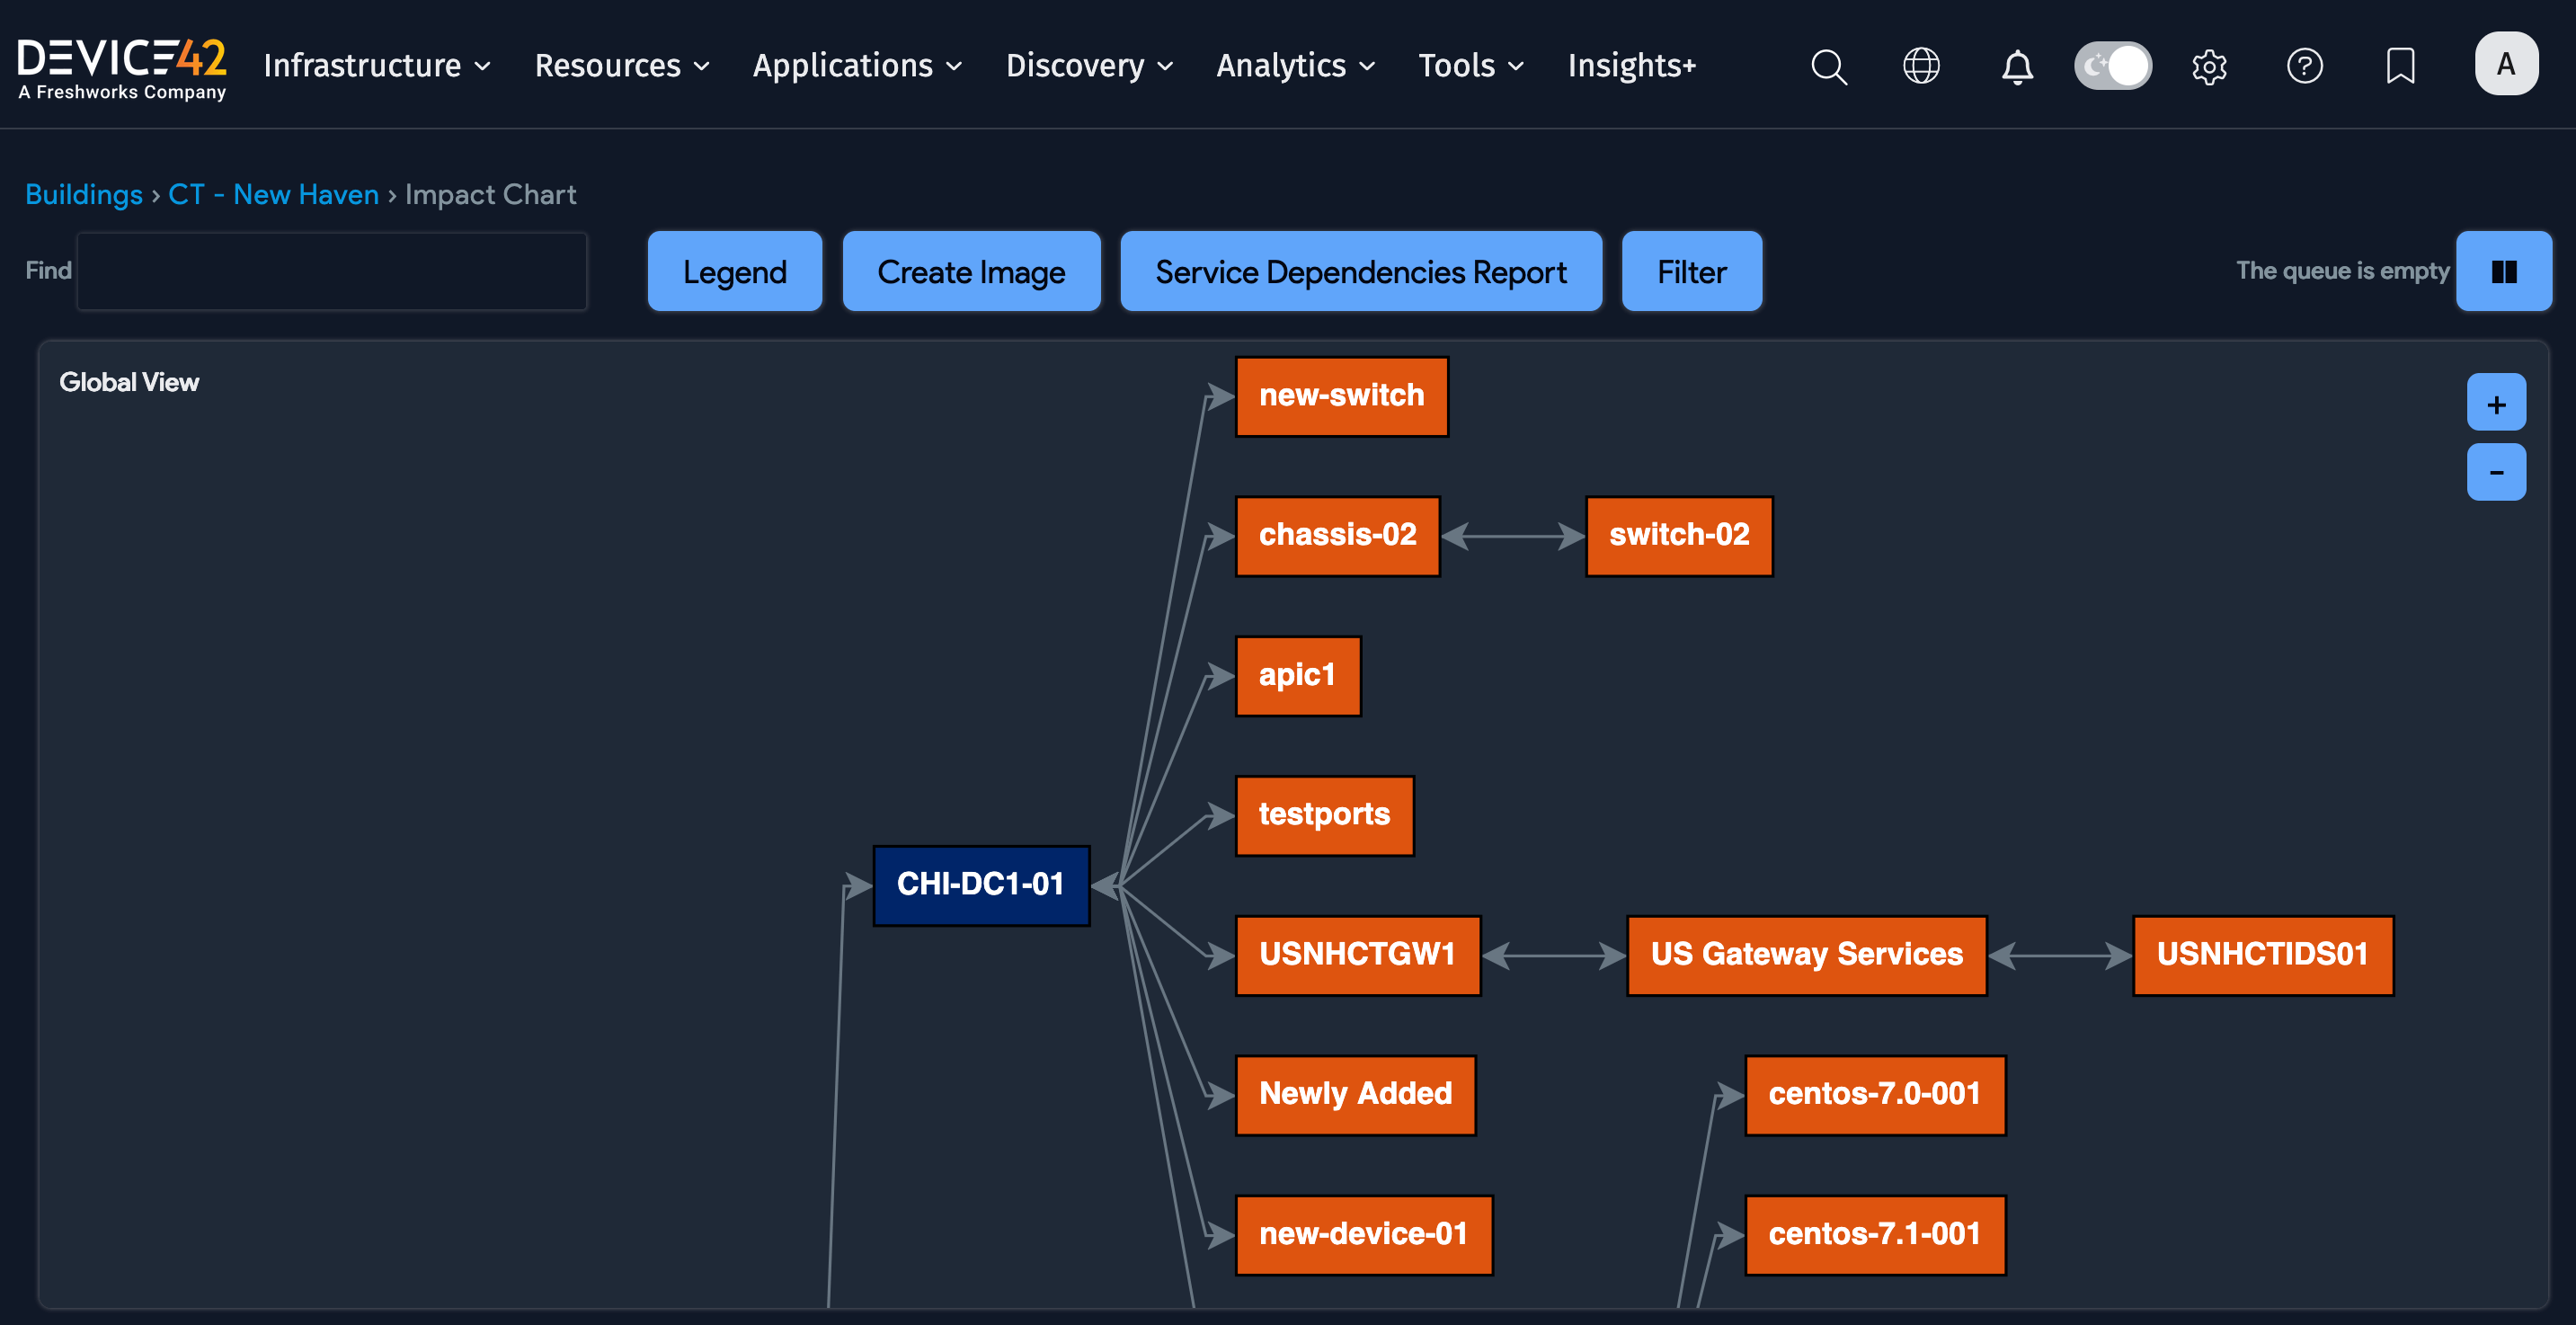
Click the Impact Chart button on the view page to open the chart in a new tab.
The Rooms associated with the Building are clickable links in the room layout view. You can click Edit to add or remove Rooms from a building.
Rooms List Page
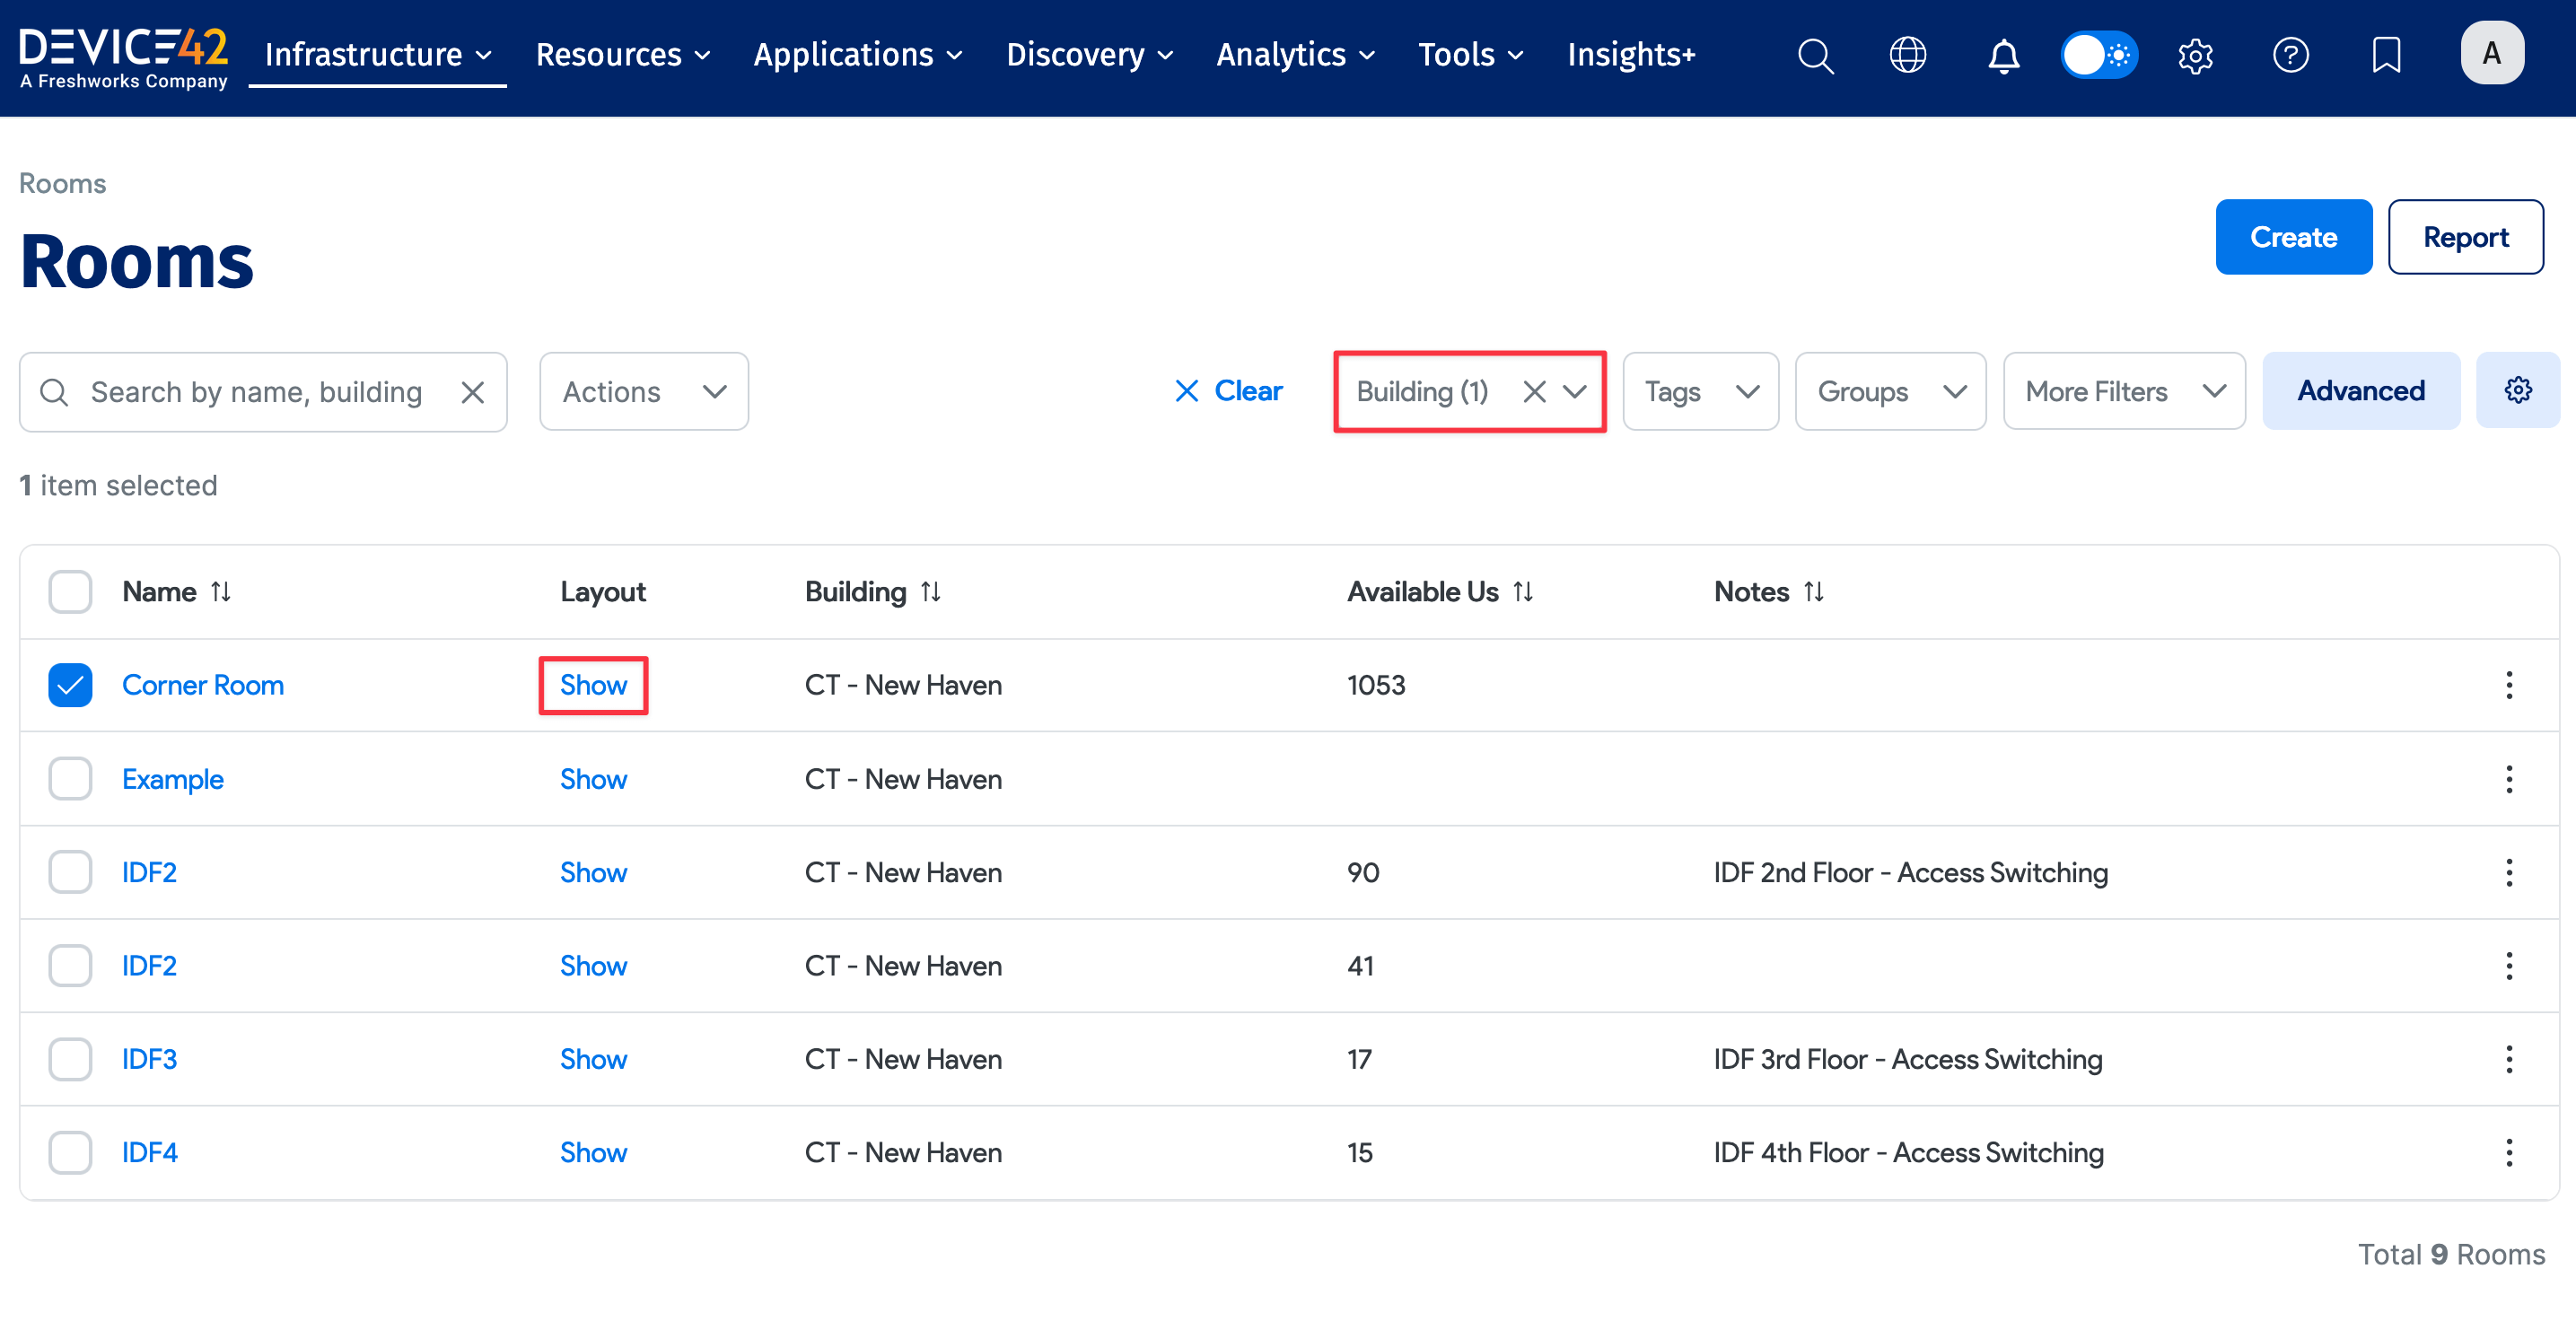
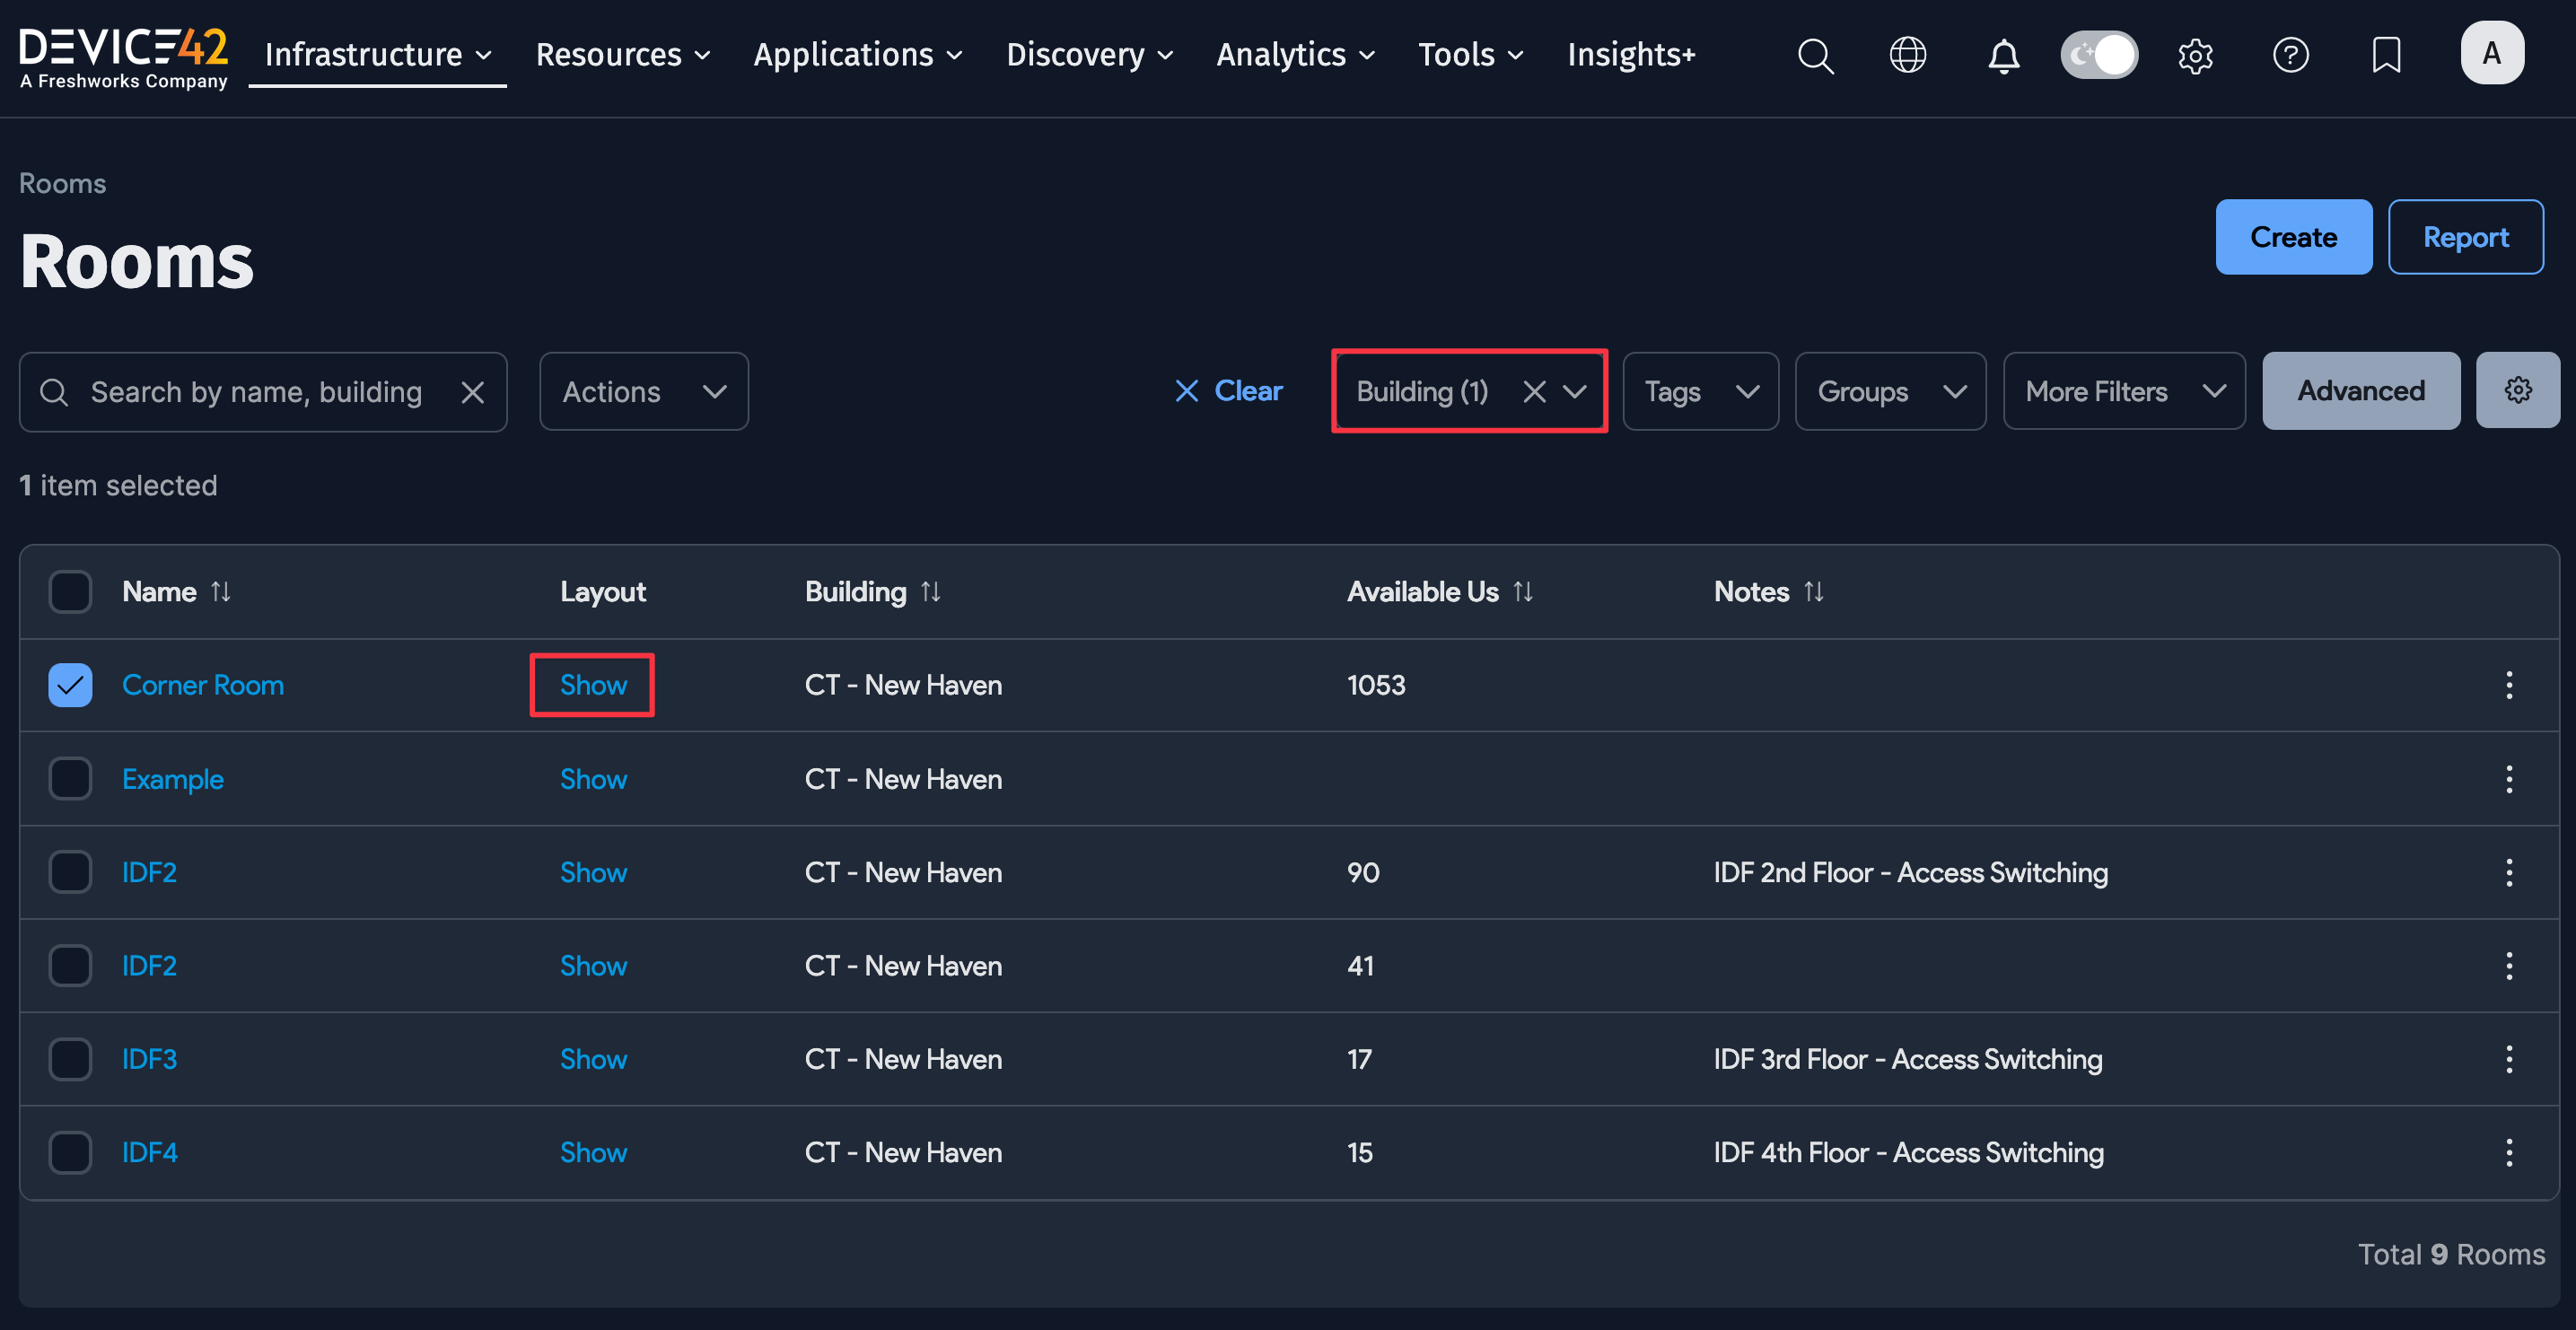
Find the Rooms list view under Infrastructure > DataCenter > Rooms. The table shows the Available Us along with other room details. You can filter the list by Building and Tags using the dropdown menus above the table.
Click the Show link next to a room name to enter the Room Layout View, which provides a visual layout of the room.
Perform bulk or individual operations on the selected rooms from the Actions dropdown menu.
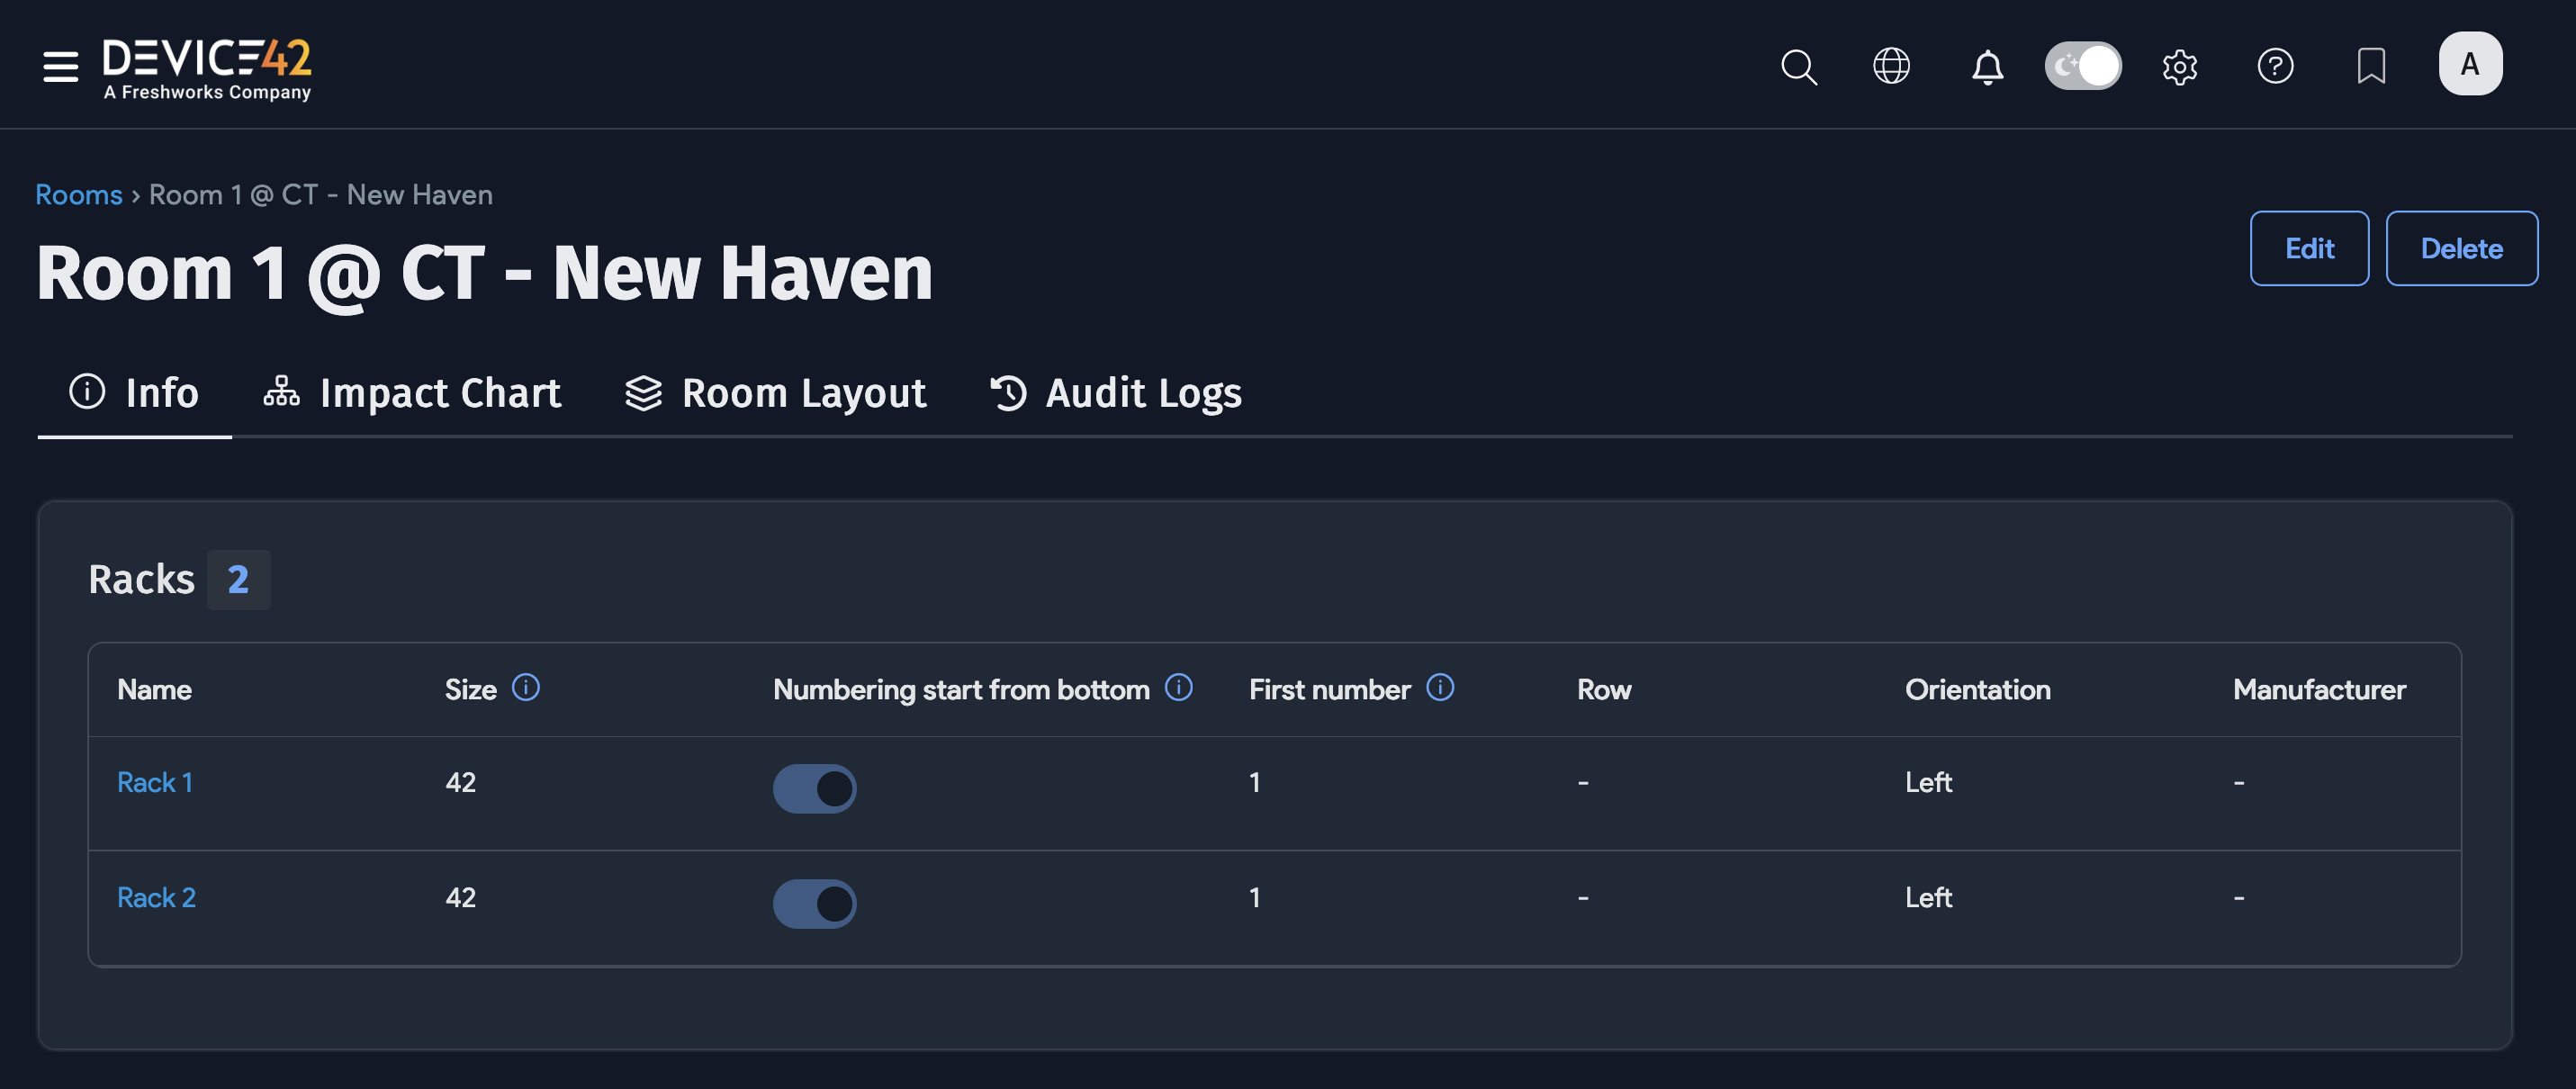
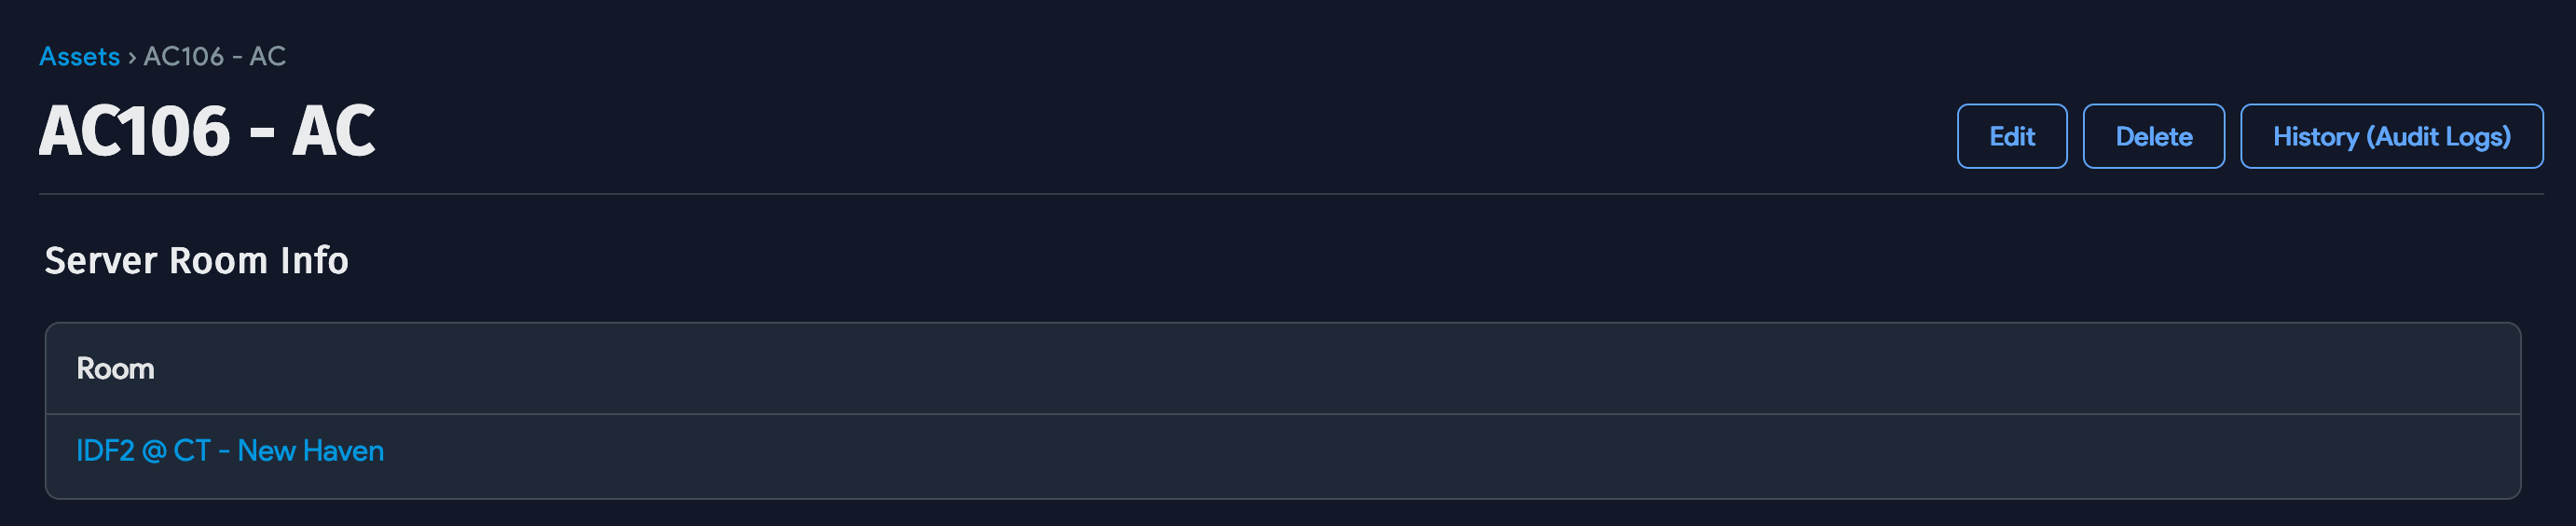
View Room Details
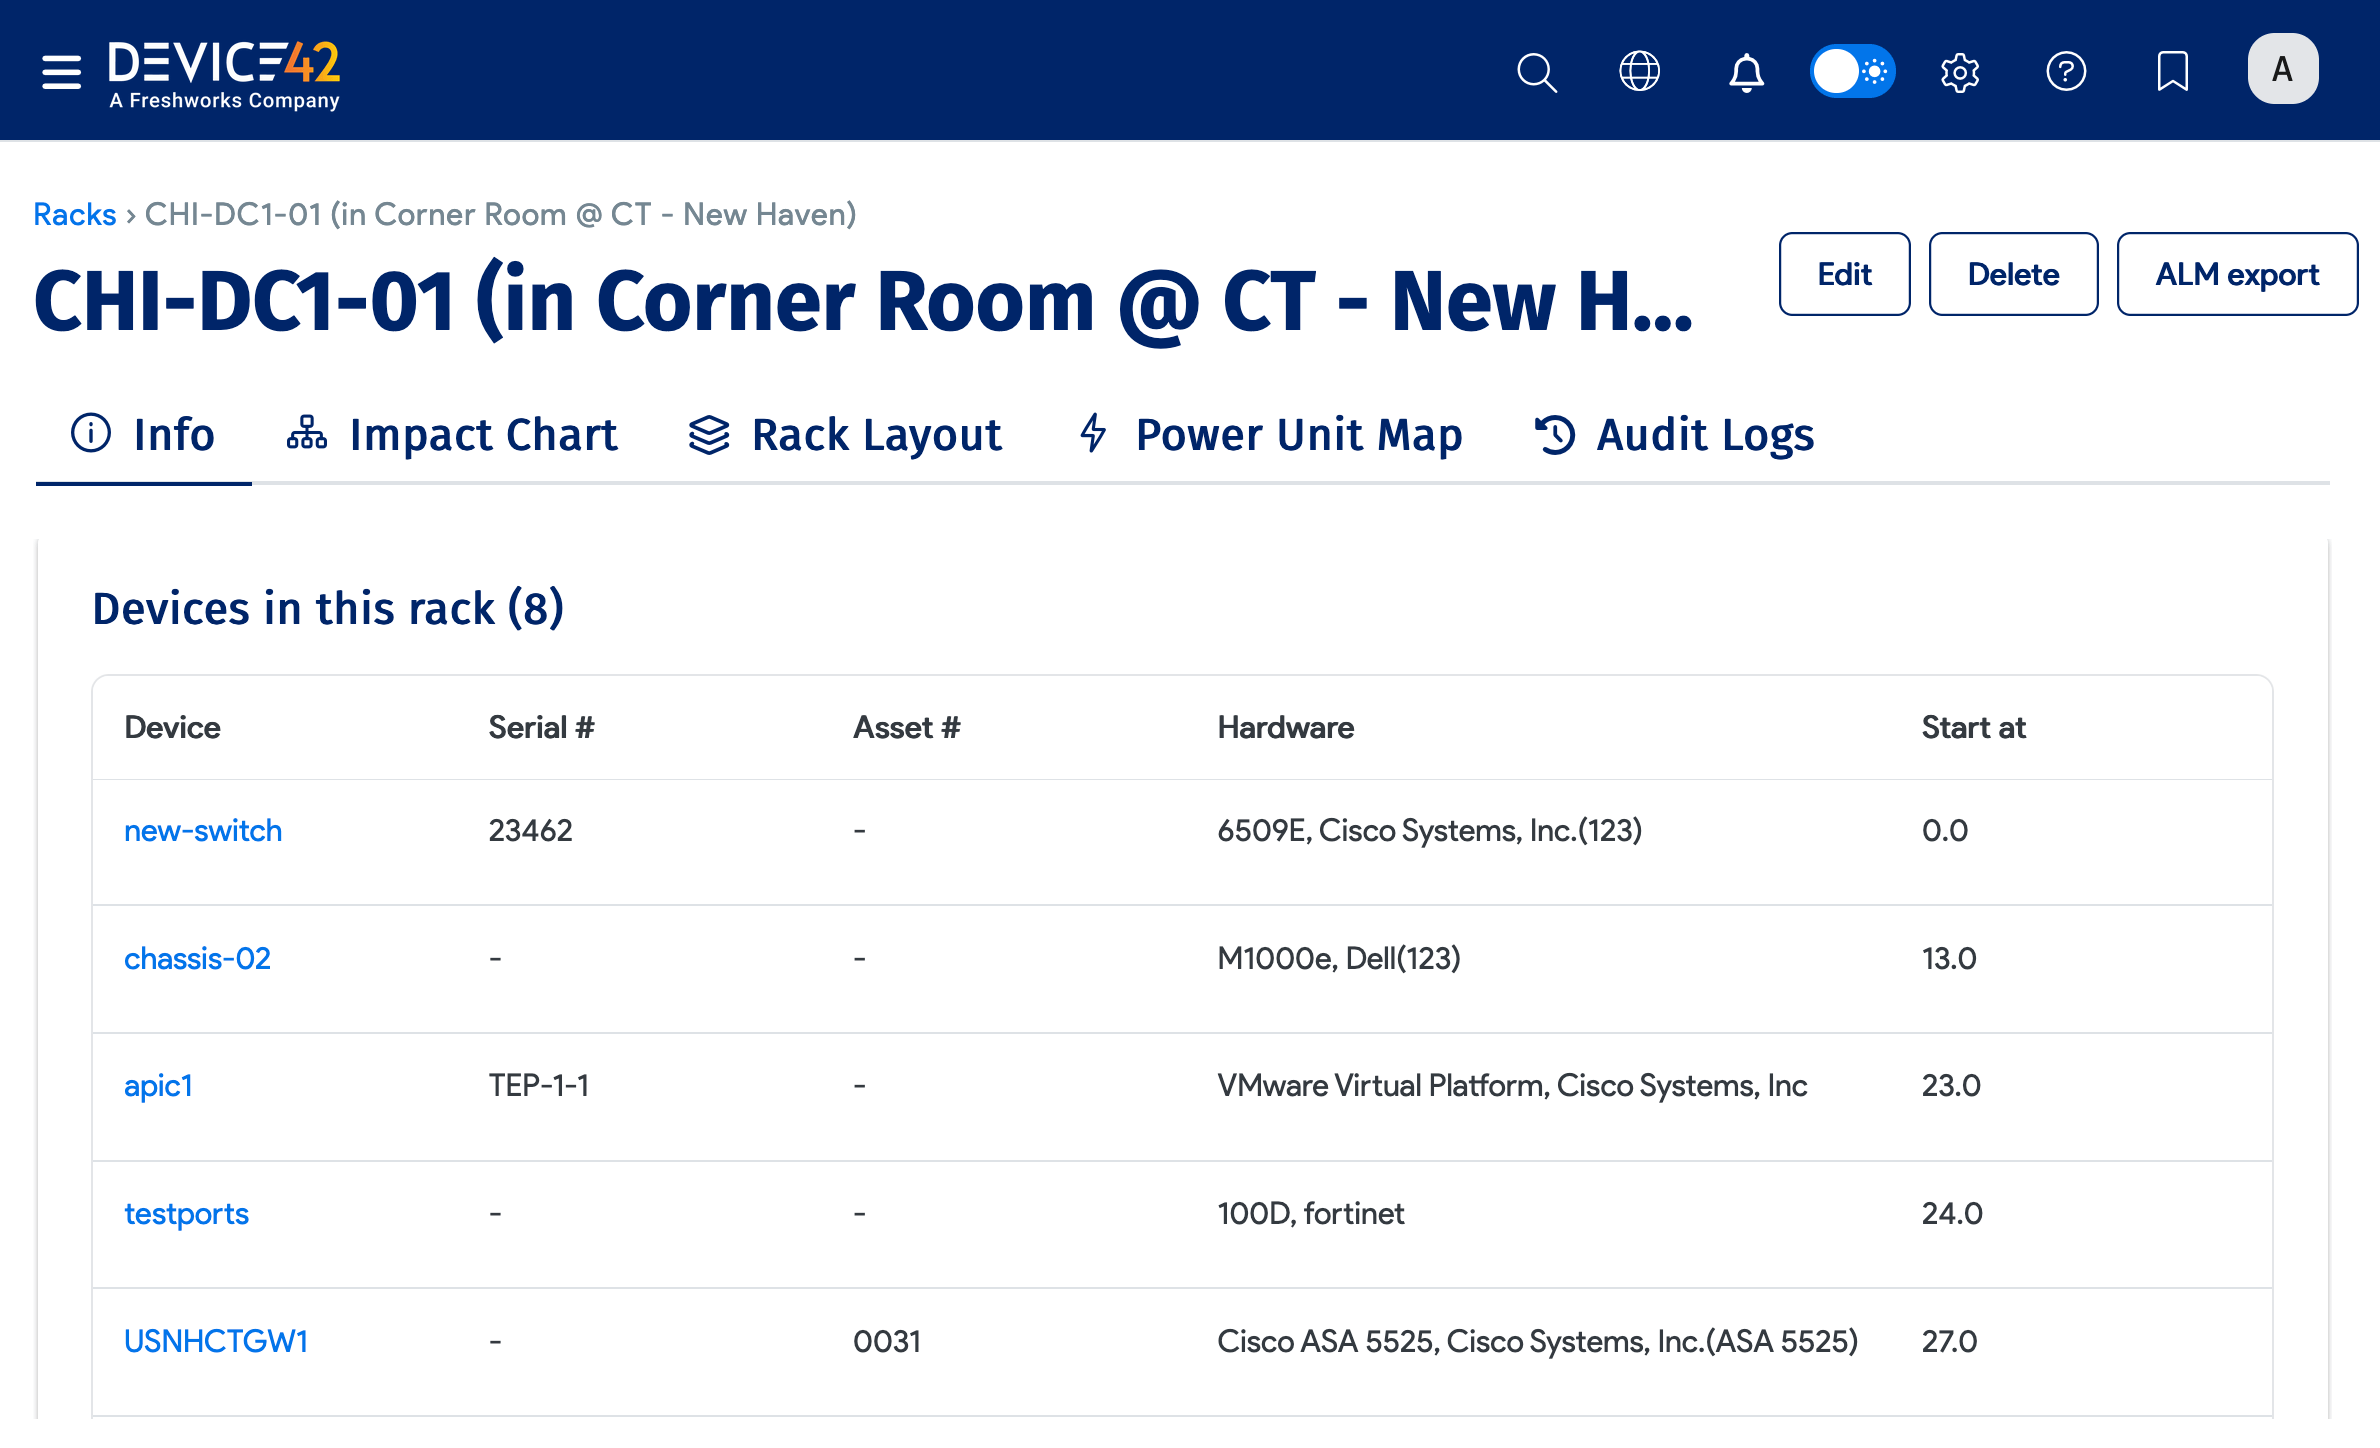
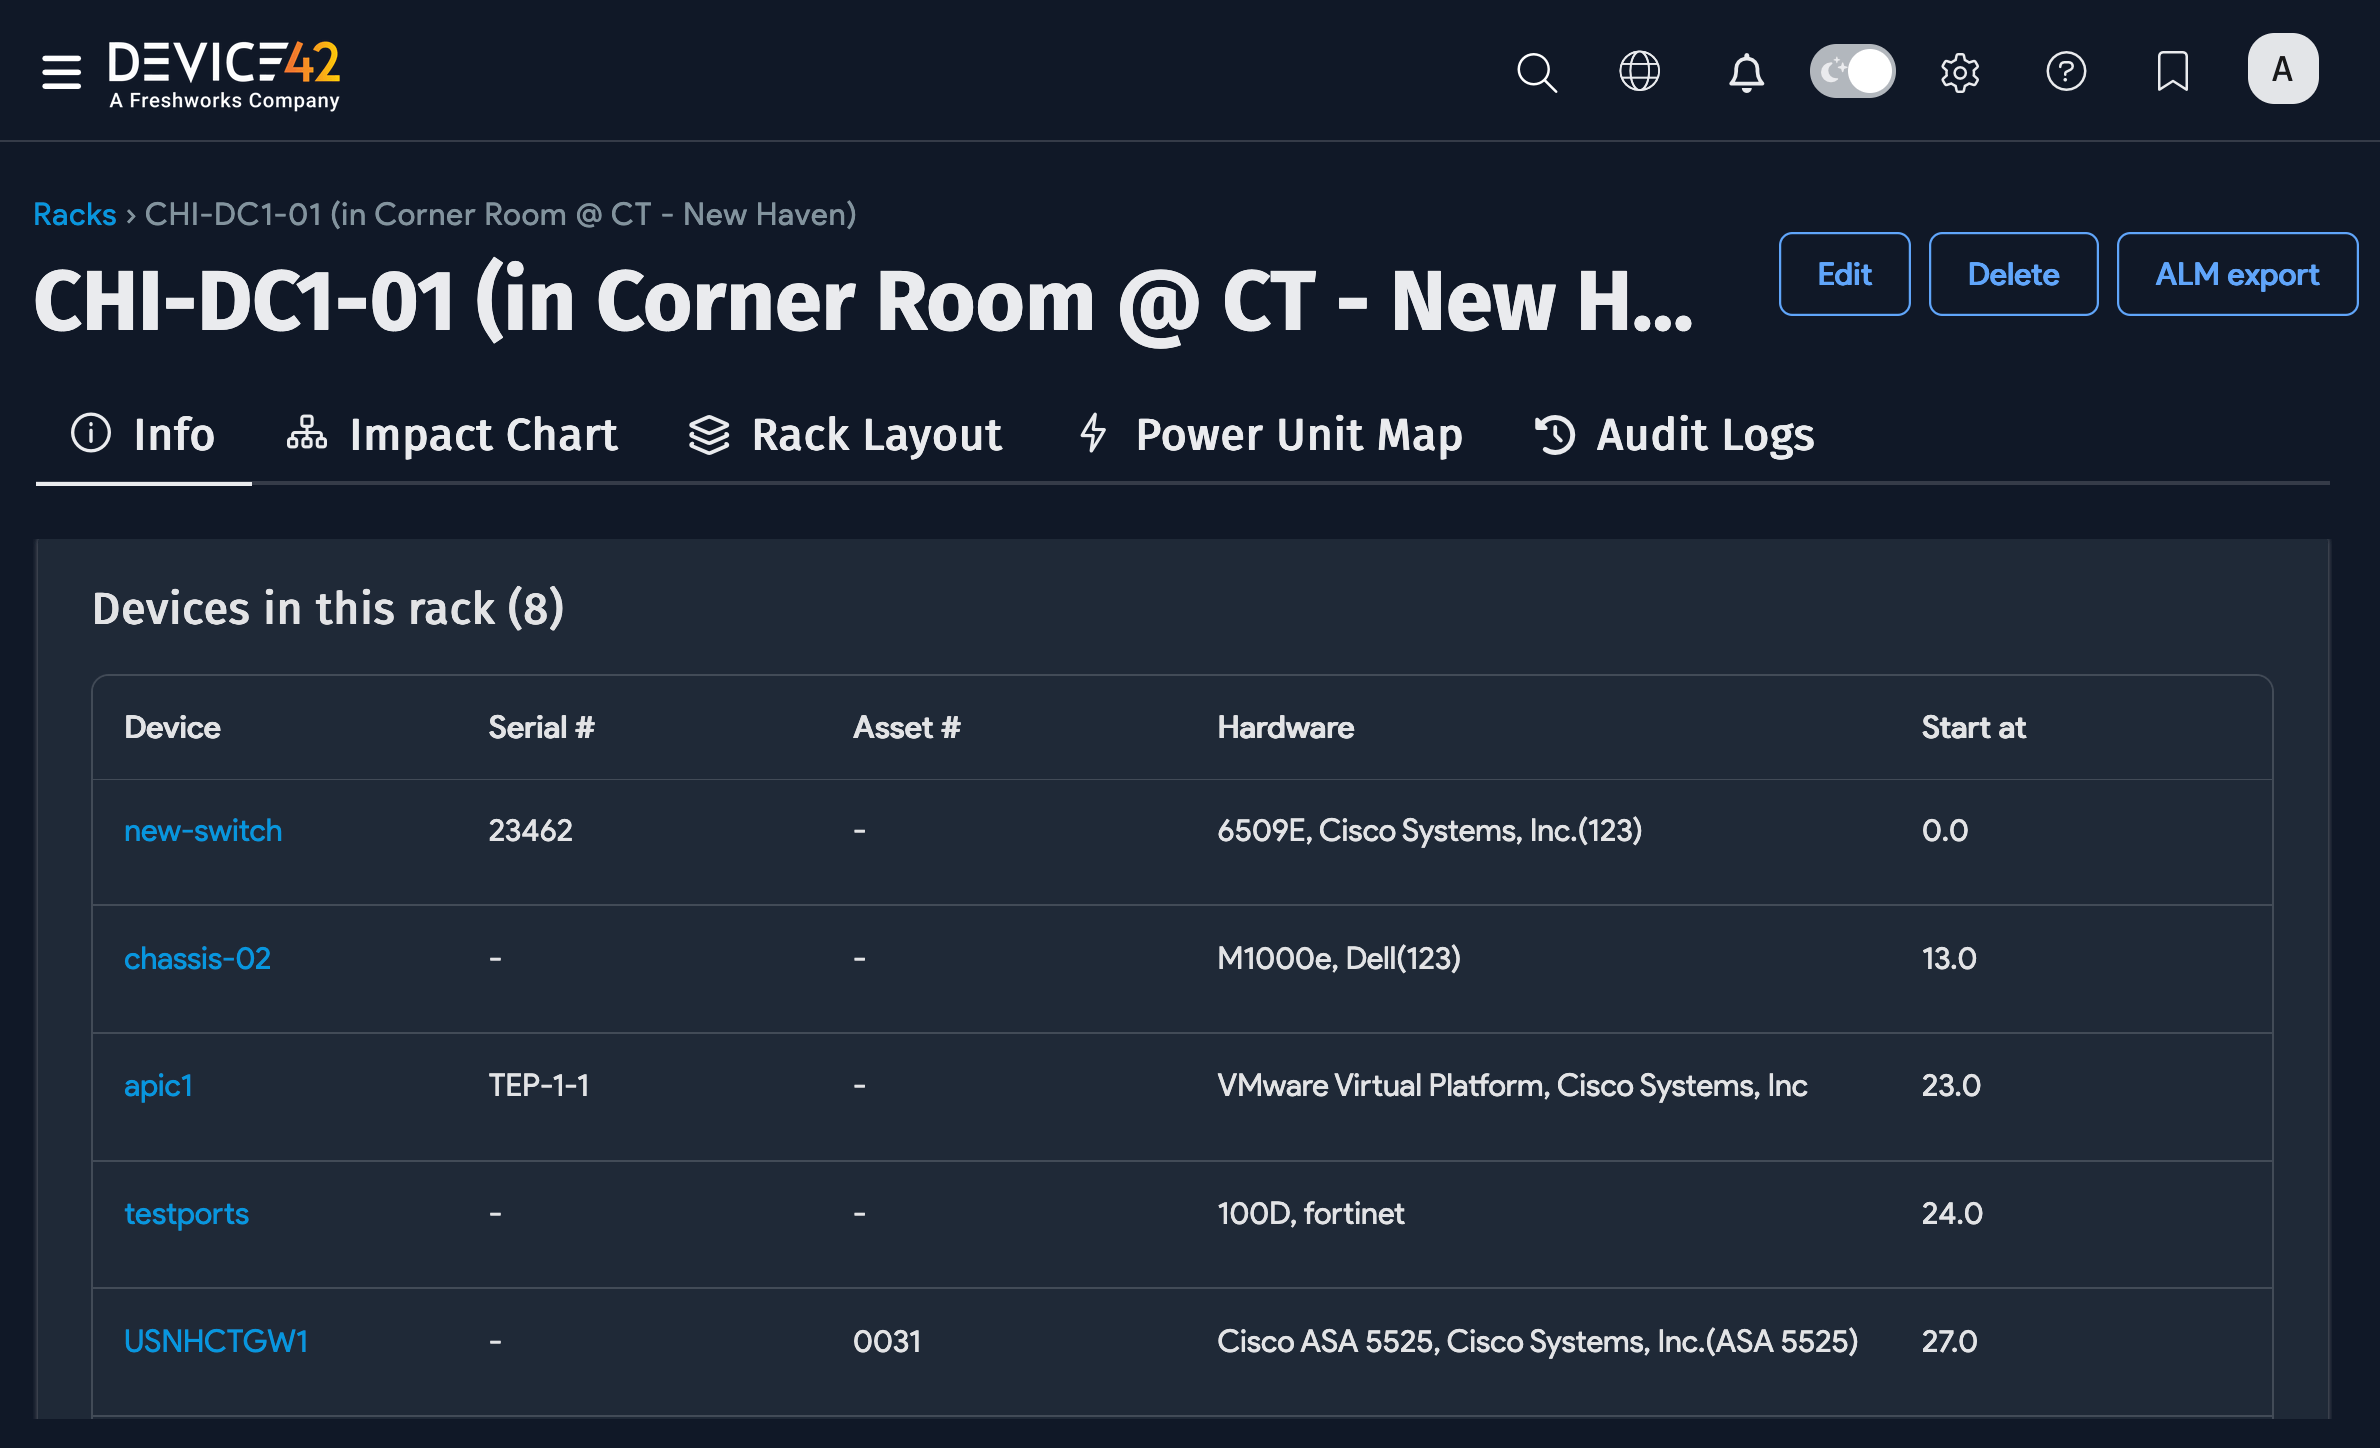
Click on the name of a room from the list view to view or change its details. Basic room information is at the top of the page: Name, Building, Units of measure, Group Permissions, Tags, and Notes.
You'll see the following buttons:
- Edit: Edit the room's details.
- History (Audit Logs): See a log of the changes made to the room's information.
- Impact Chart: View a chart of devices, assets, and applications that rely on this room.
- Room Layout: View a logical representation of the room. The Room Layout View section below provides more information.
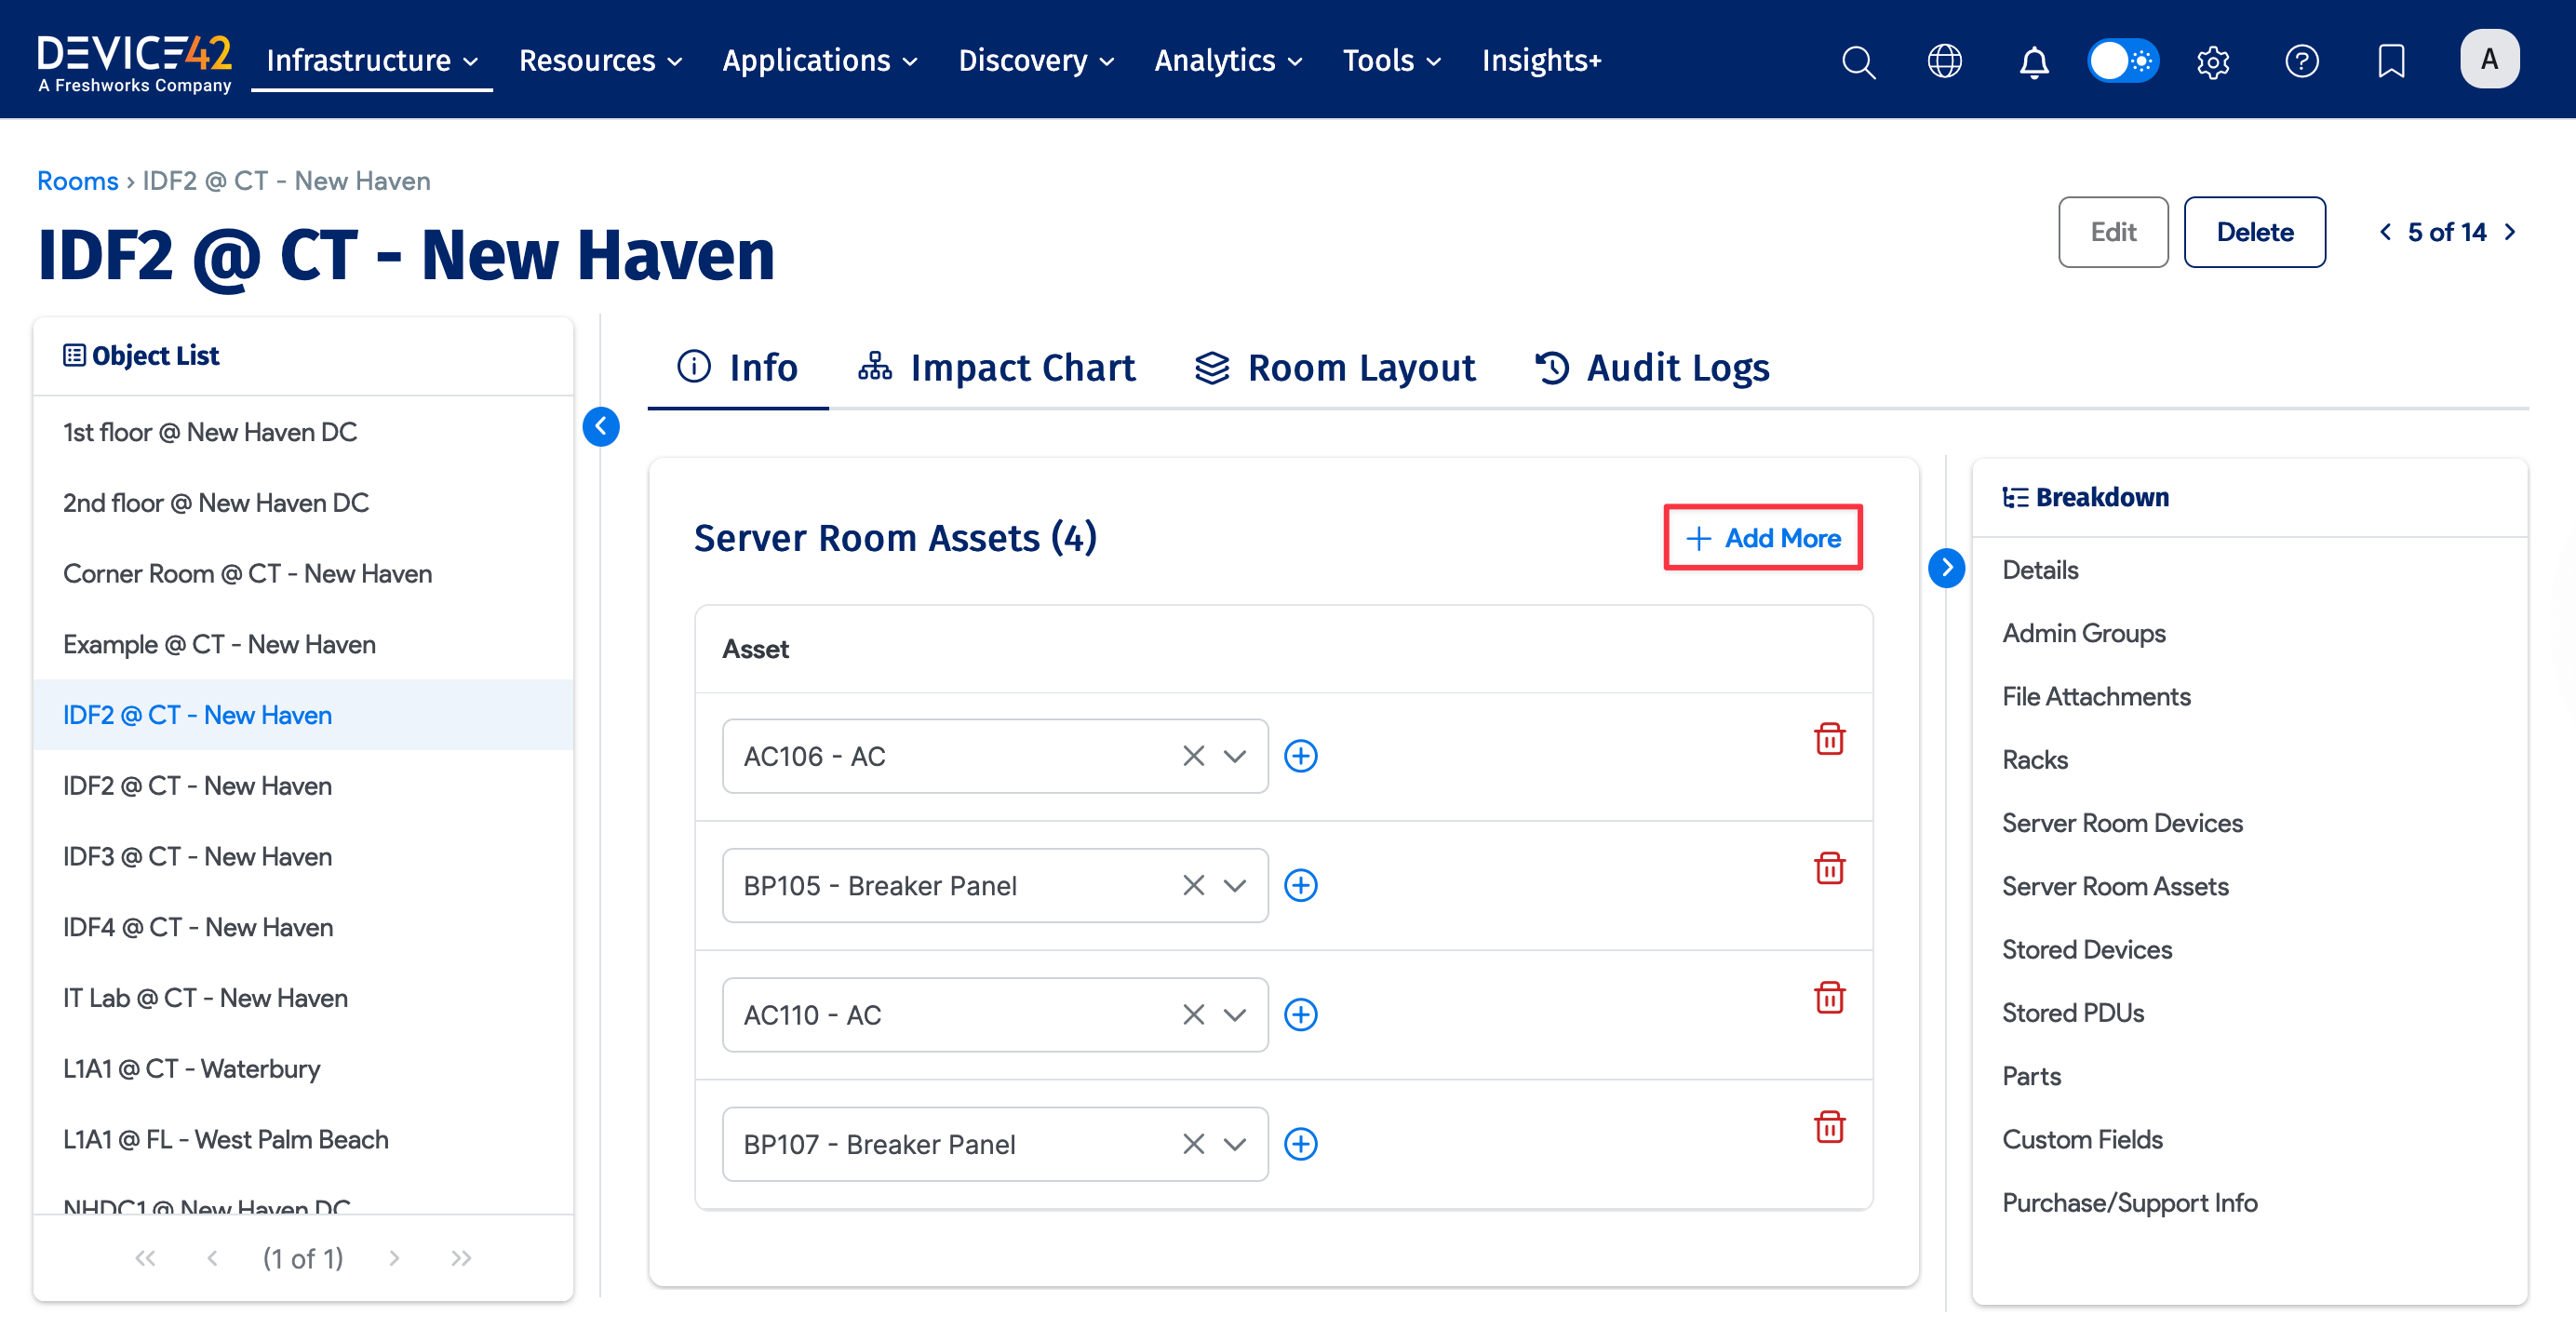
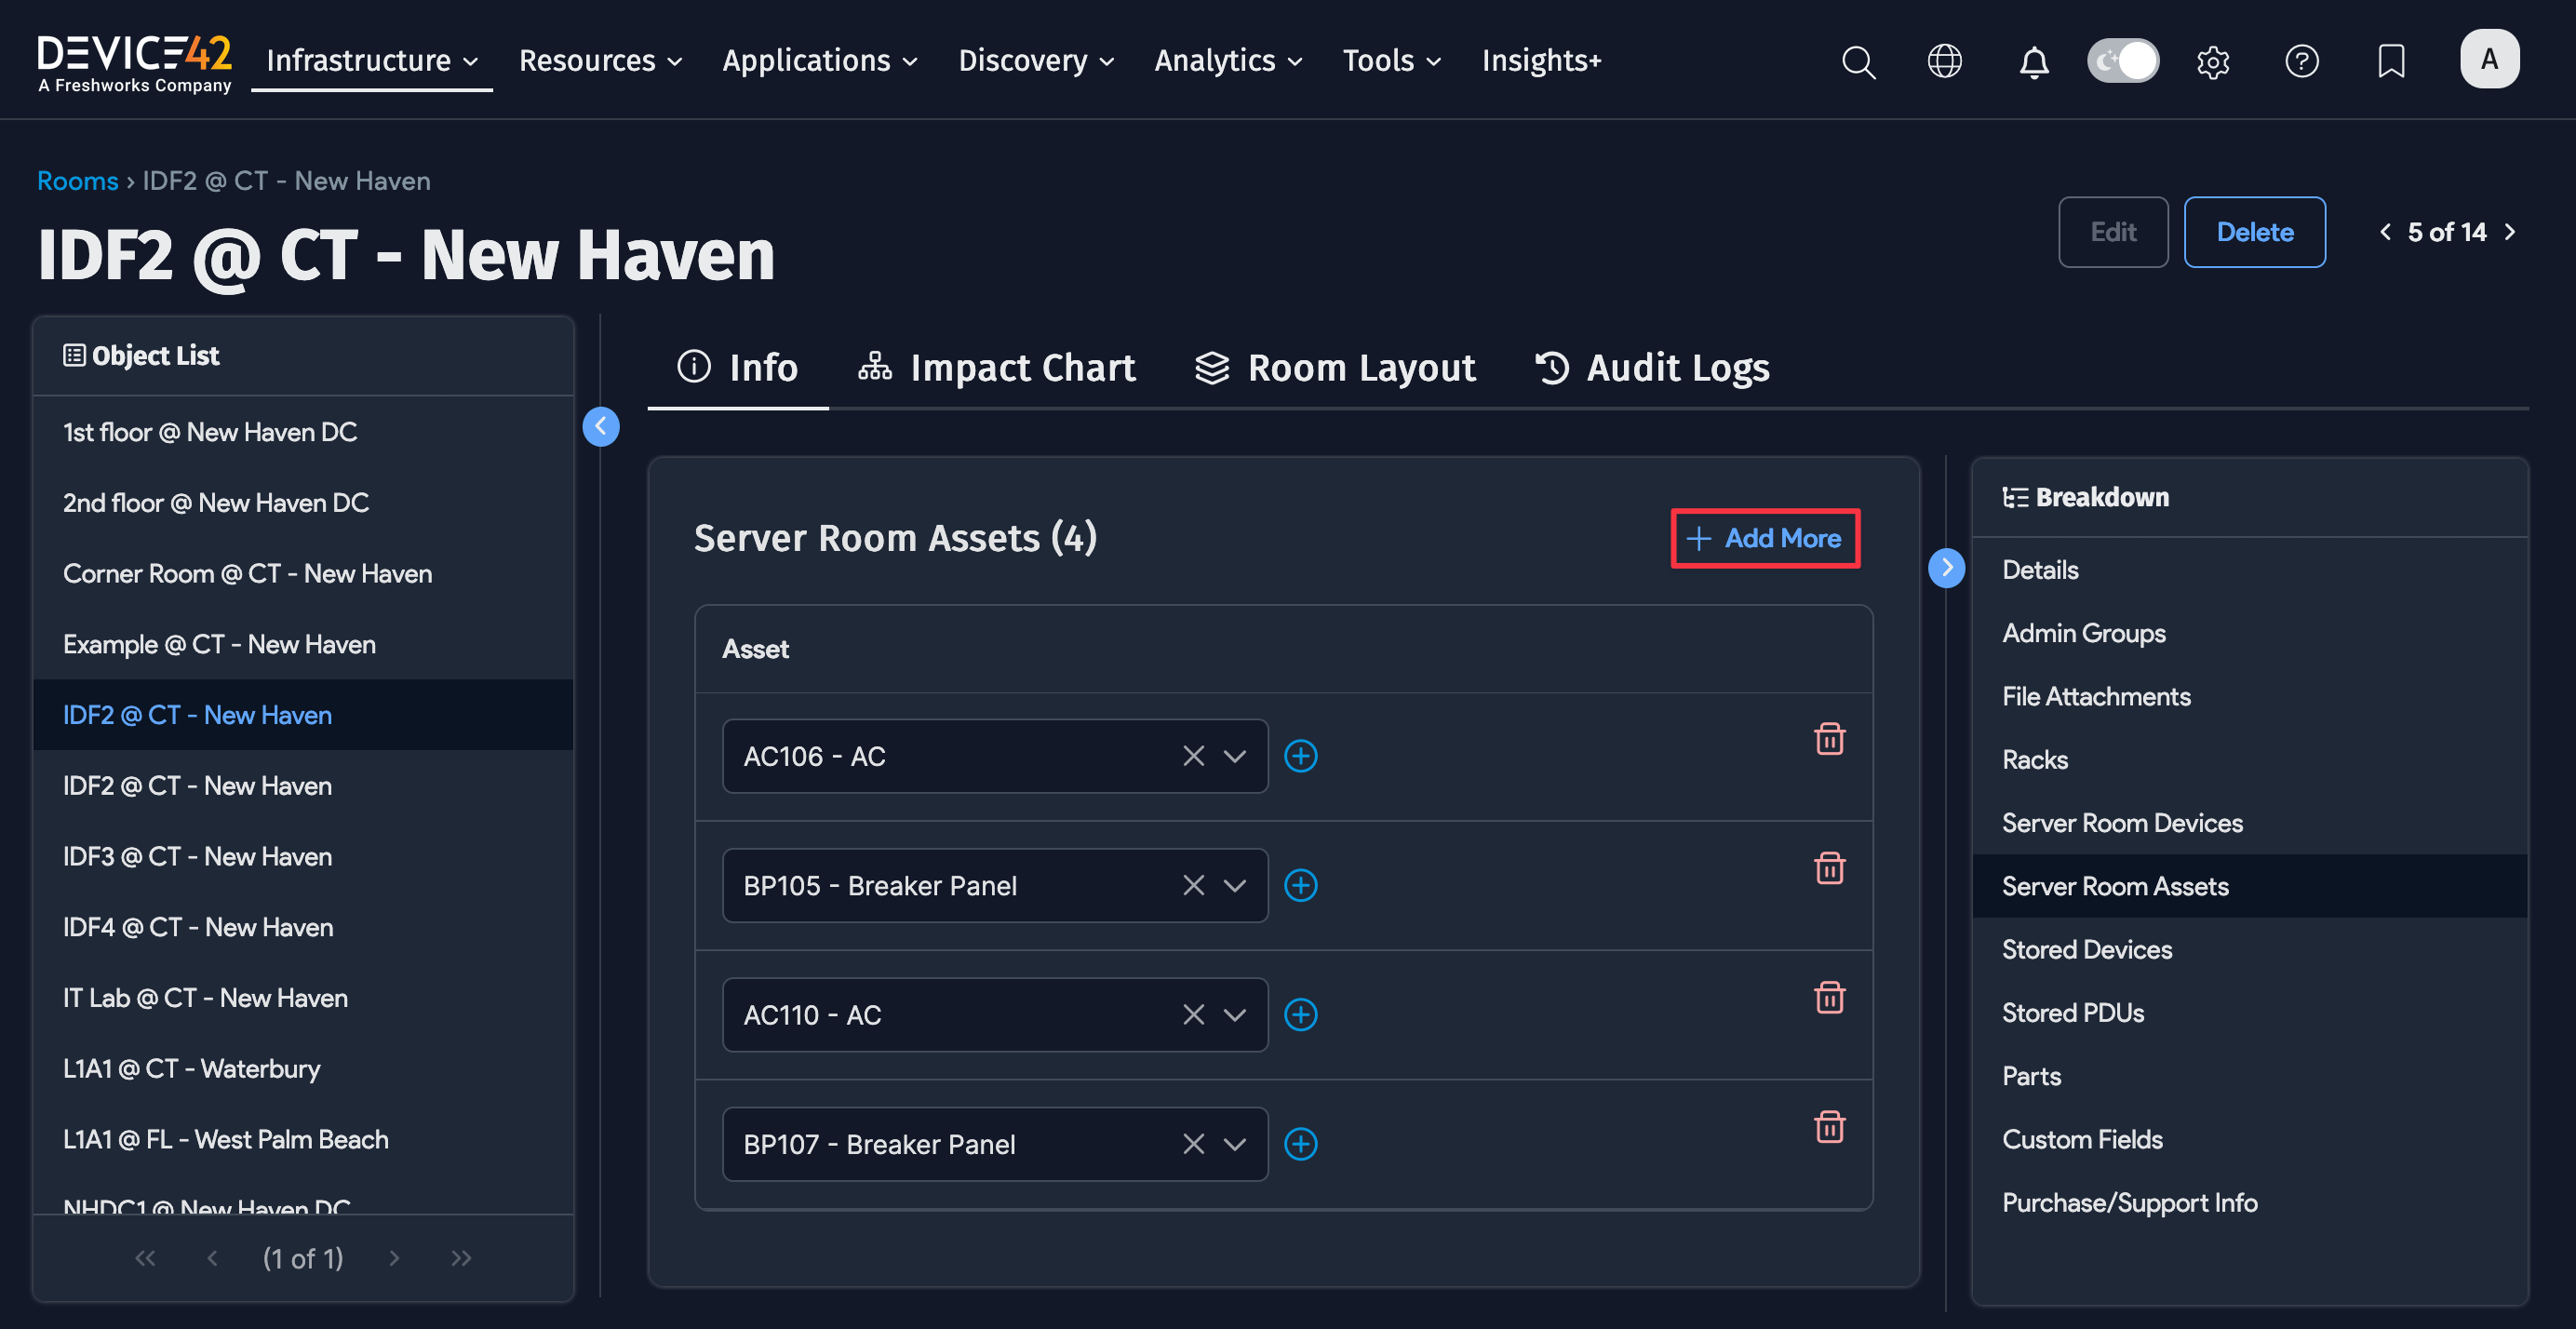
The right Object List panel displays the rooms that were included in the Rooms list view – the previous screen you were on when you clicked the room name - with whichever filters were applied. If your user account does not have permission to view buildings, you won't see "@ - Building" next to the room name.
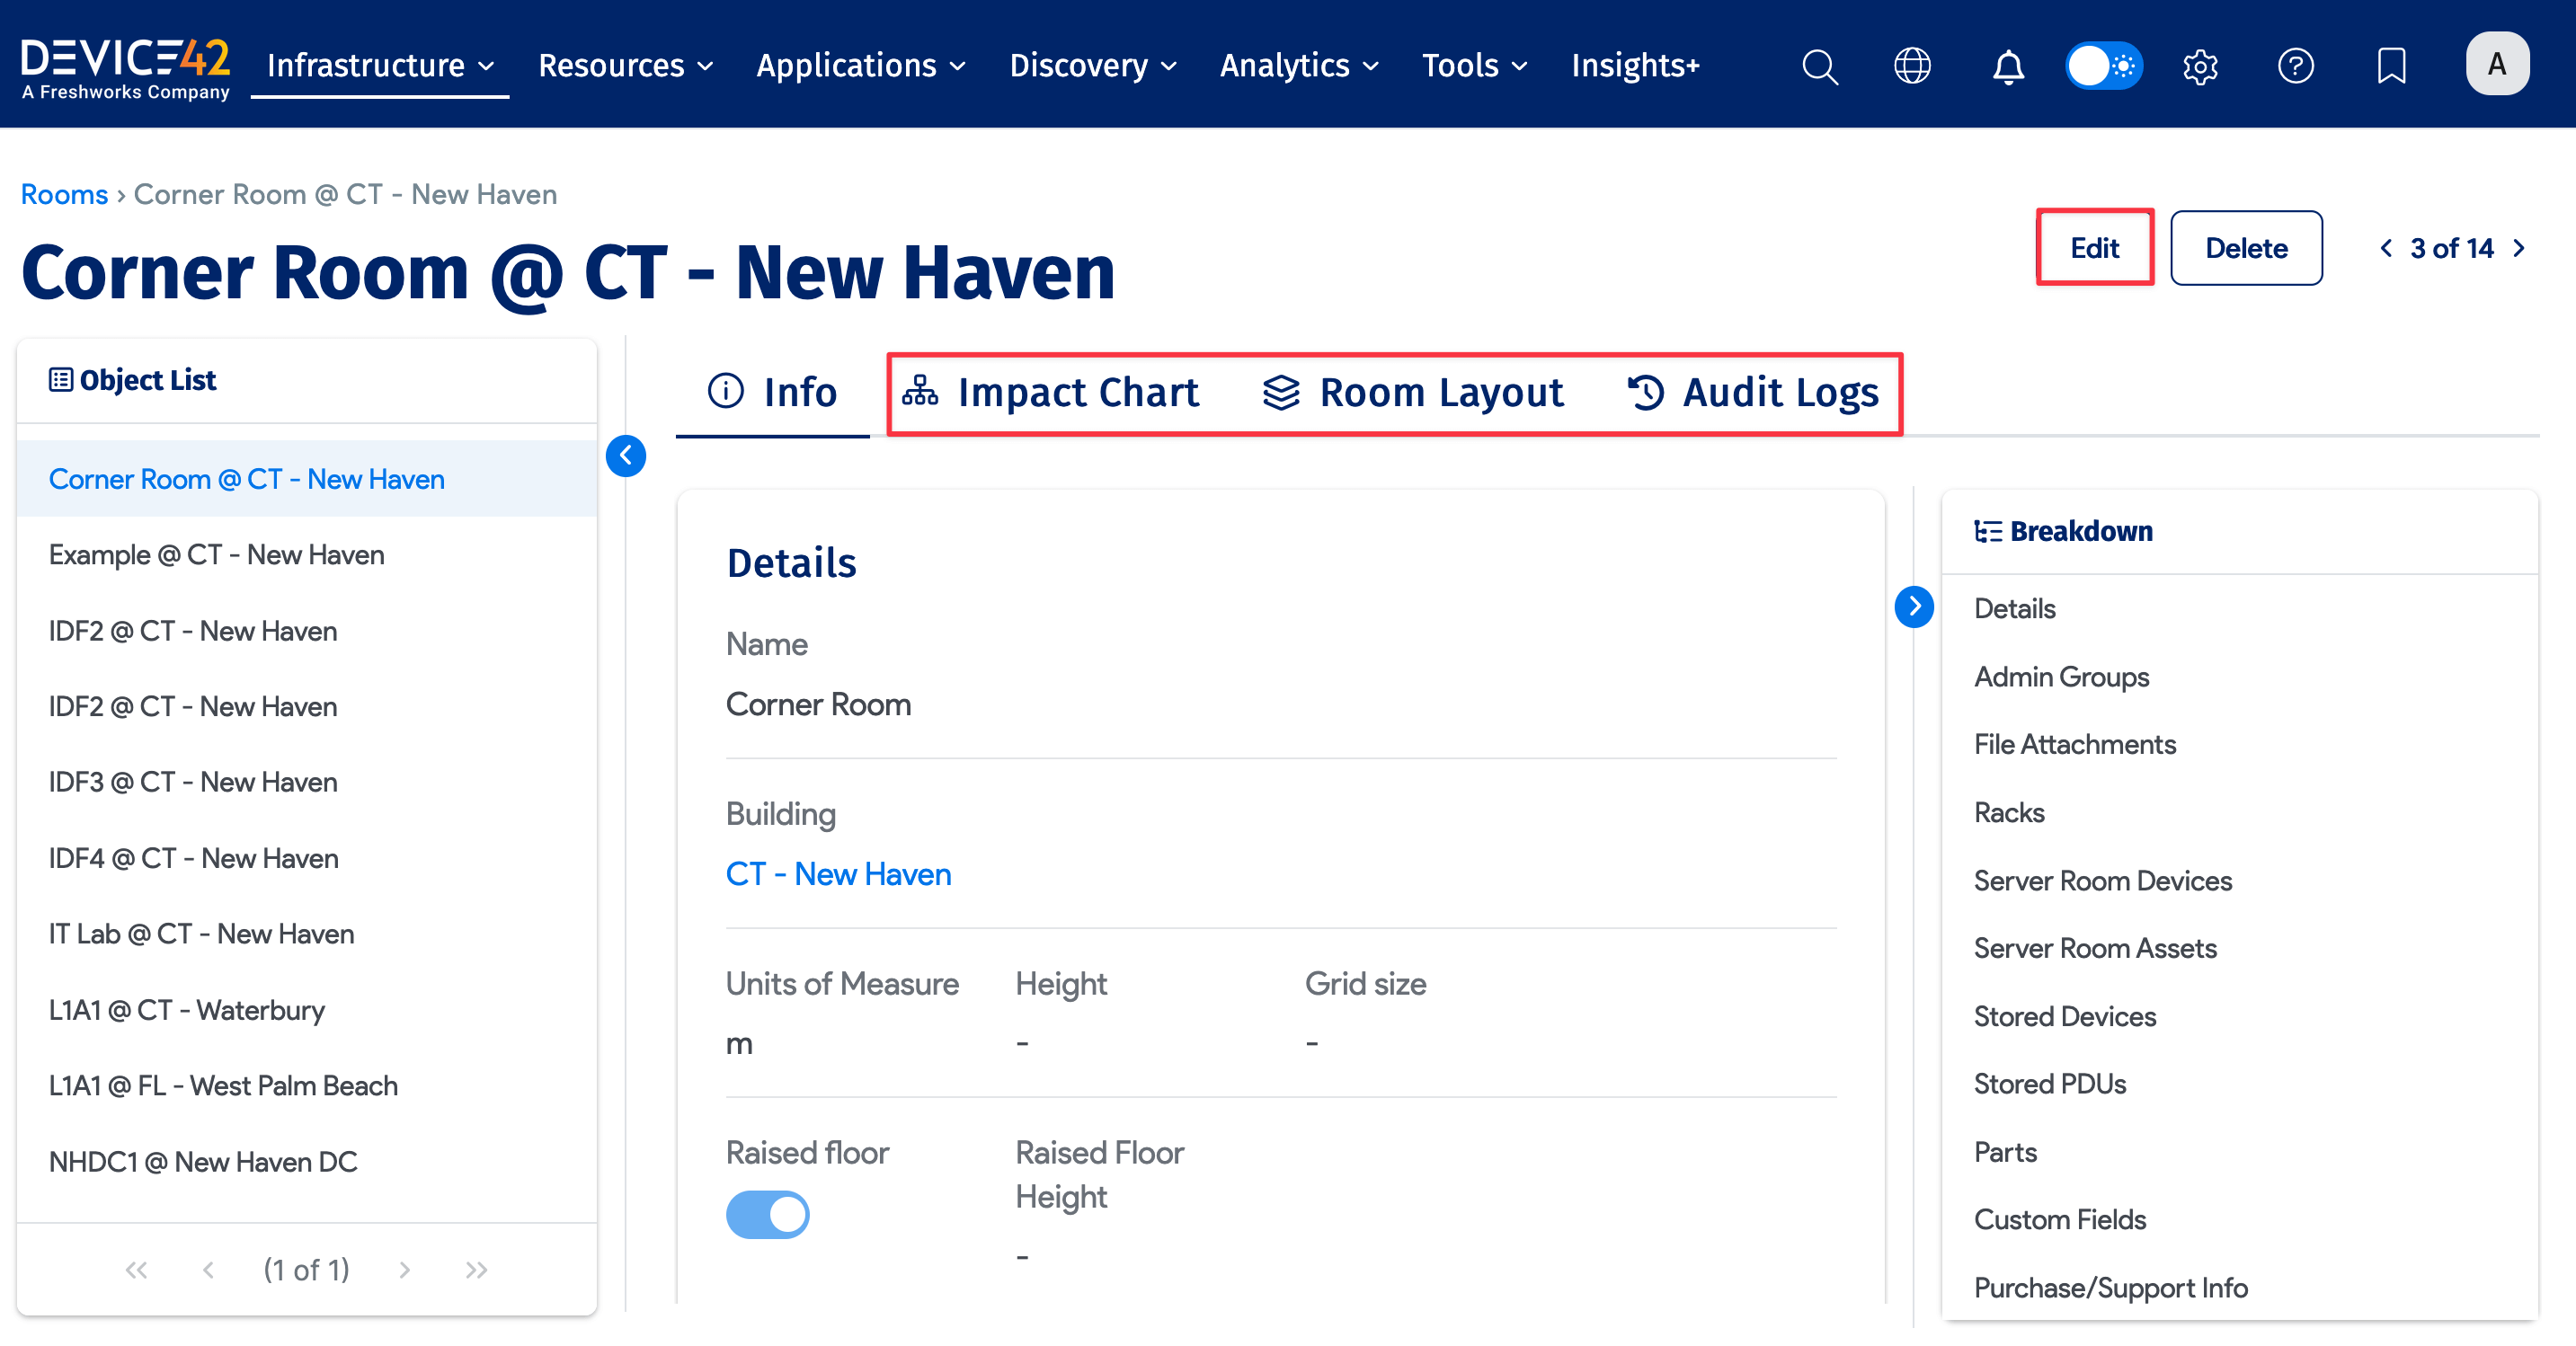
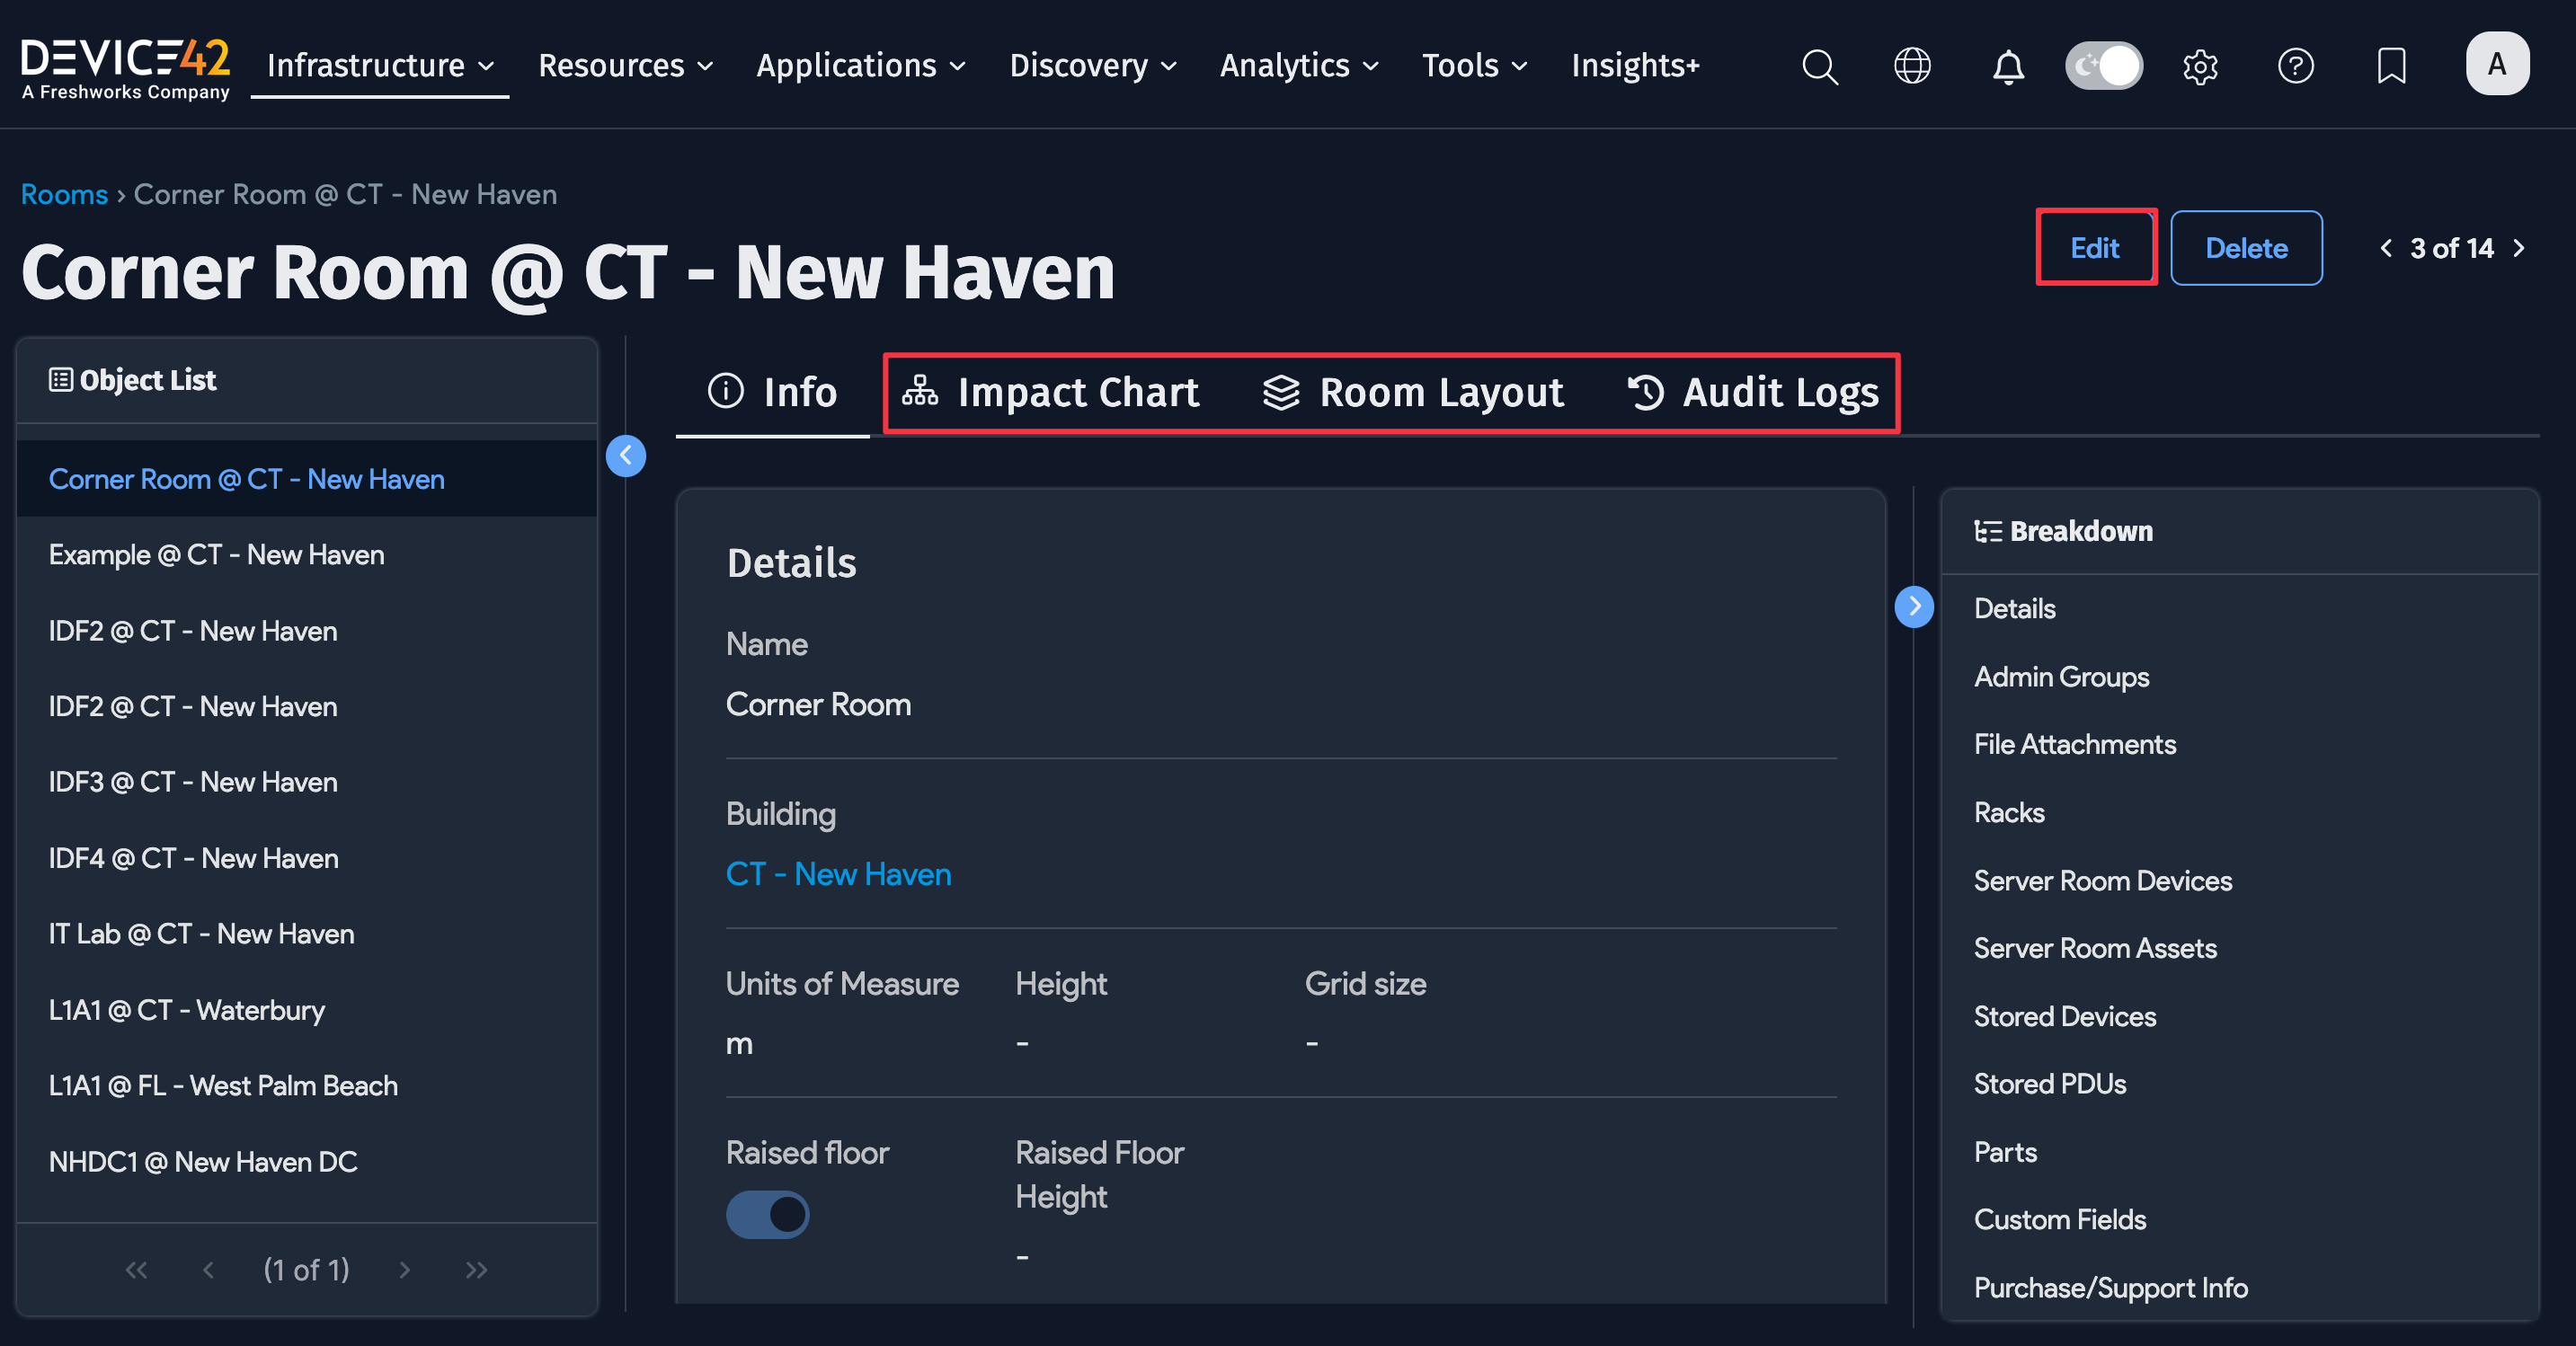
Navigate between sections, including the following, using the left Breakdown panel:
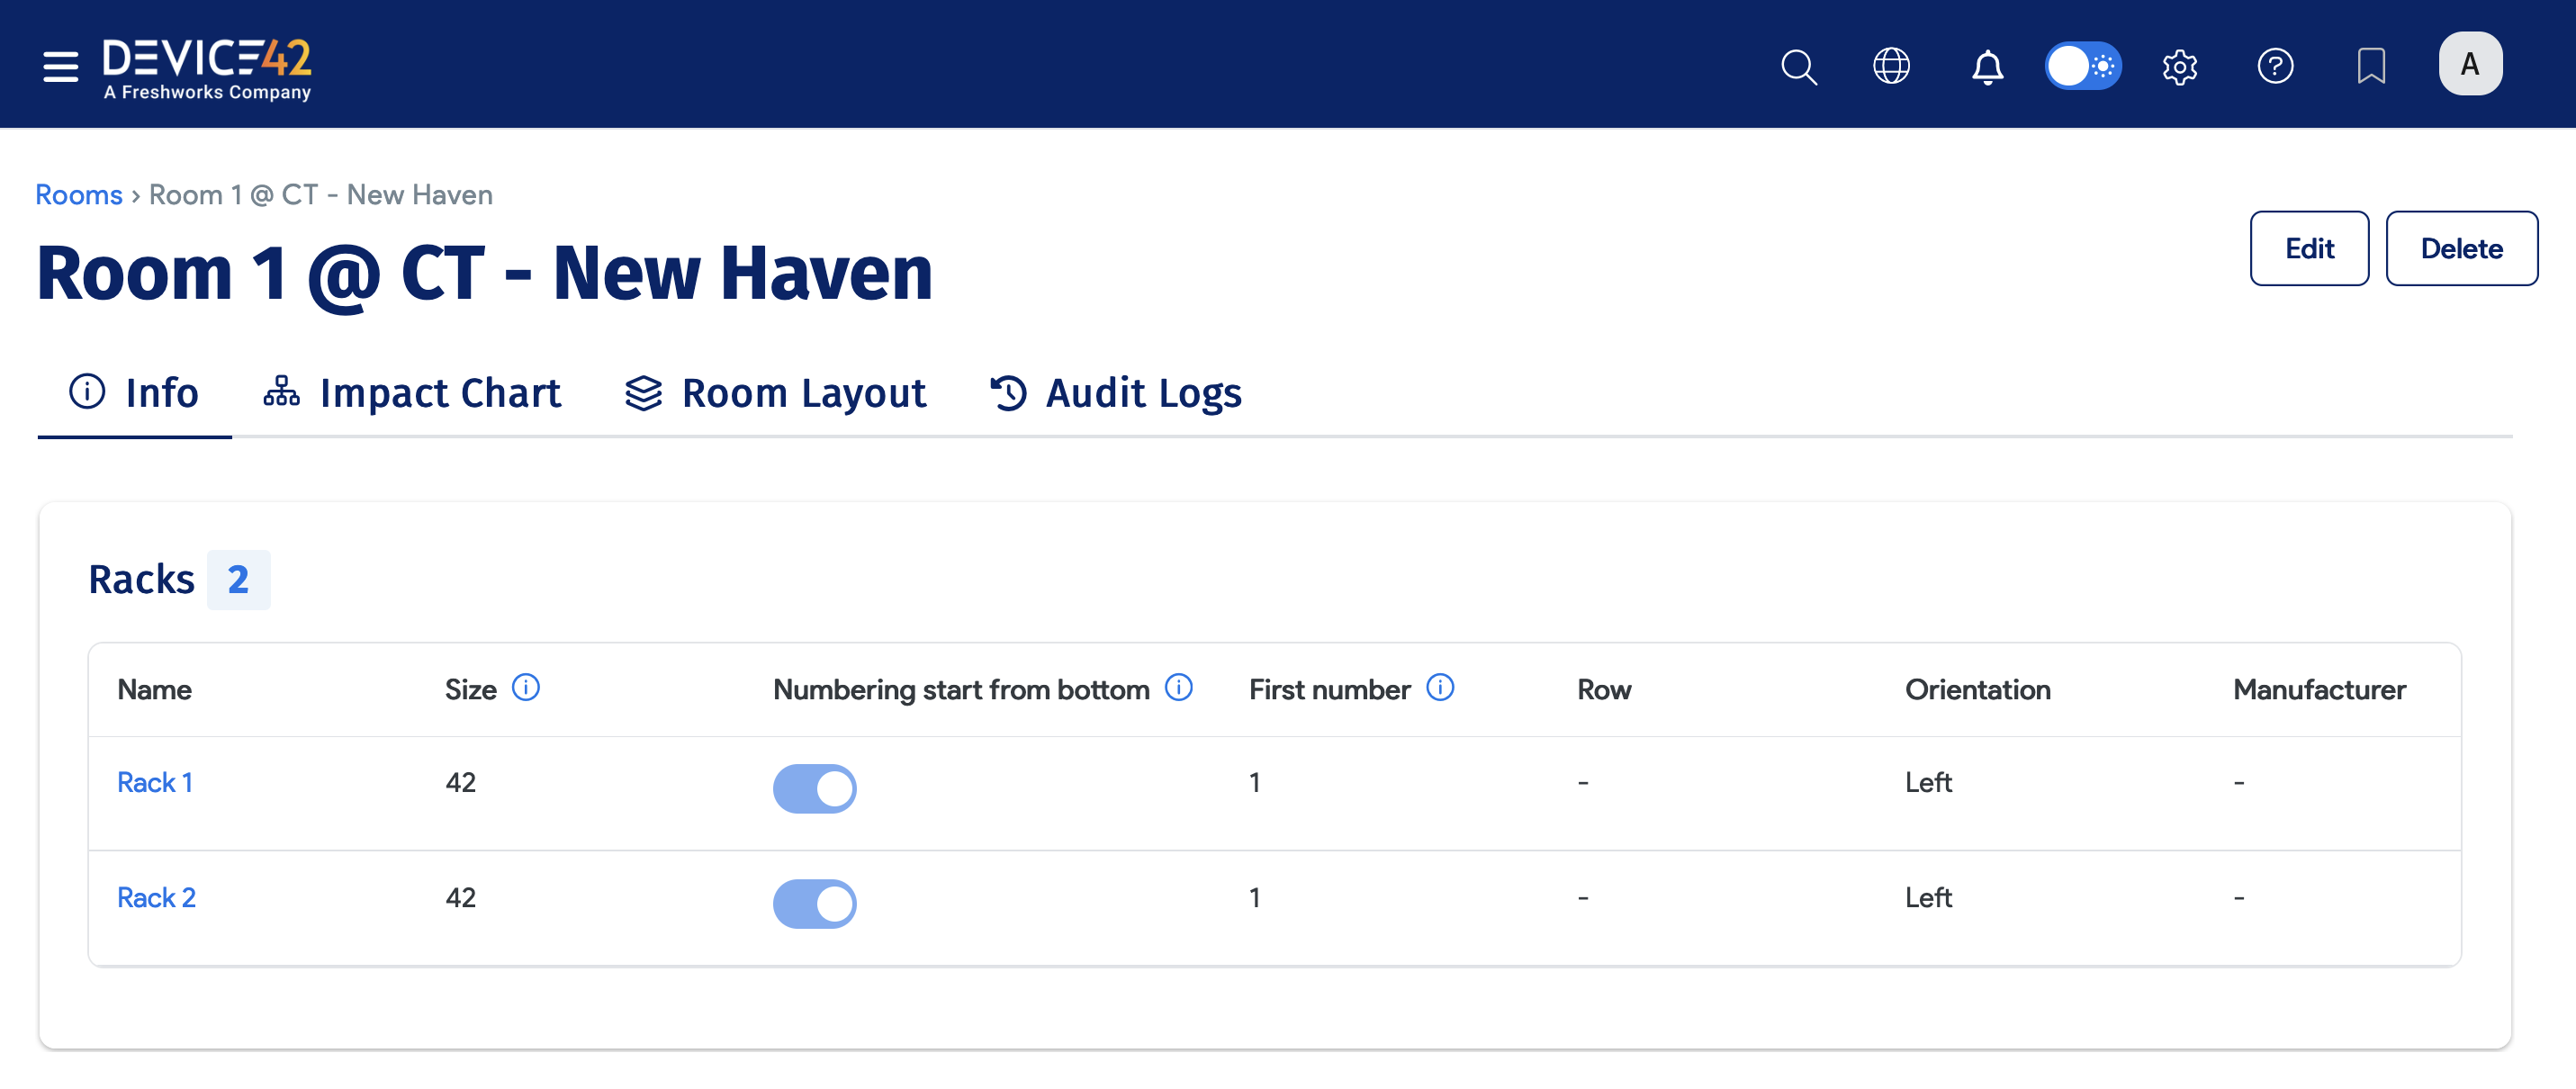
- Racks: View basic rack info, click a rack name to access the rack details, assign a row number to a rack, or add a new rack.
- Devices: View basic info about devices (like CRAC and UPS), click a device name to access the device details, or add a new device.
- Assets: View basic info about assets (like breaker panels and DMARC locations), click an asset name to access the asset details, or add a new asset.
The room view has clickable links to the Racks associated with it. You can click Edit to add or remove racks from a room.
Associate Assets to a Room
You can associate assets with server rooms from the Main Appliance or via the API (see the Rooms API doc).
-
The association is bi-directional; the asset is visible in the room details, and the room is visible in the asset details.
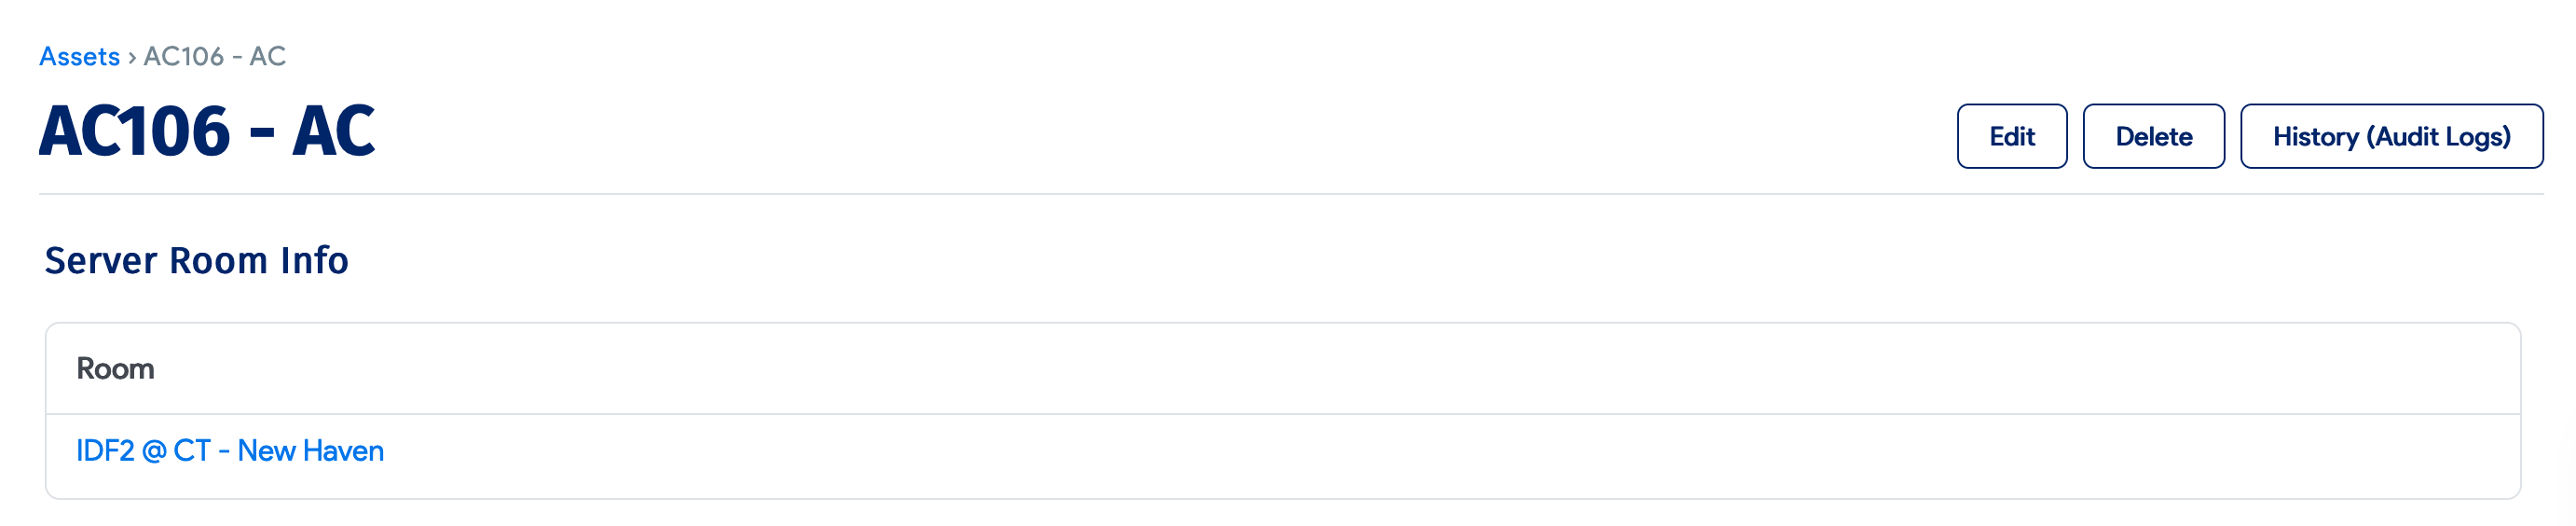
-
The assets associated with a room are visible in the room layout view. However, you cannot add assets to a room from the layout view.
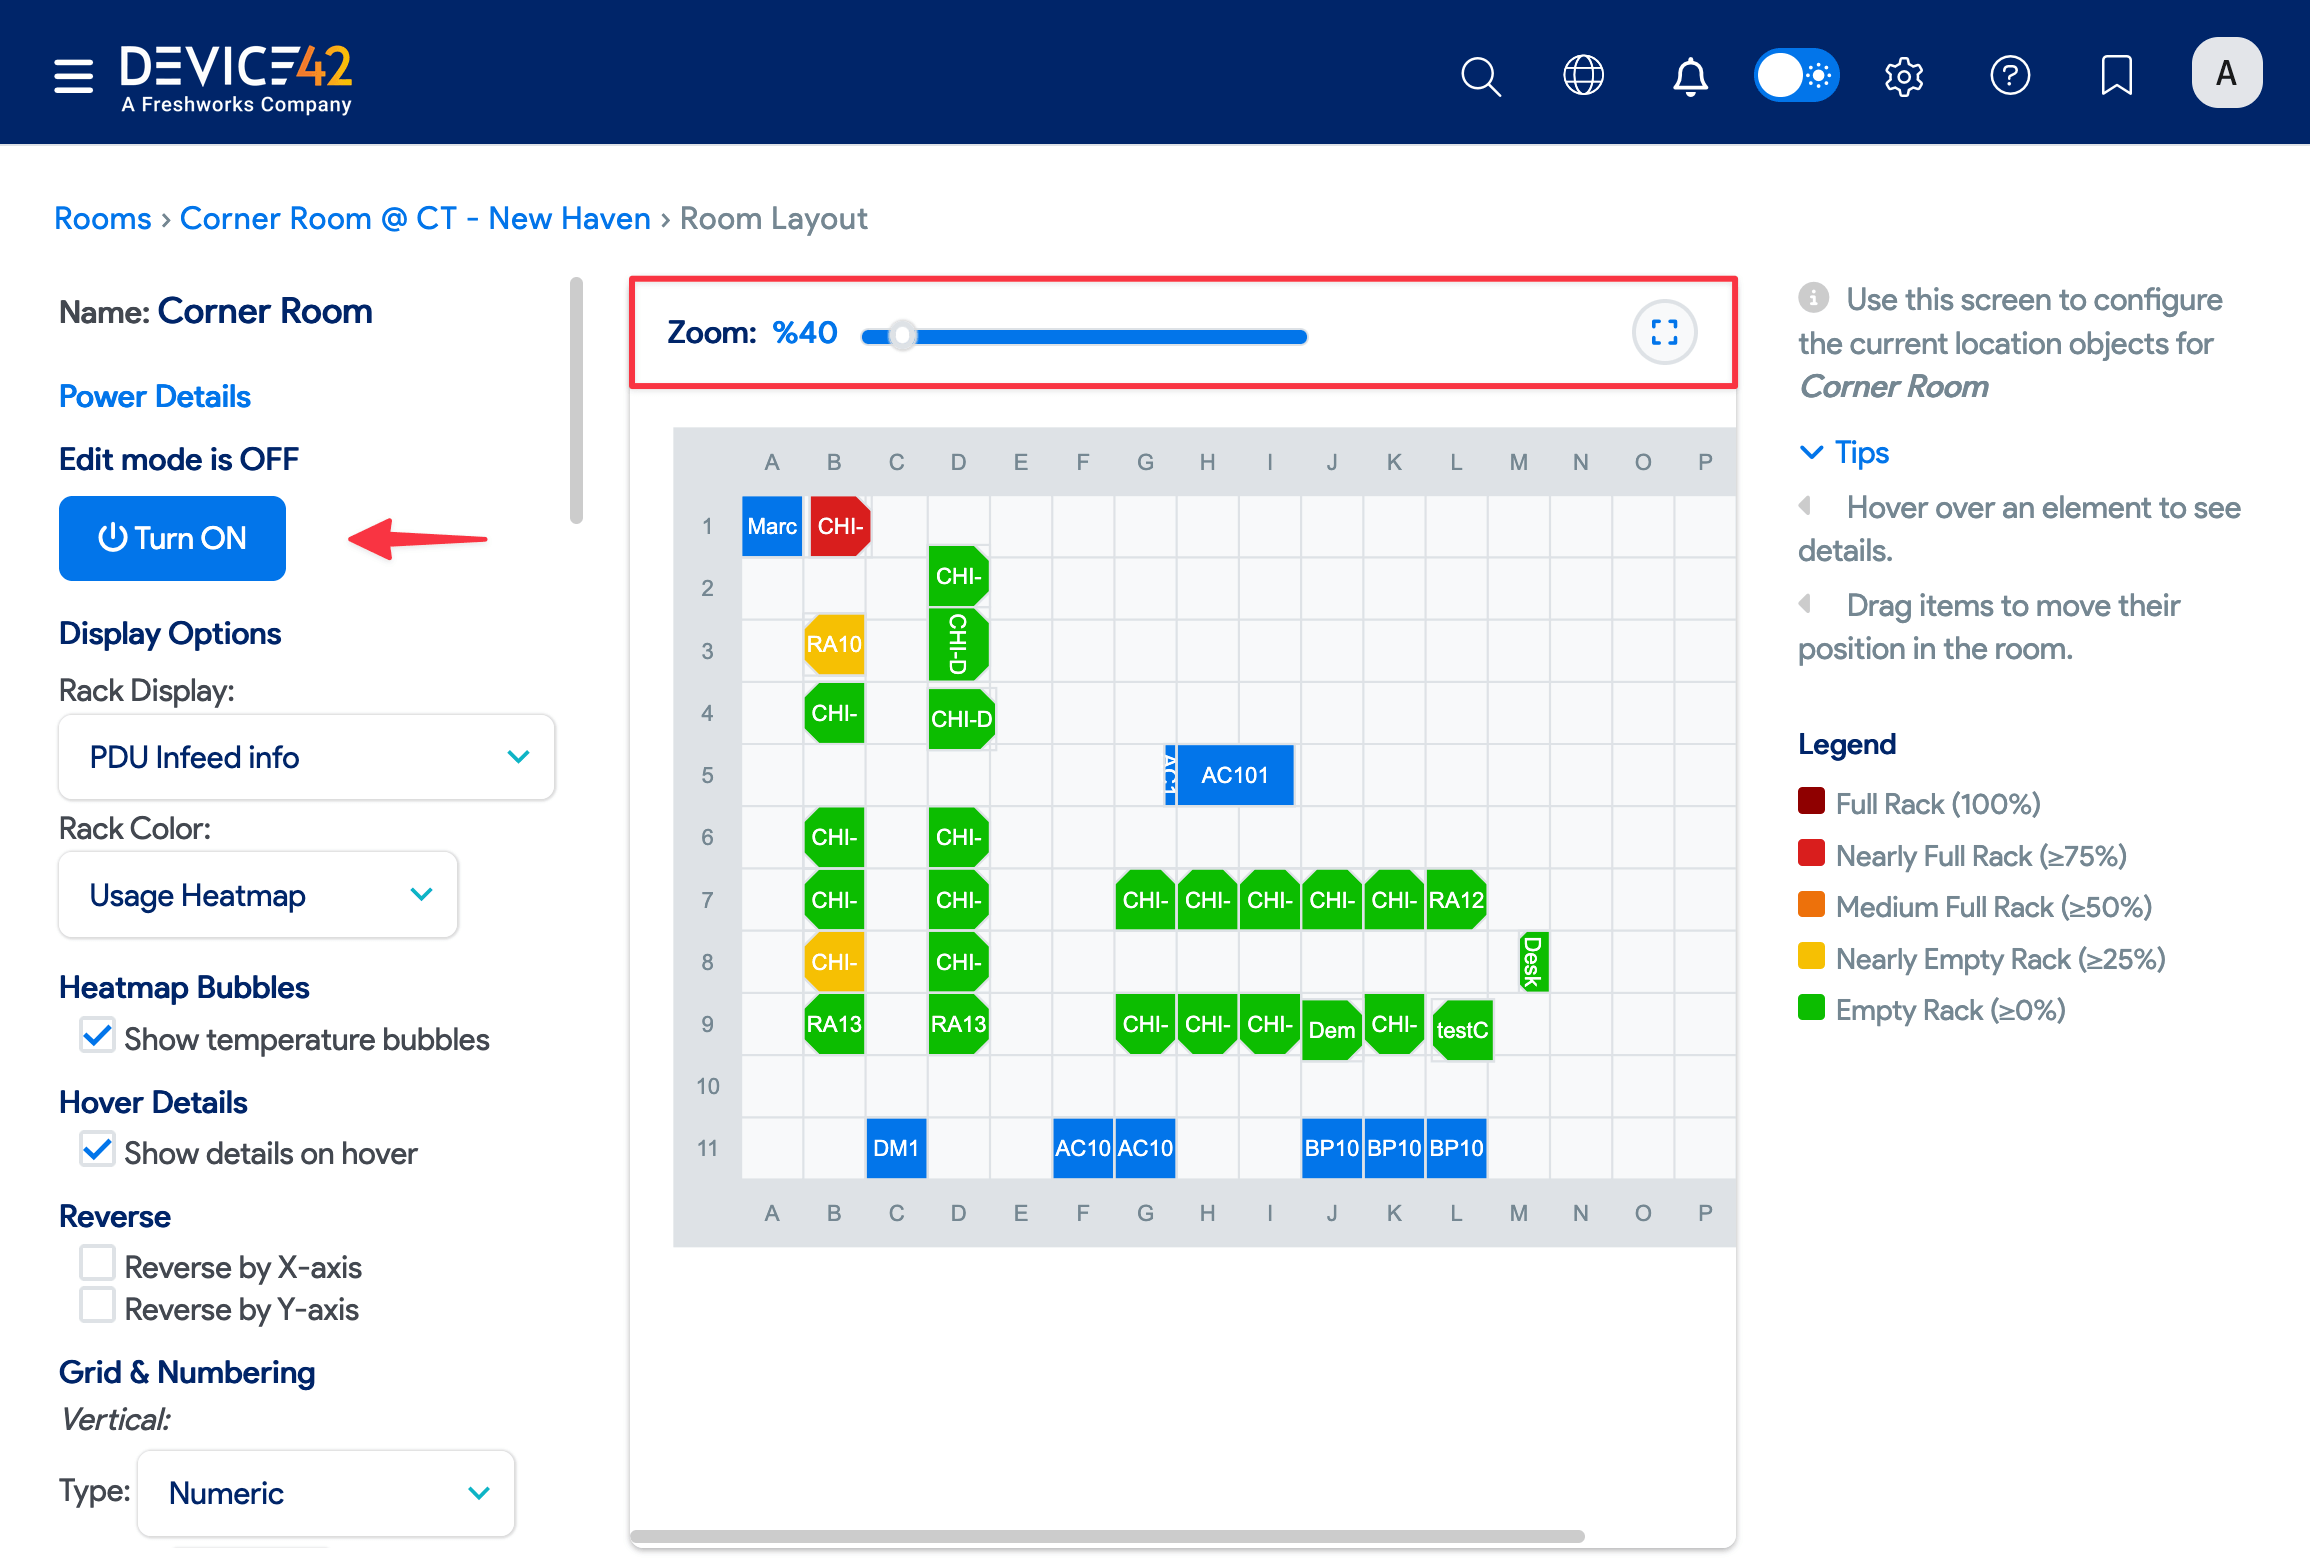
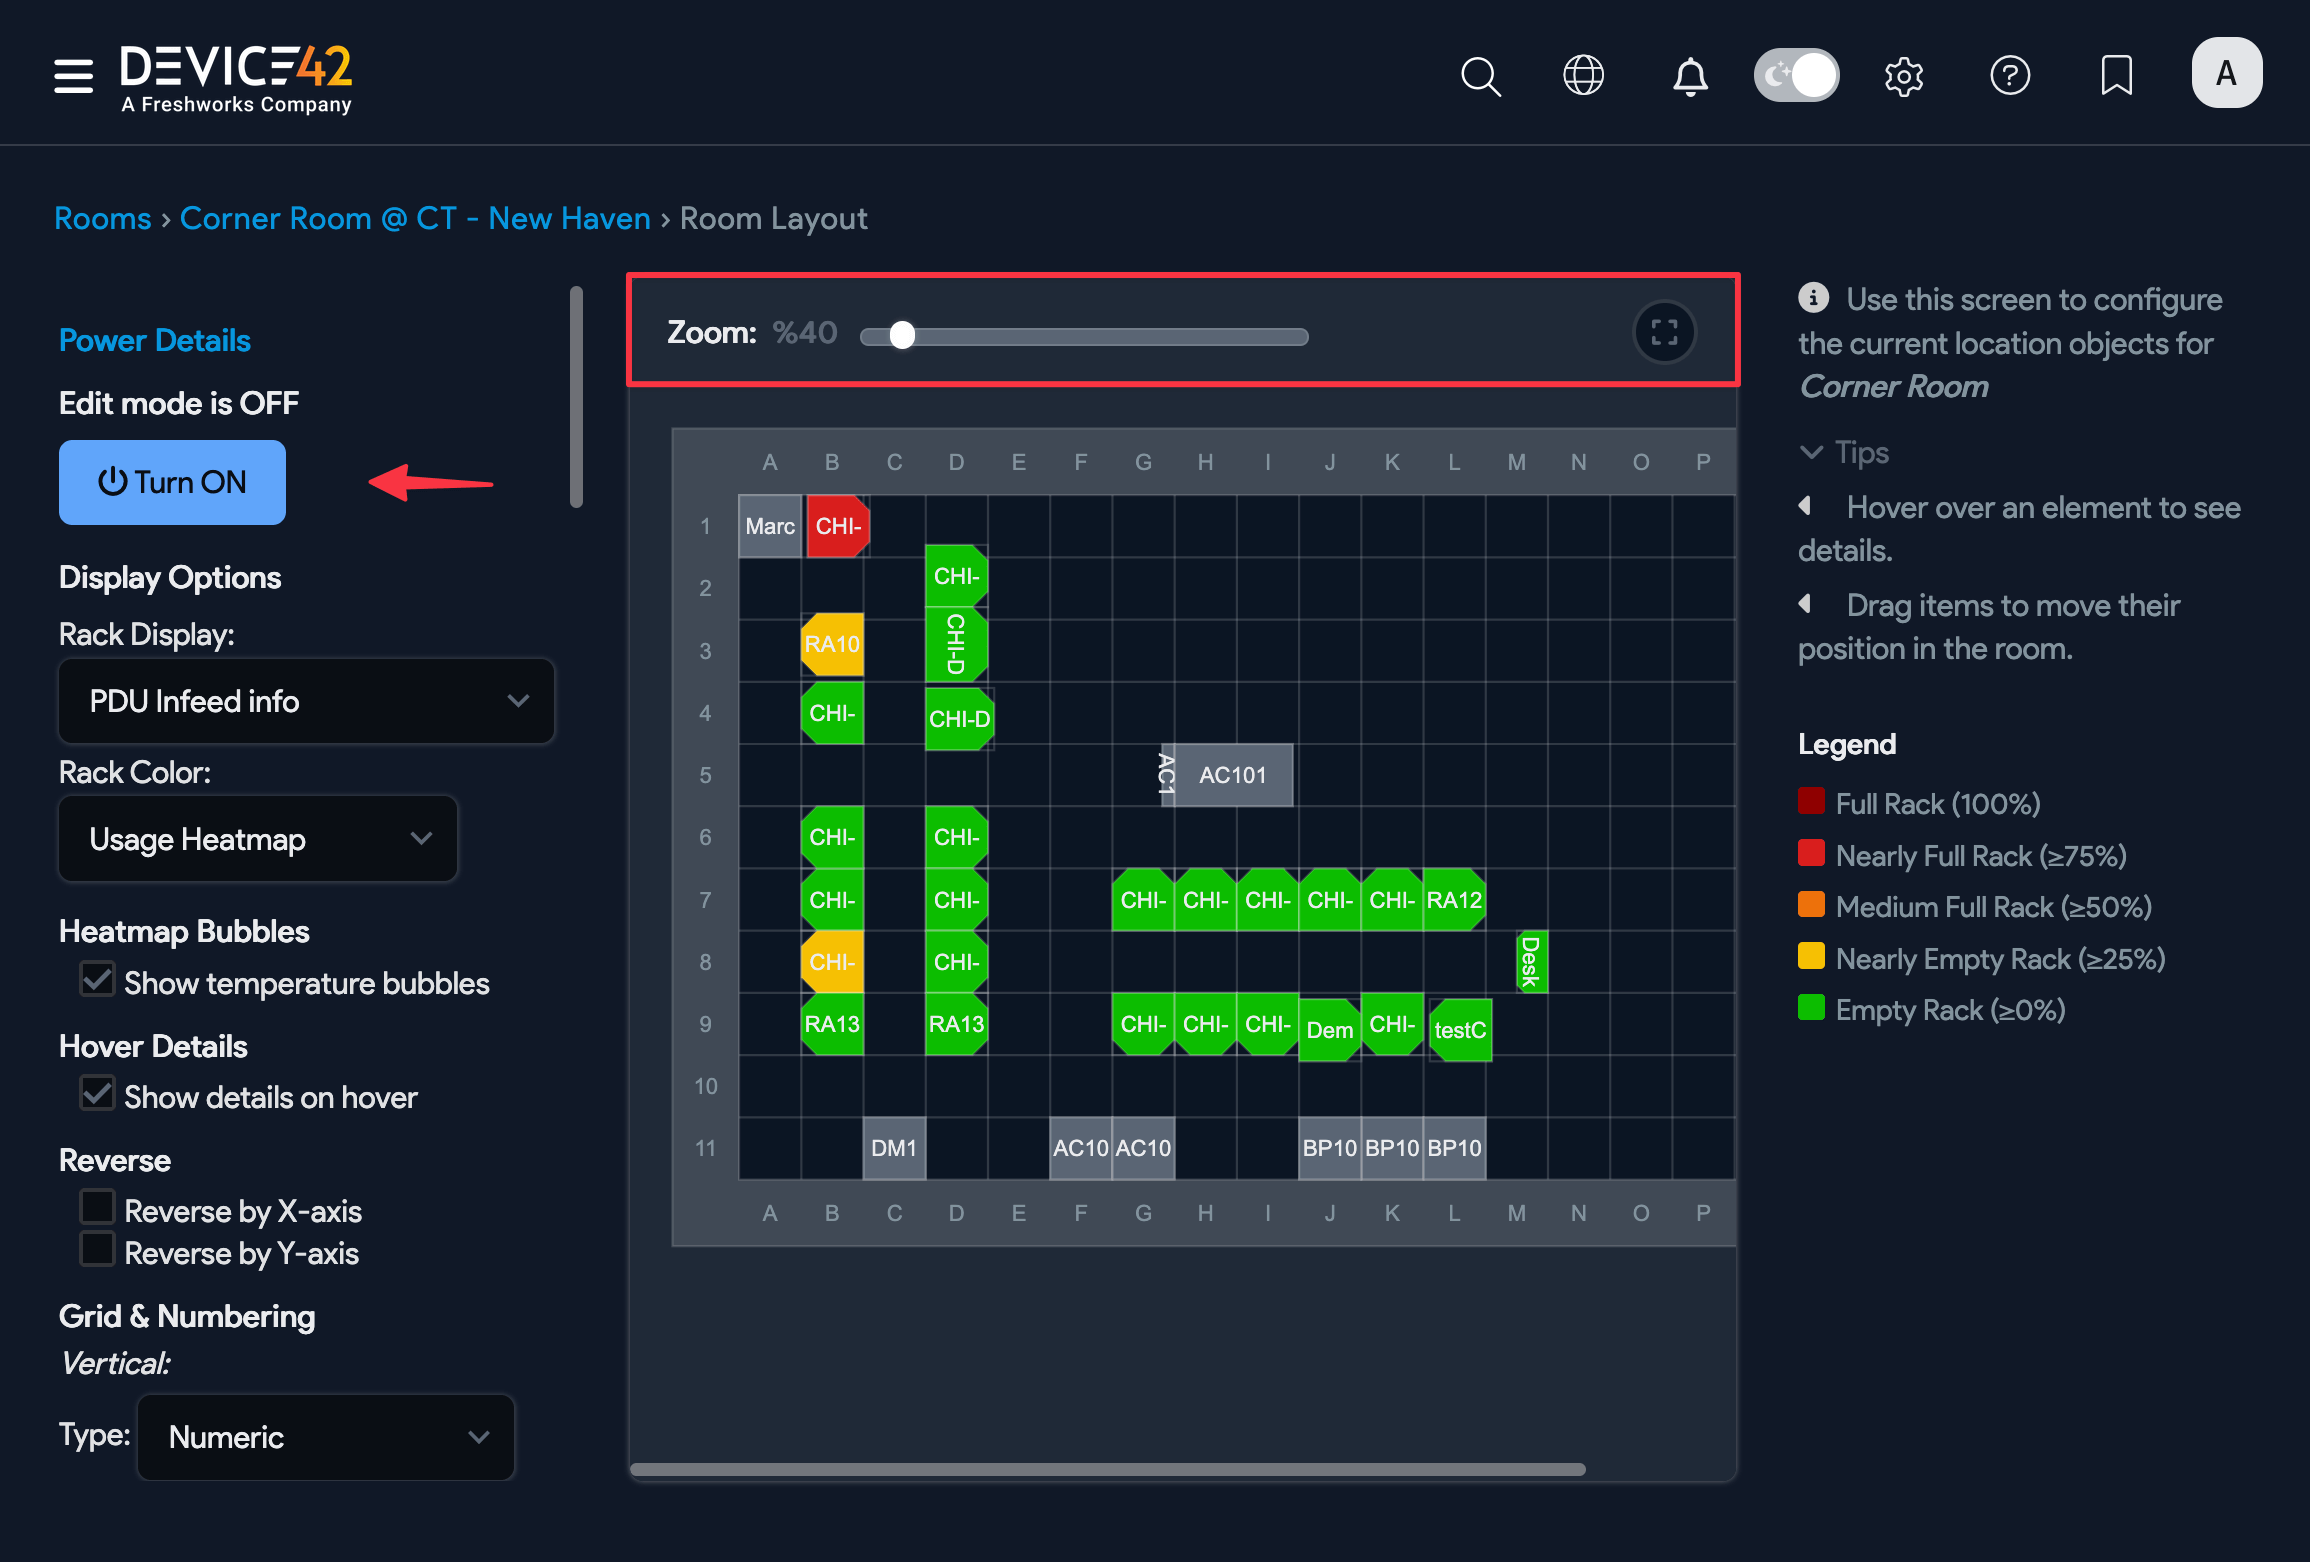
Room Layout View
Access a Room Layout view from a room's detailed view or using the Show link next to the room name on the Rooms list page.
Use the zoom slider to increase or decrease the display size of the layout. Switch editing mode to on by clicking Turn ON in the sidebar. Only users with the necessary permissions can edit a room layout.
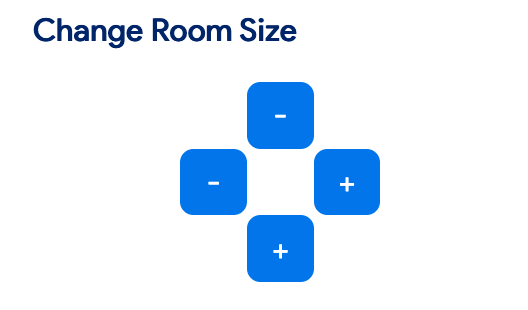
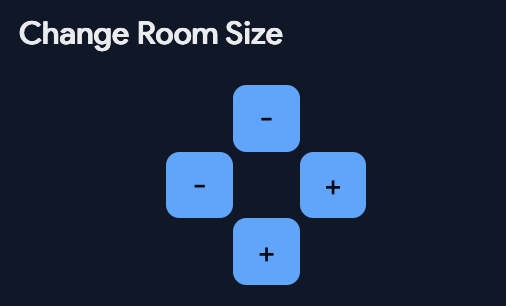
Room Layout Editing
You can change the shape and size of the room layout. Add or remove rows and columns using the + (plus) and - (minus) buttons located on the left panel.
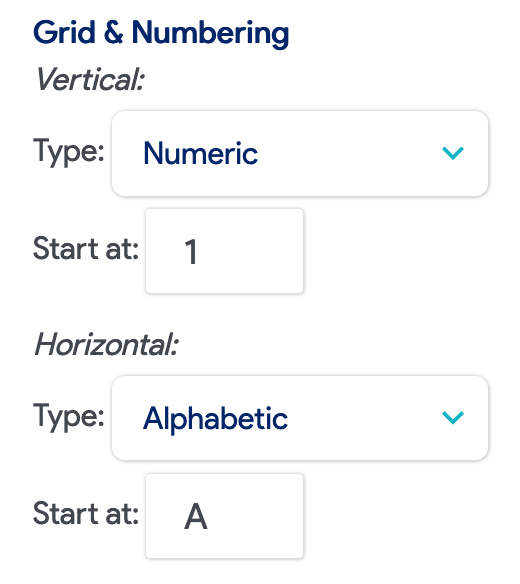
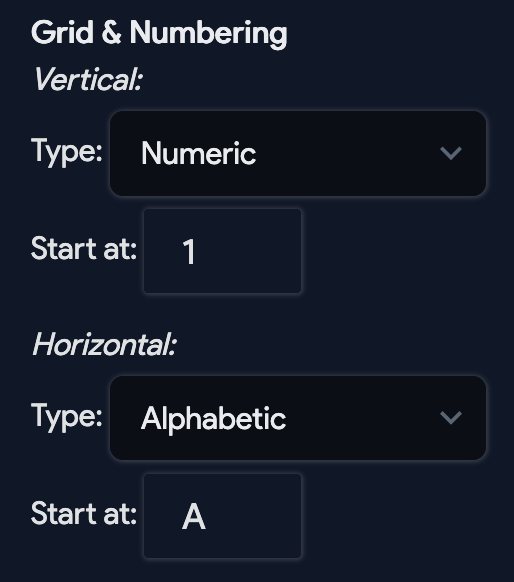
You can change the default row and column labeling sequence. Choose between numerical or alphabetical labeling and set the value to start with.
Object Layout Editing
You can add racks and objects to the layout, move them around, resize and rotate them.
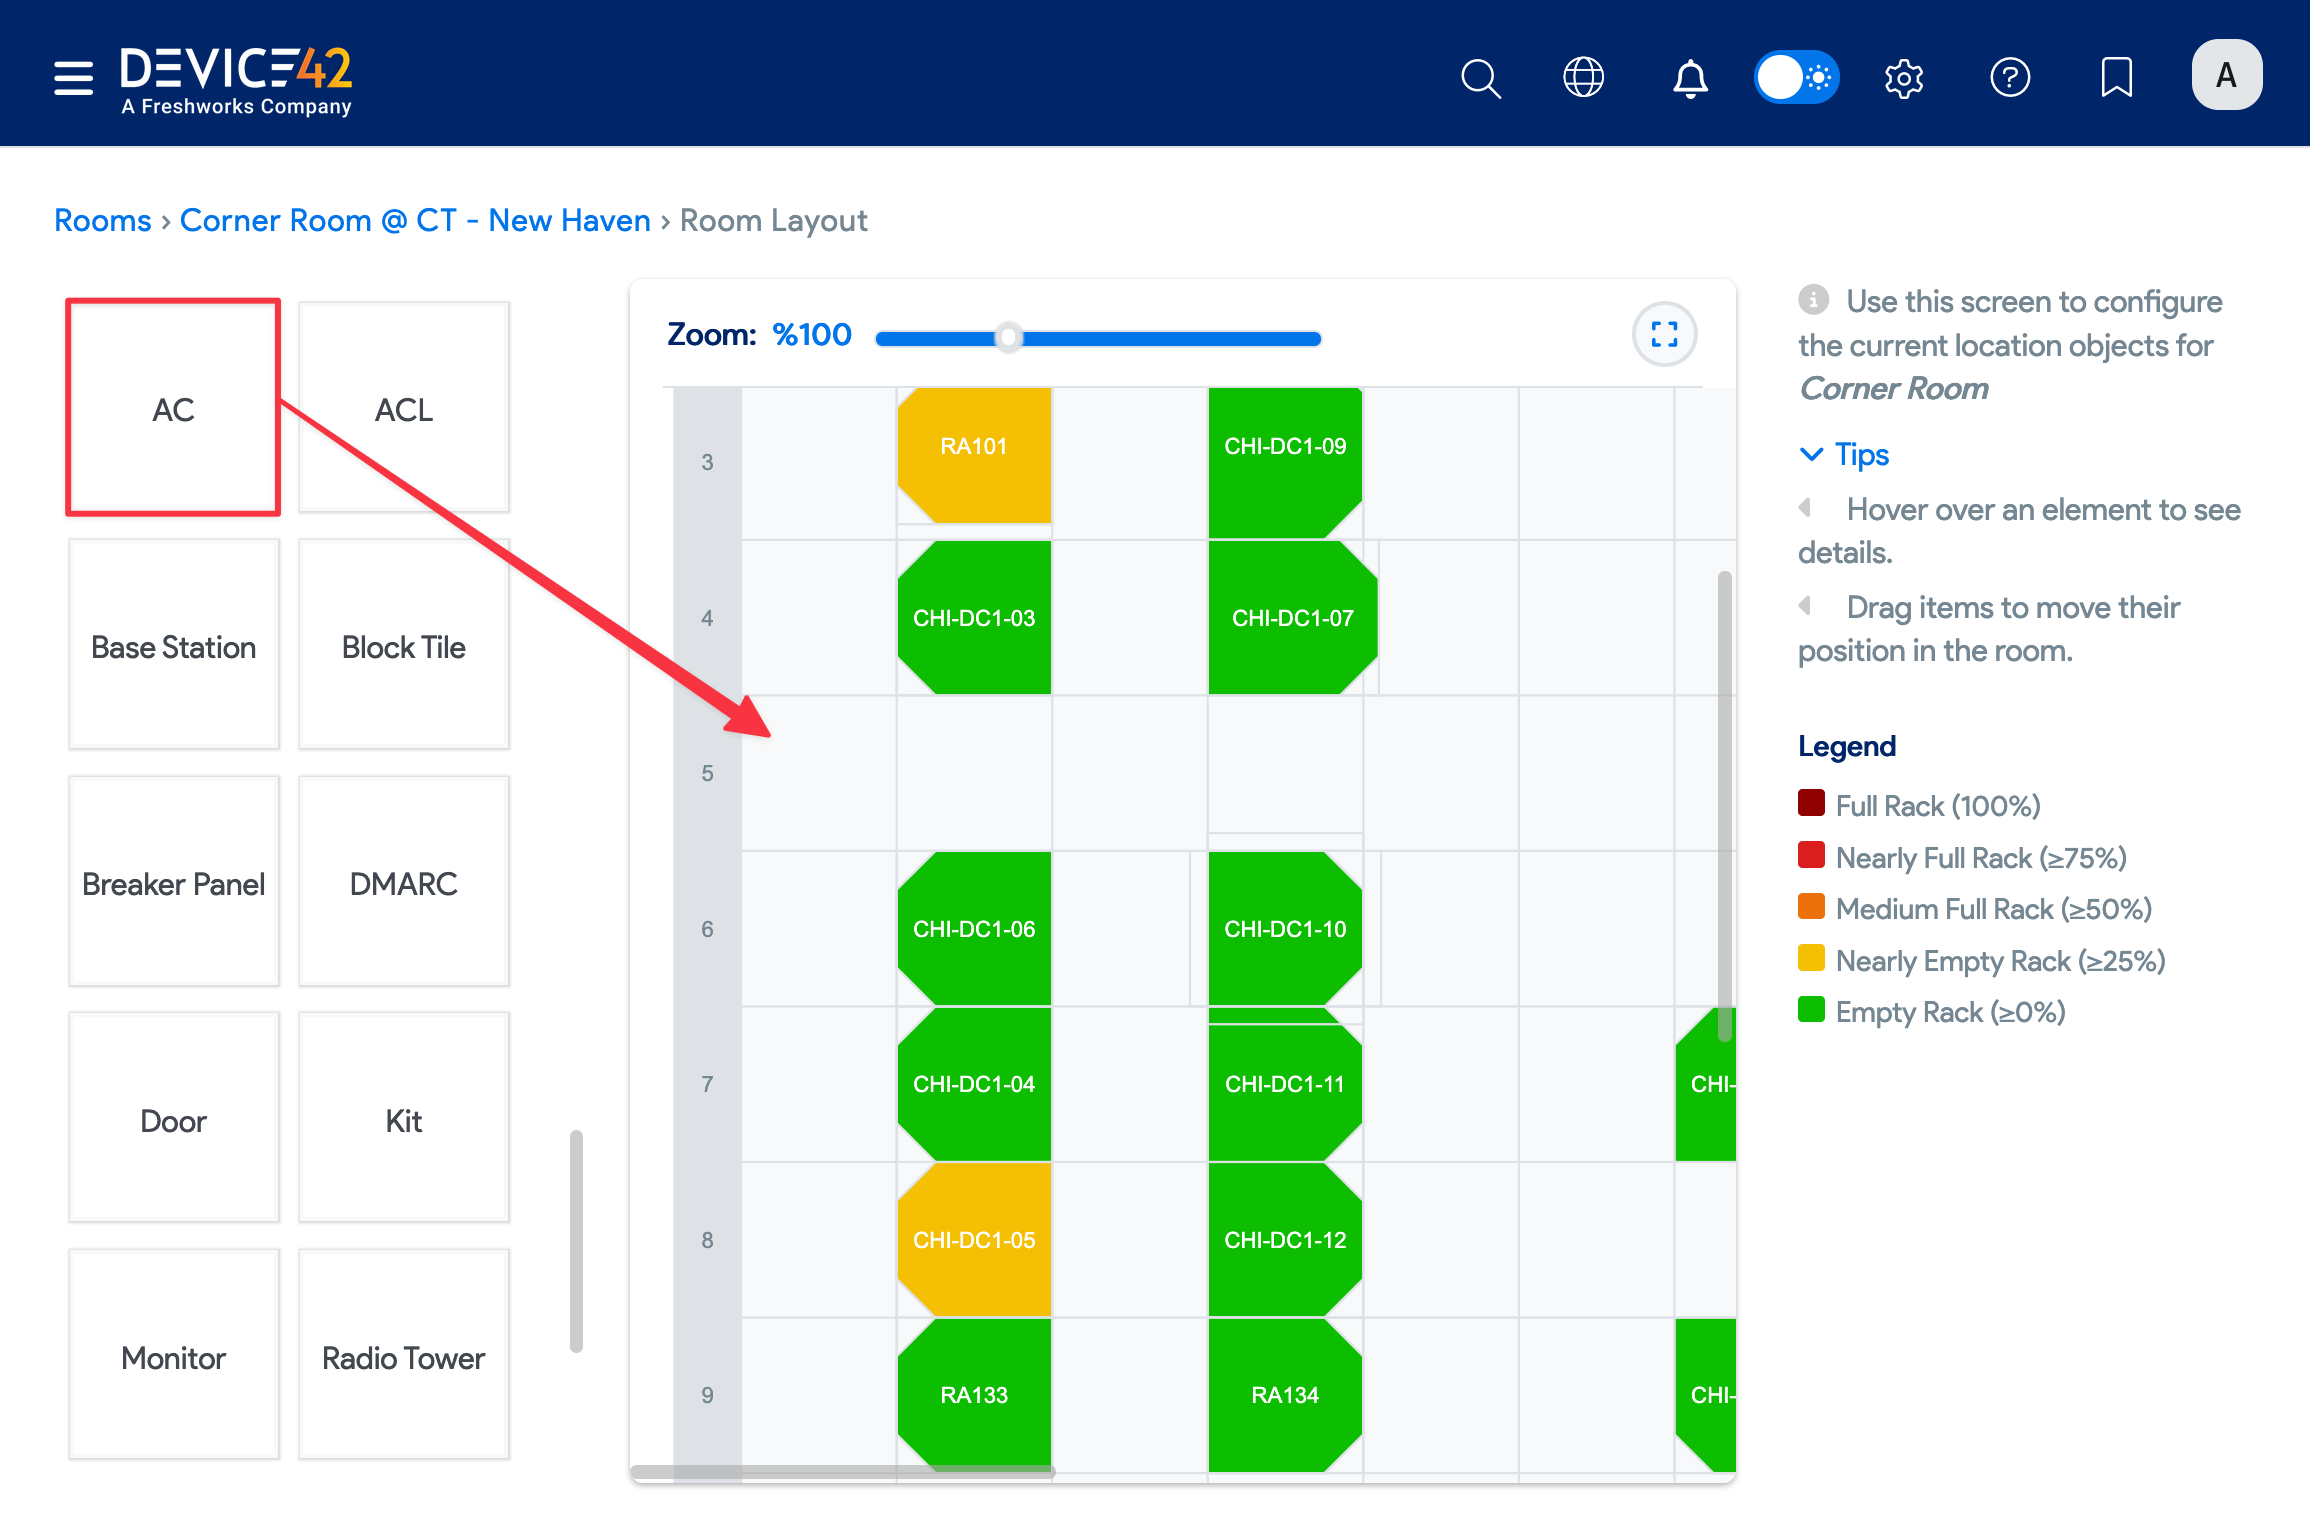
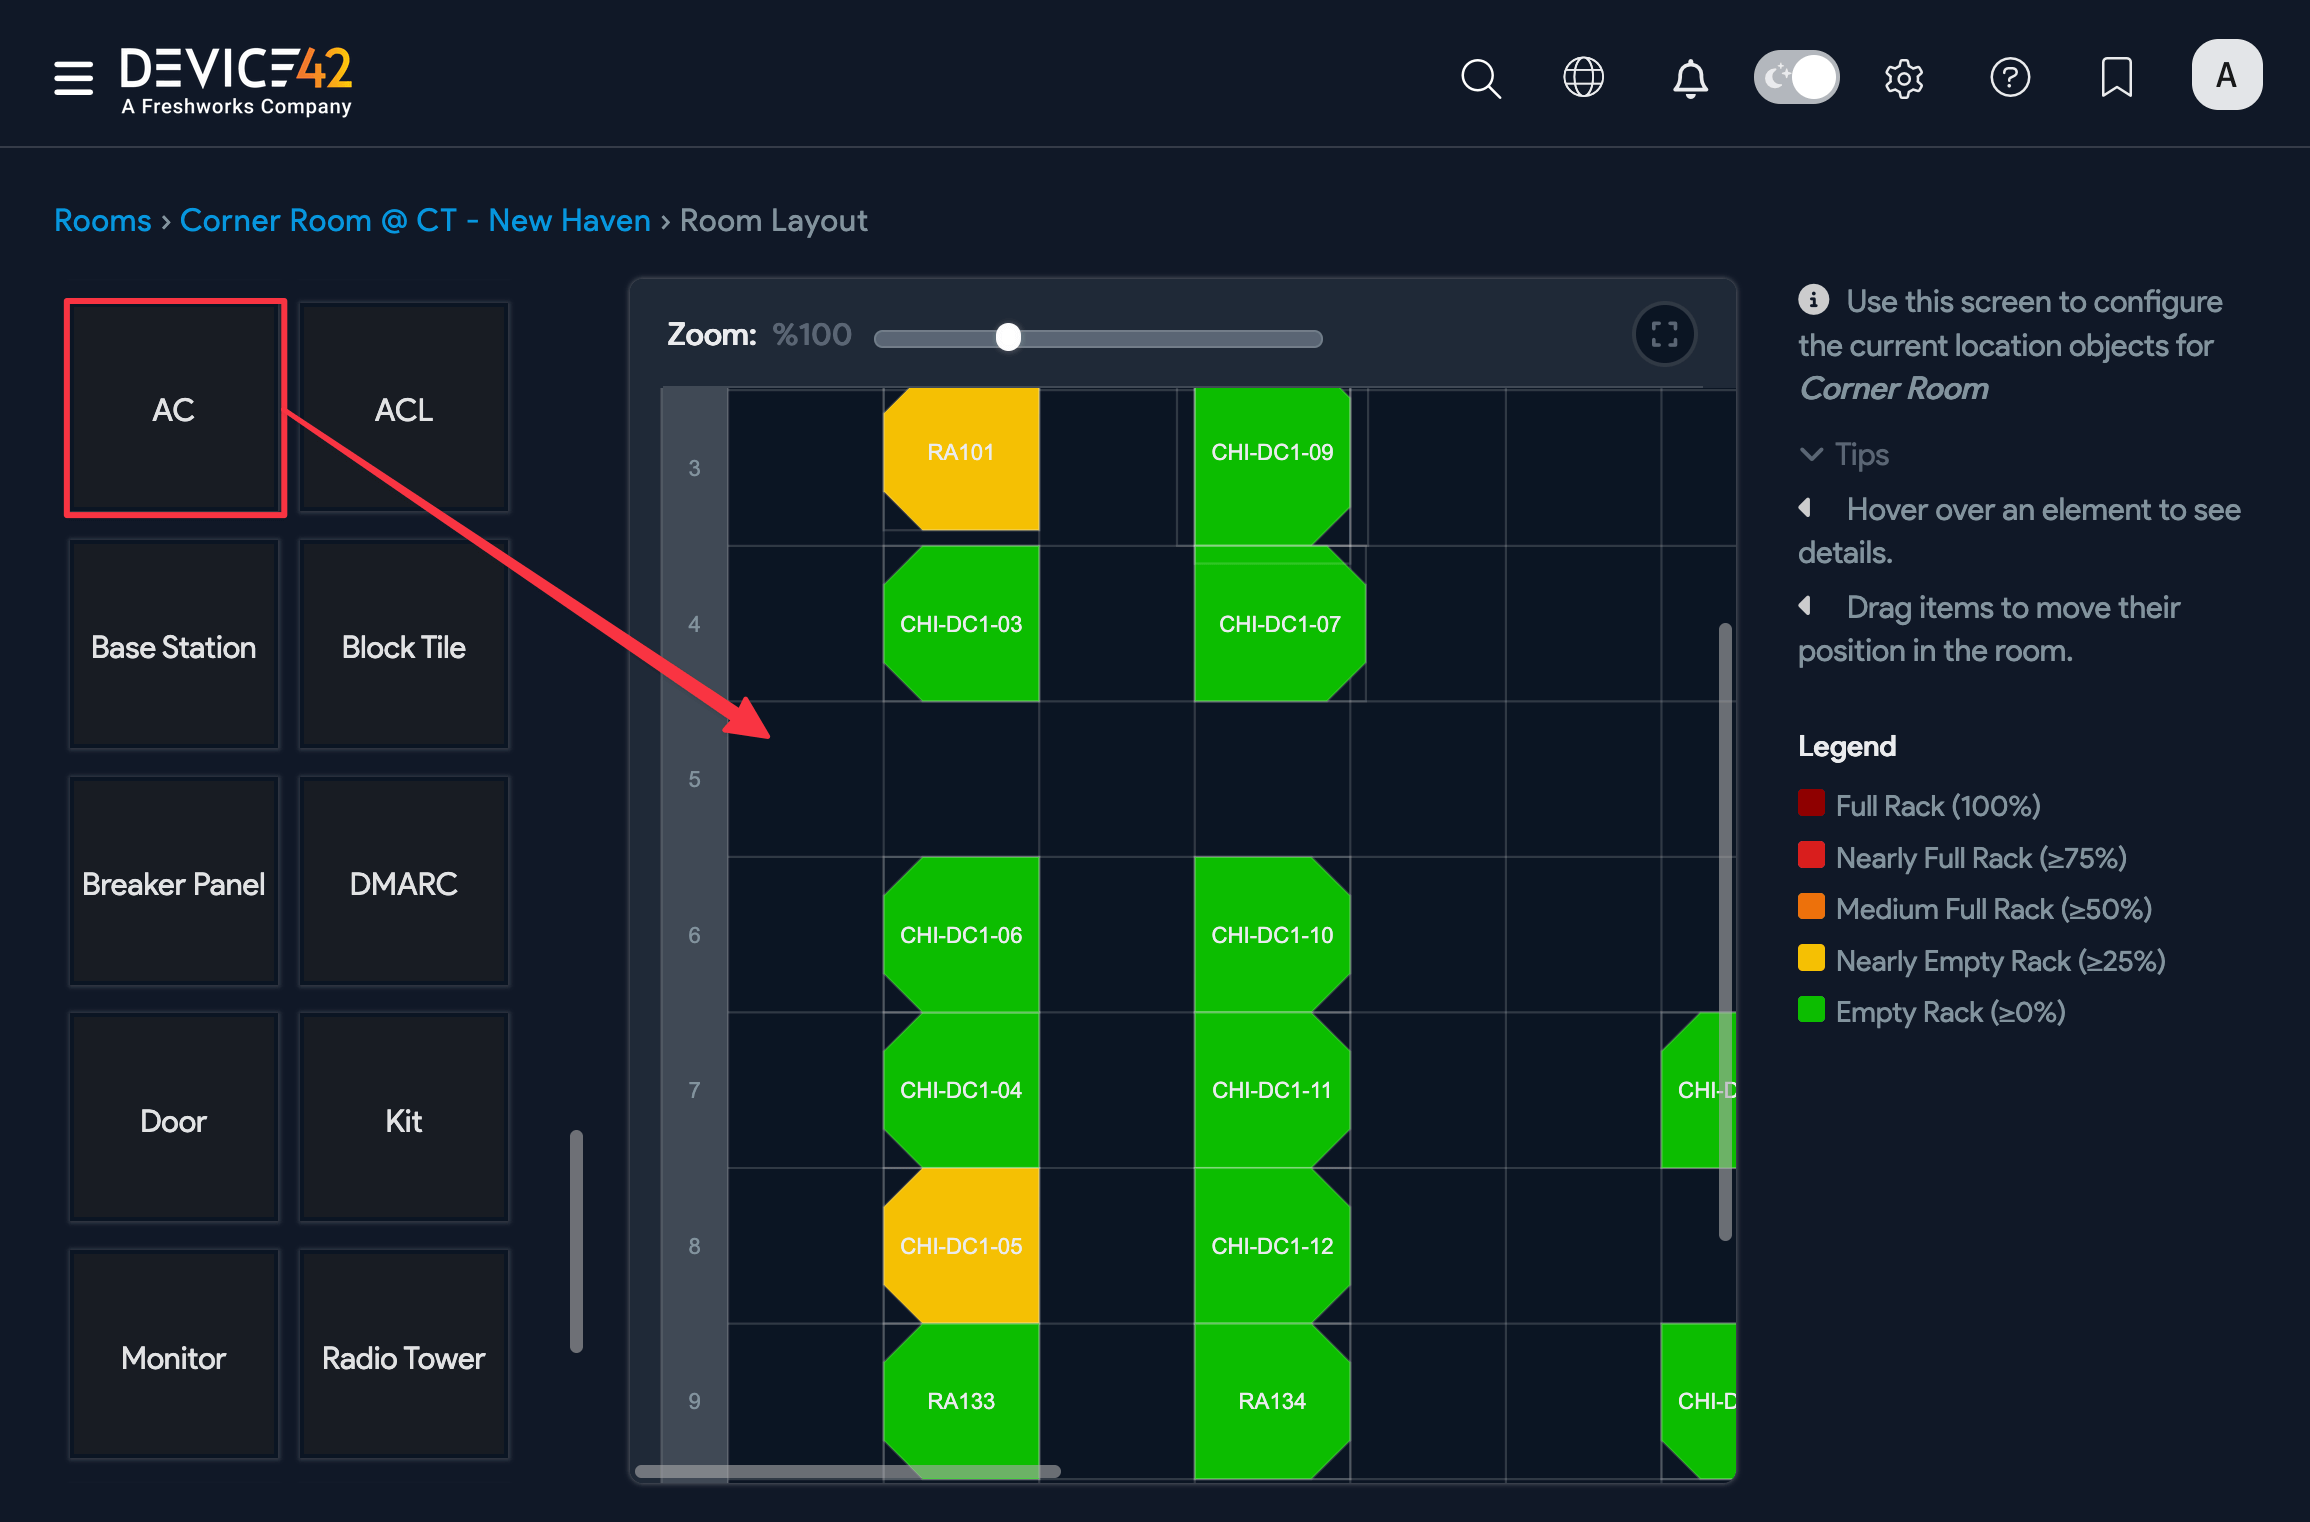
- Add object templates by dragging them from the left panel onto the layout.
-
Increase the size of an object by dragging its vertical or horizontal edge. Objects can occupy multiple grid spaces or as little as 1/10 of a grid cell.
Deselect the Show details on hover checkbox on the left panel when resizing objects to prevent popups from obscuring your view.
-
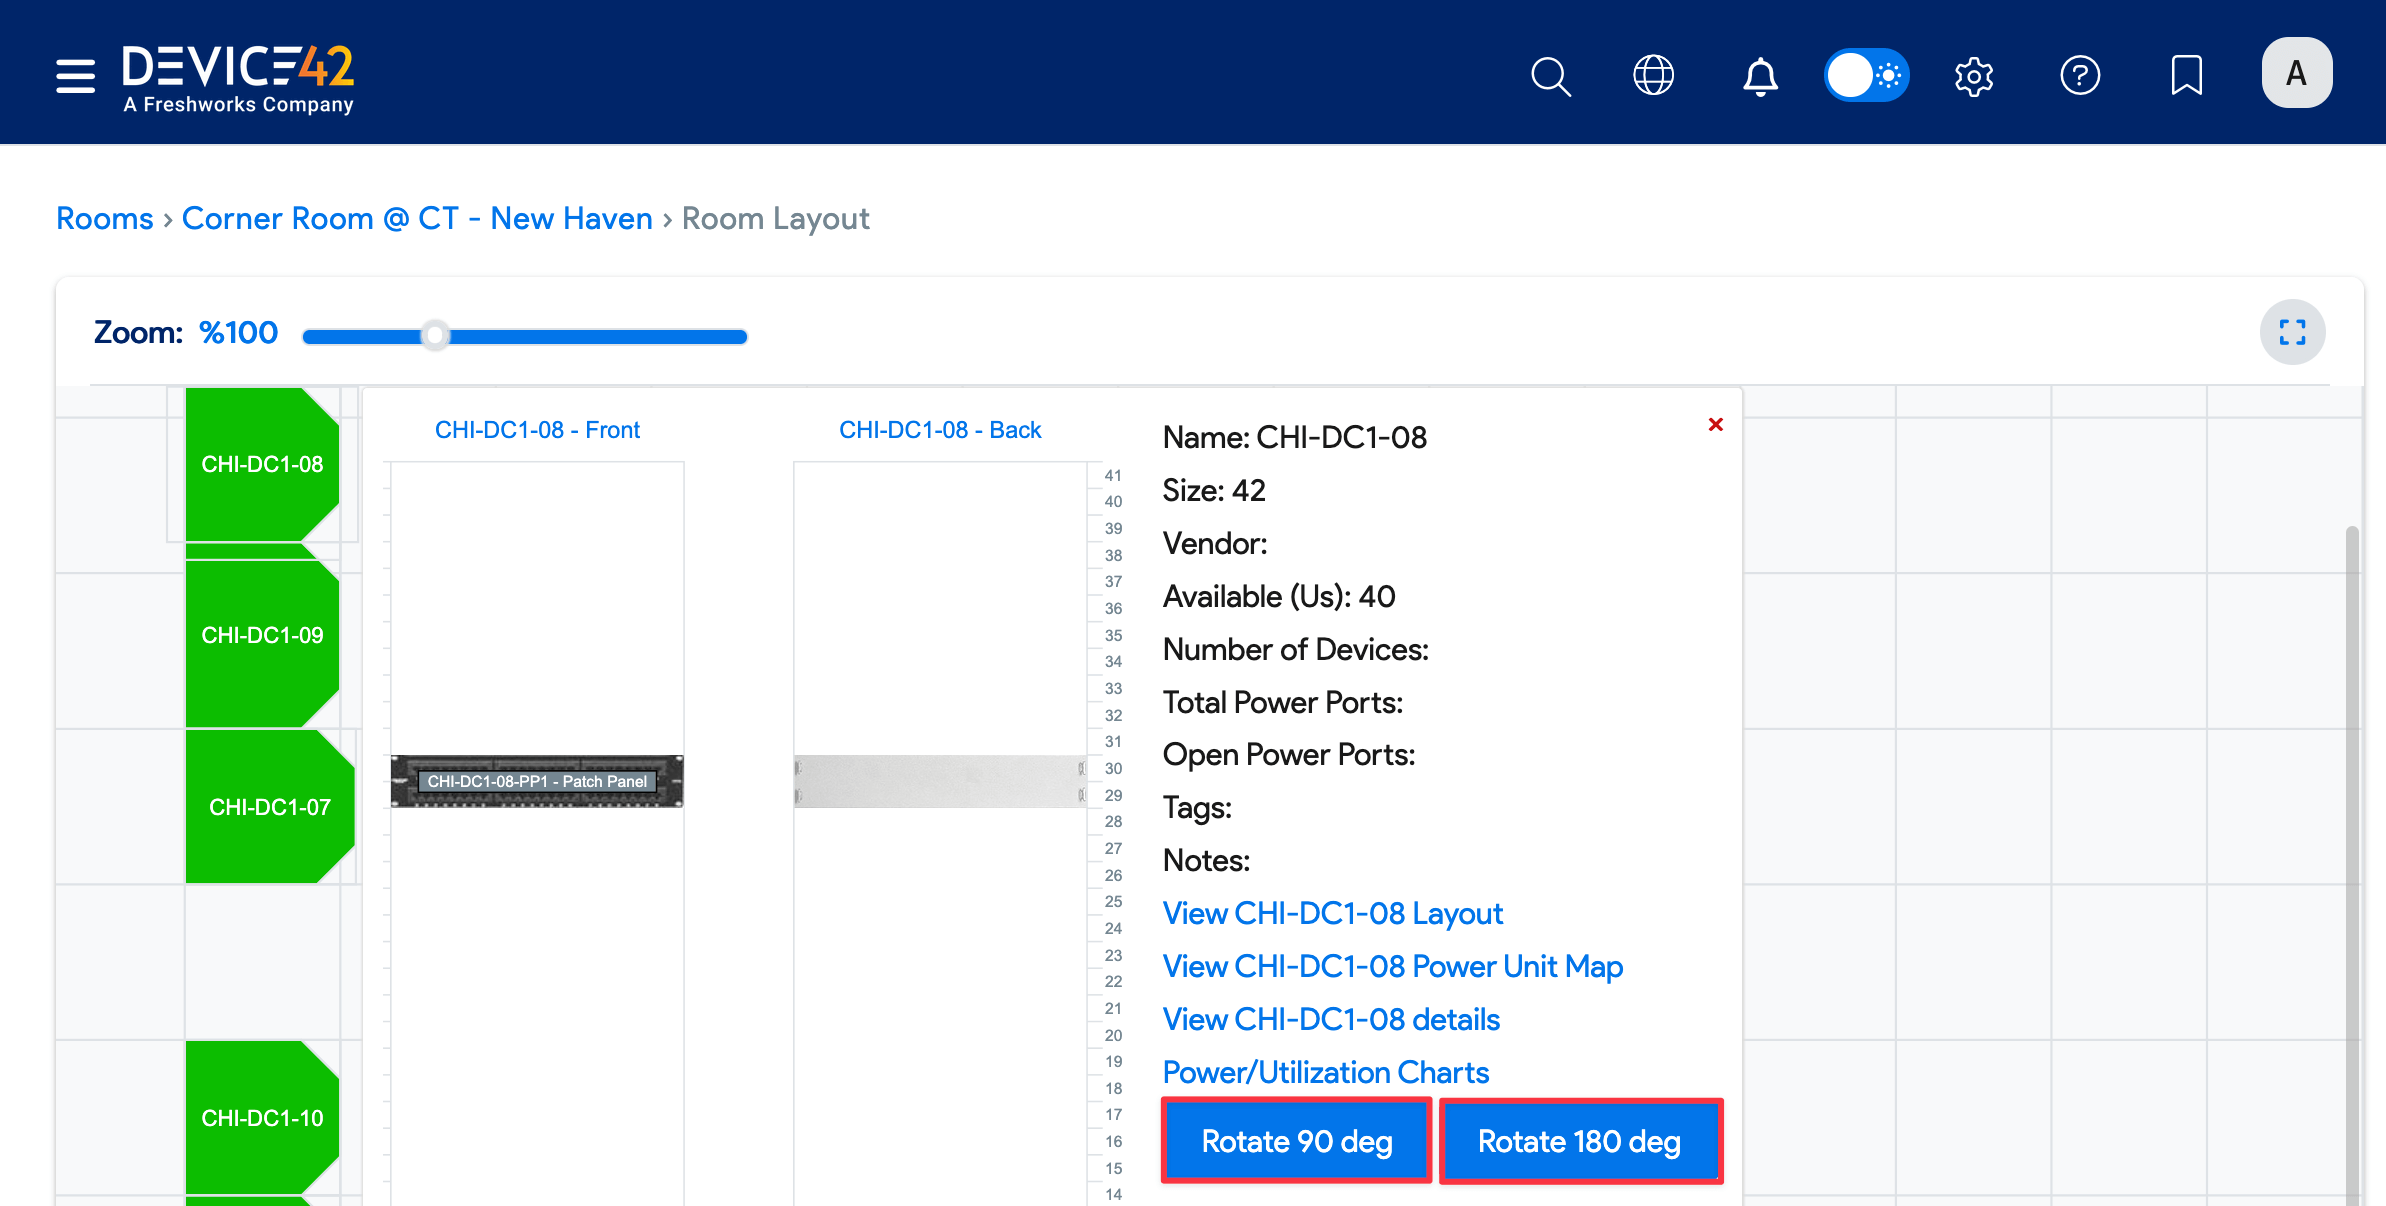
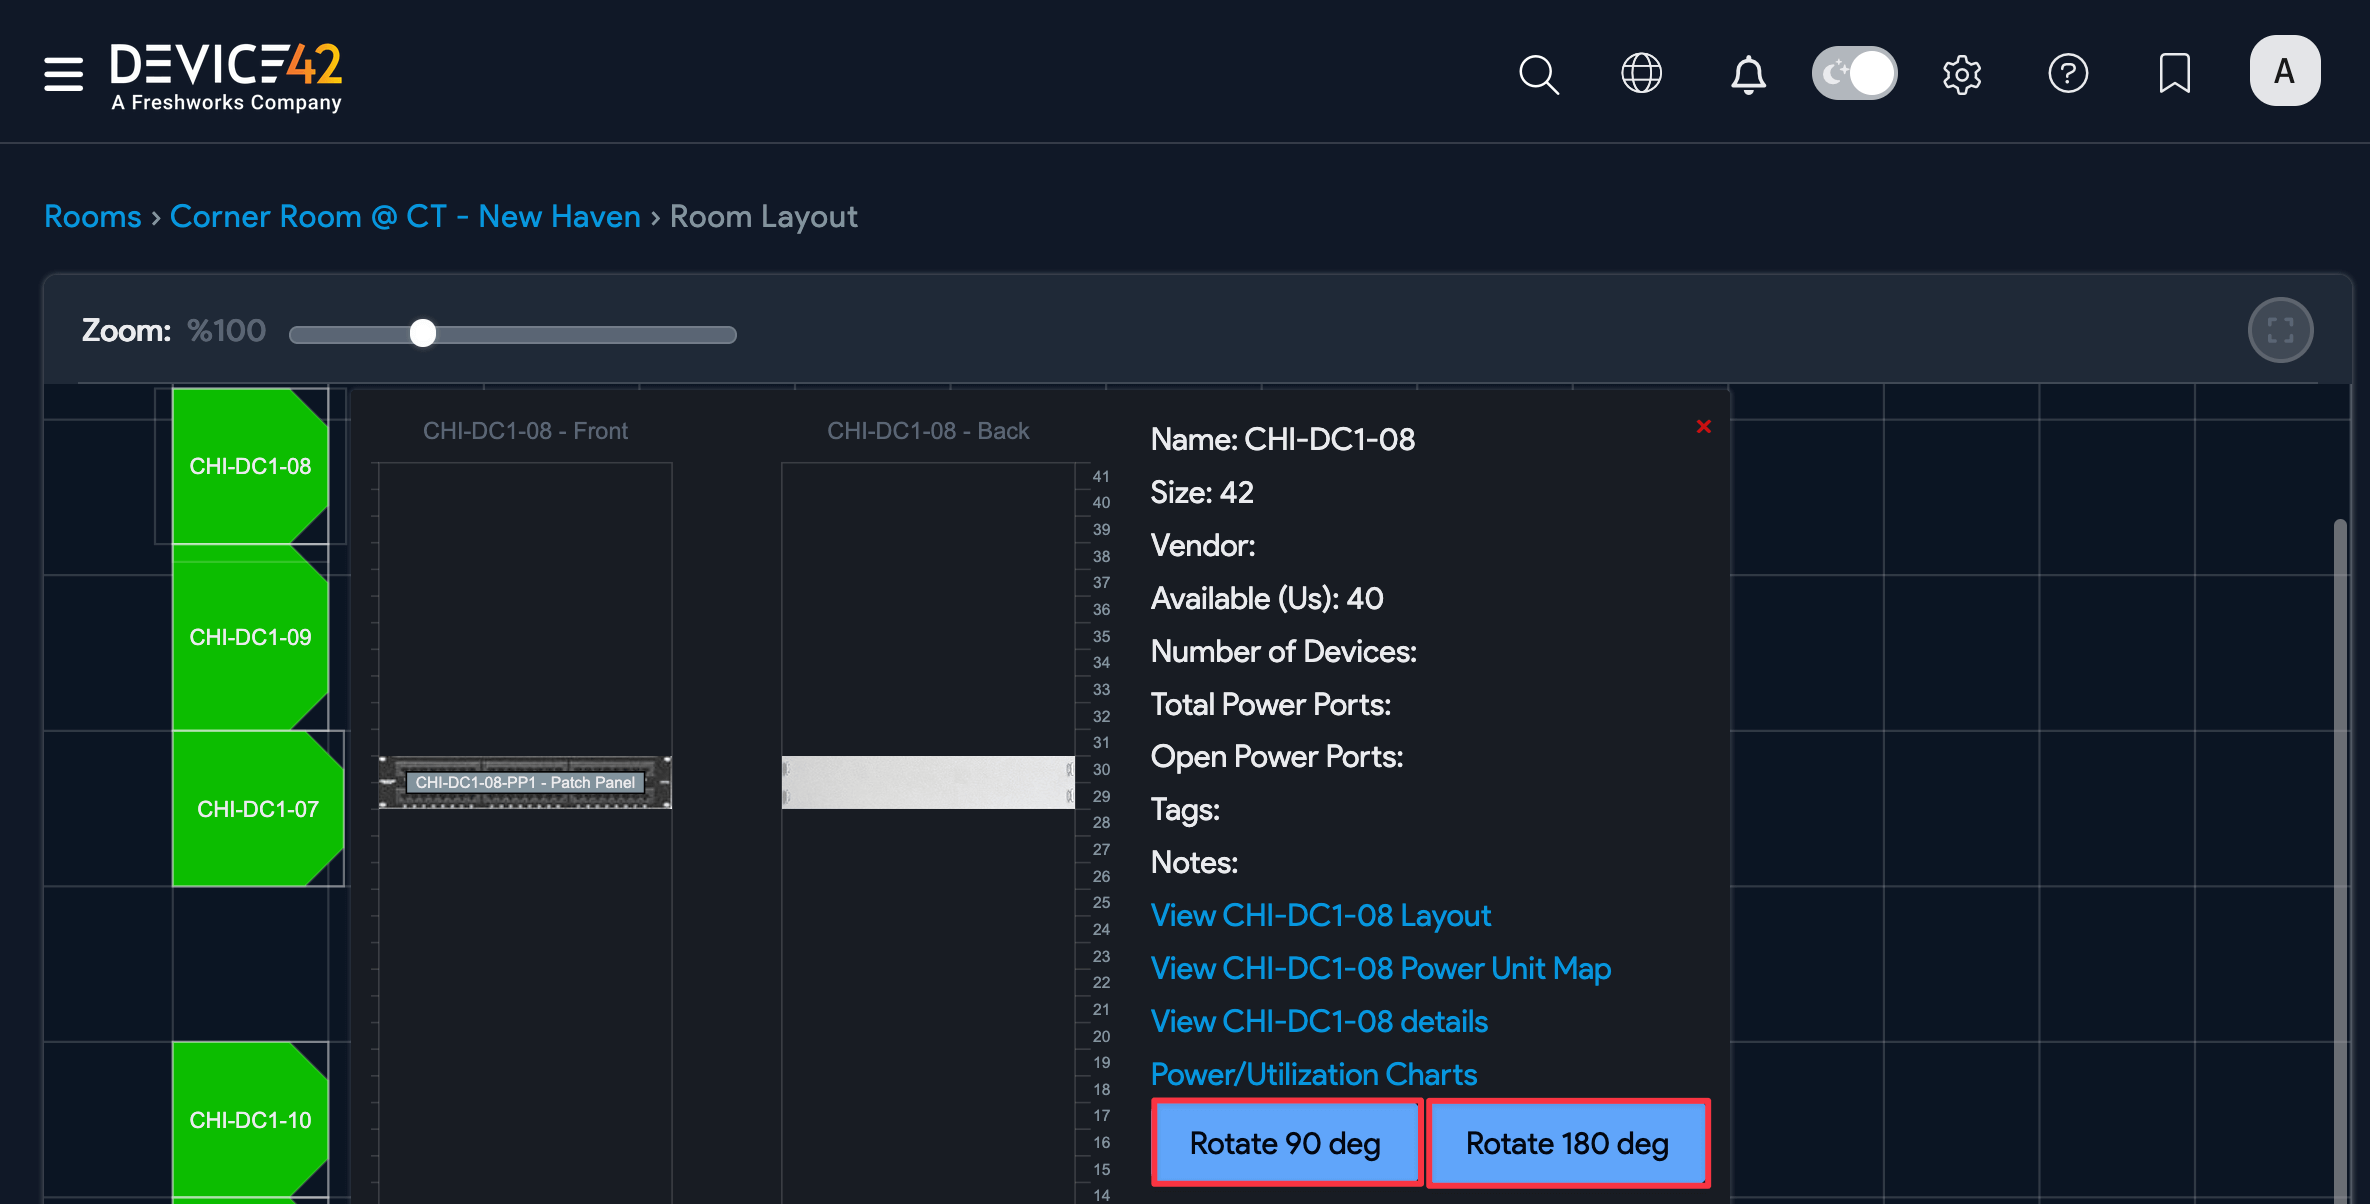
Rotate objects by 90 or 180 degrees by hovering over the object and clicking the rotate buttons located on the popup panel. Edit mode must be enabled to see the rotate buttons.
-
You can reposition and rotate multiple objects at once. Select multiple objects by dragging your cursor over them. Reposition multiple selected objects by dragging them. Rotate multiple selected objects using the rotate buttons in the popup.
Adding Objects to a Layout
Ensure that editing mode is enabled. Navigate to Infrastructure > DataCenter > Rooms, click the Show link under the Layout column, and select Turn ON from the layout view.
You can add any asset type to the room and are not confined to the template objects available in the left panel, as shown above. You can even create your own asset types.
Racks and other objects can be added via the API or from the Tools > Imports/Exports menu.
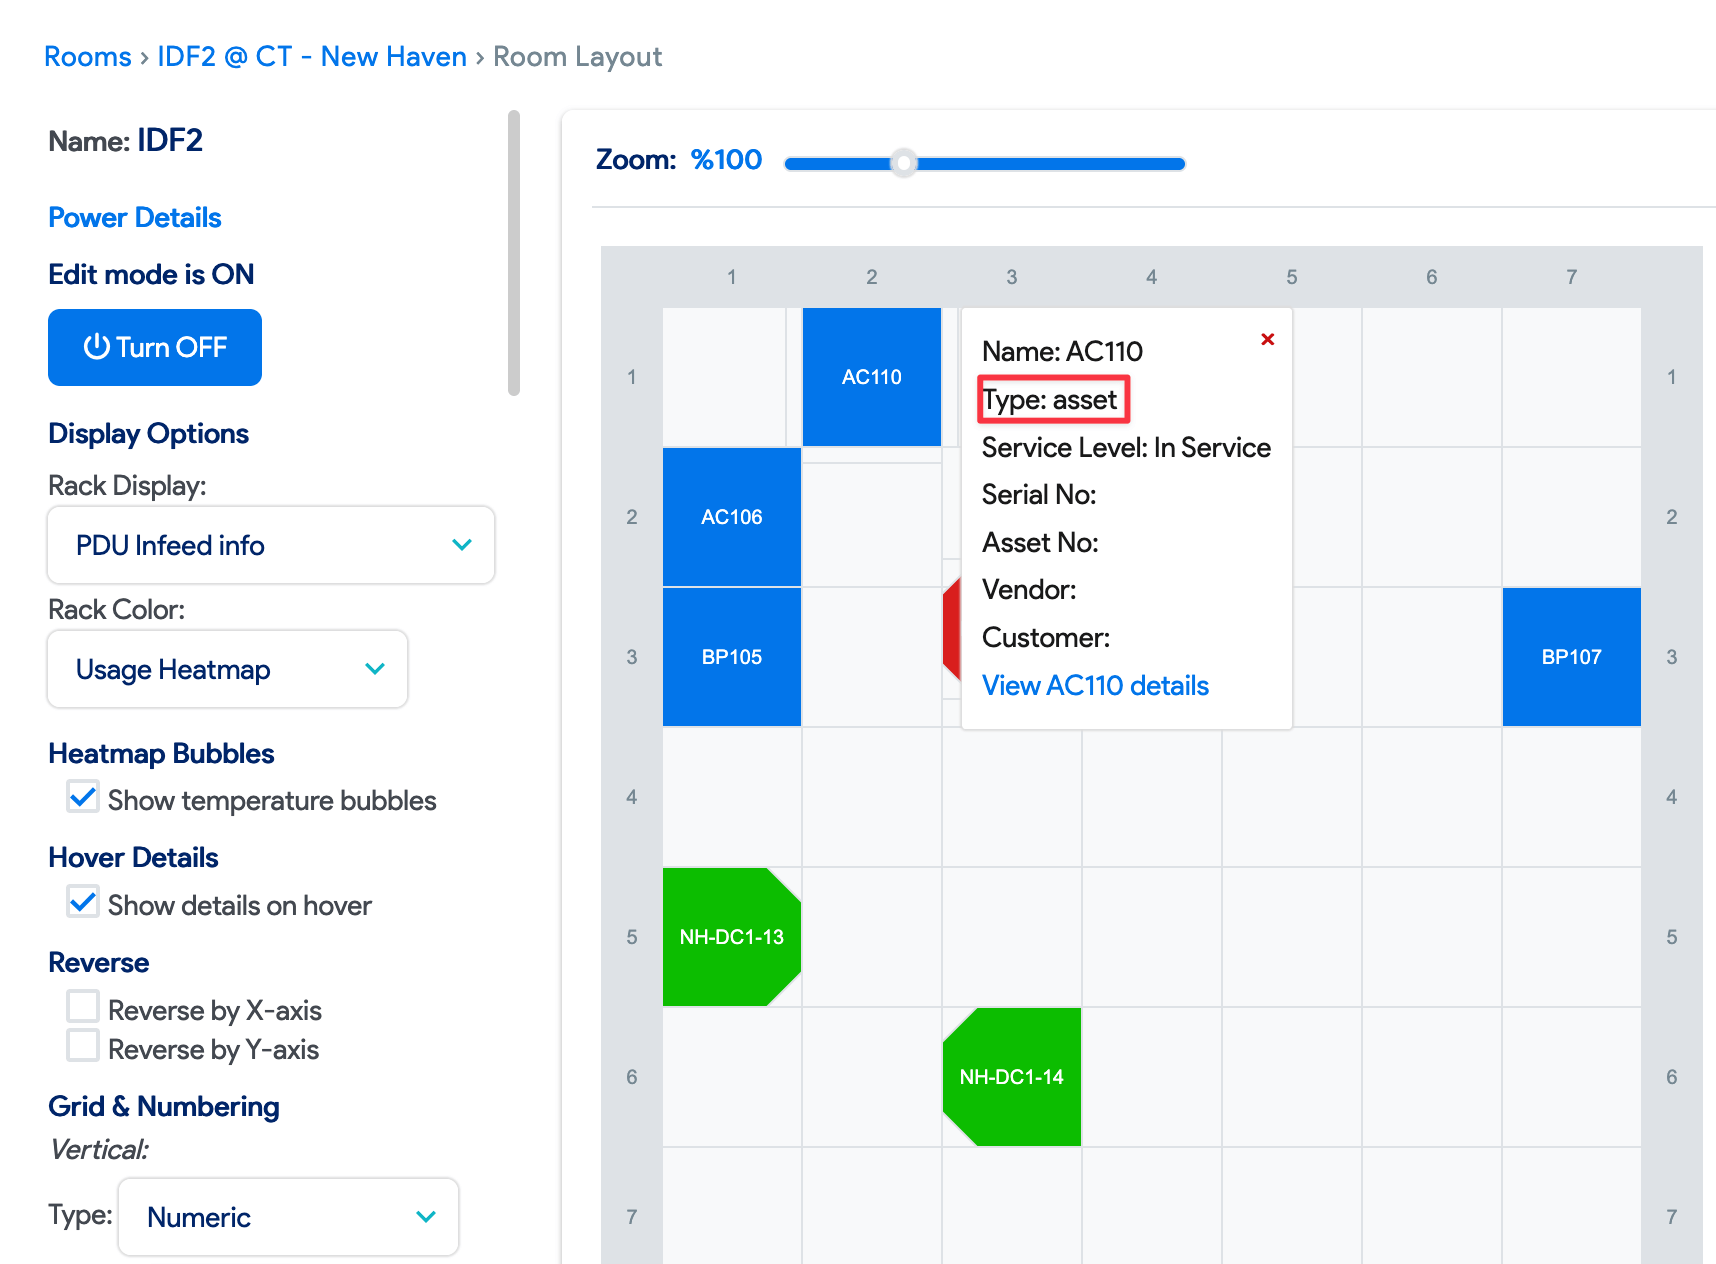
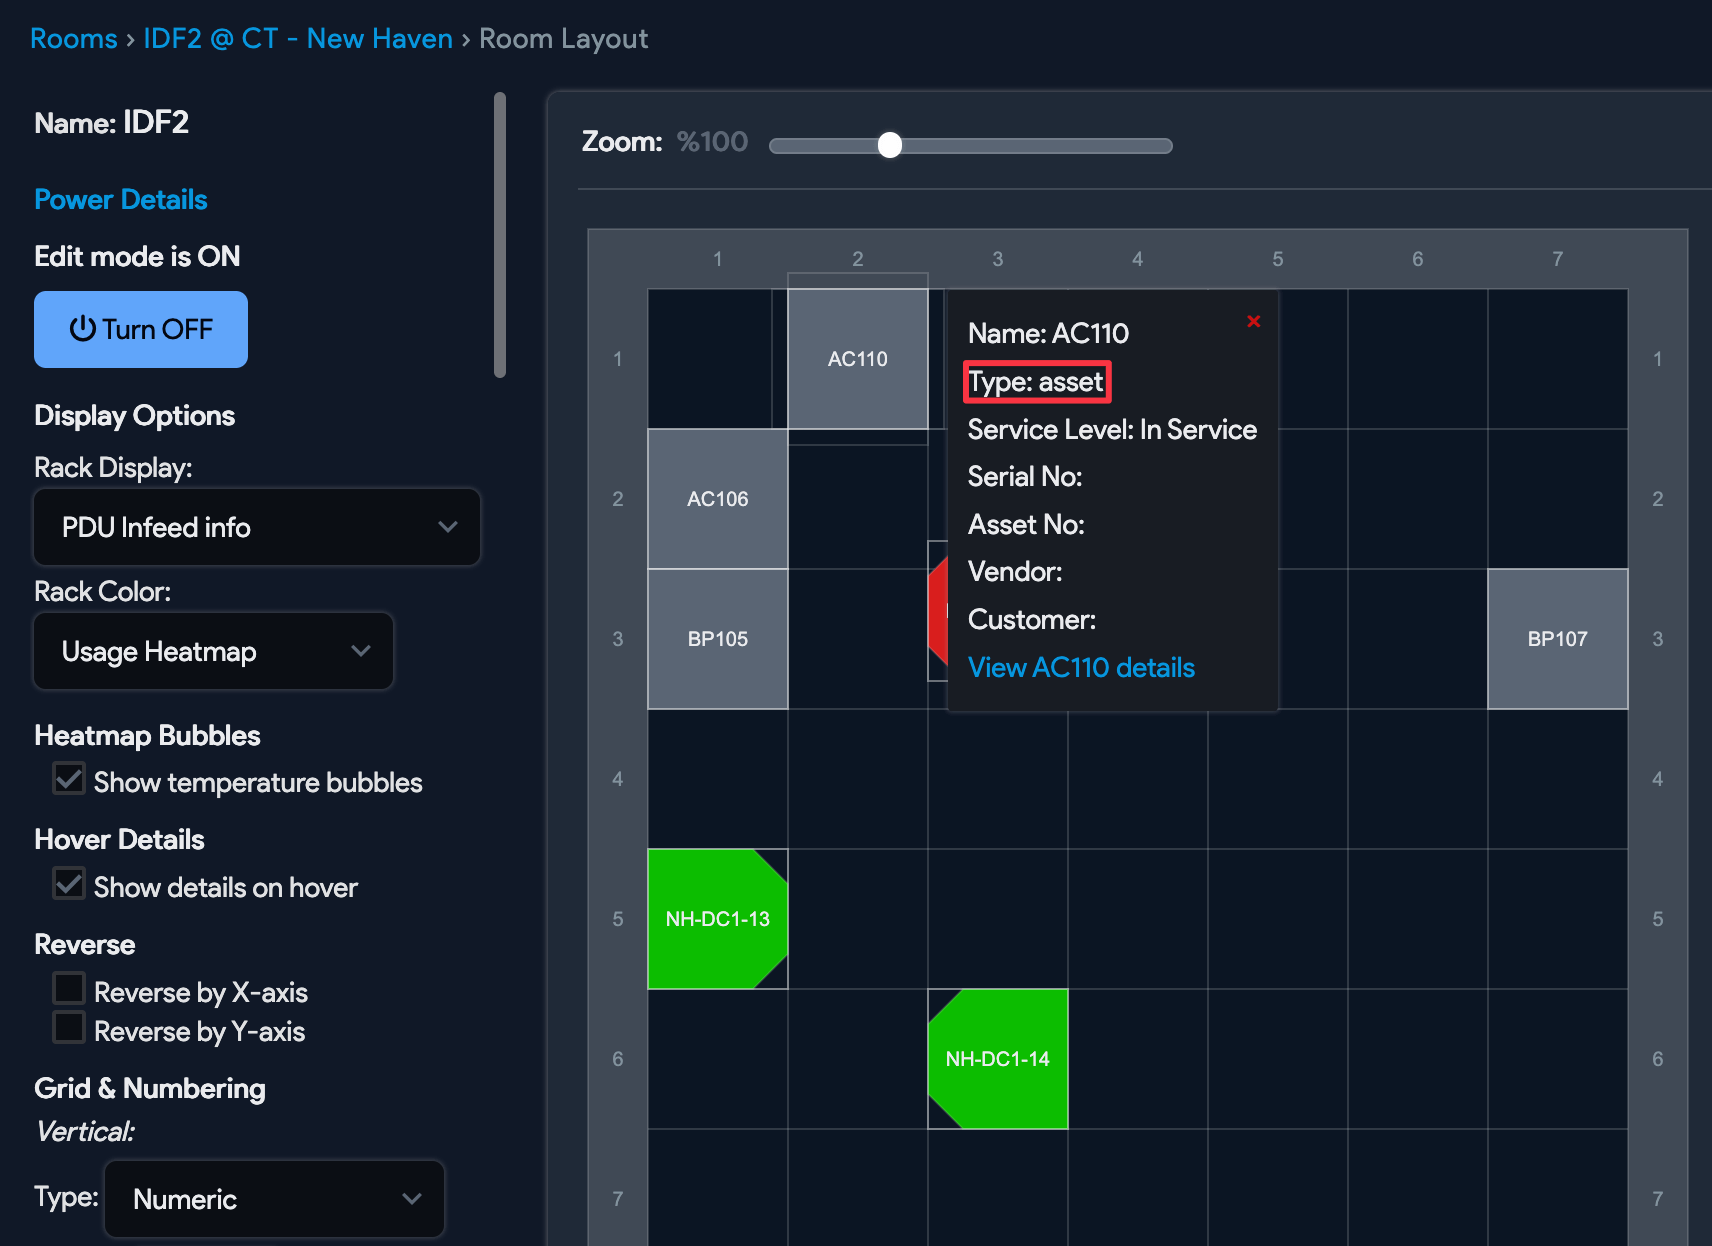
Mouse-Over Options
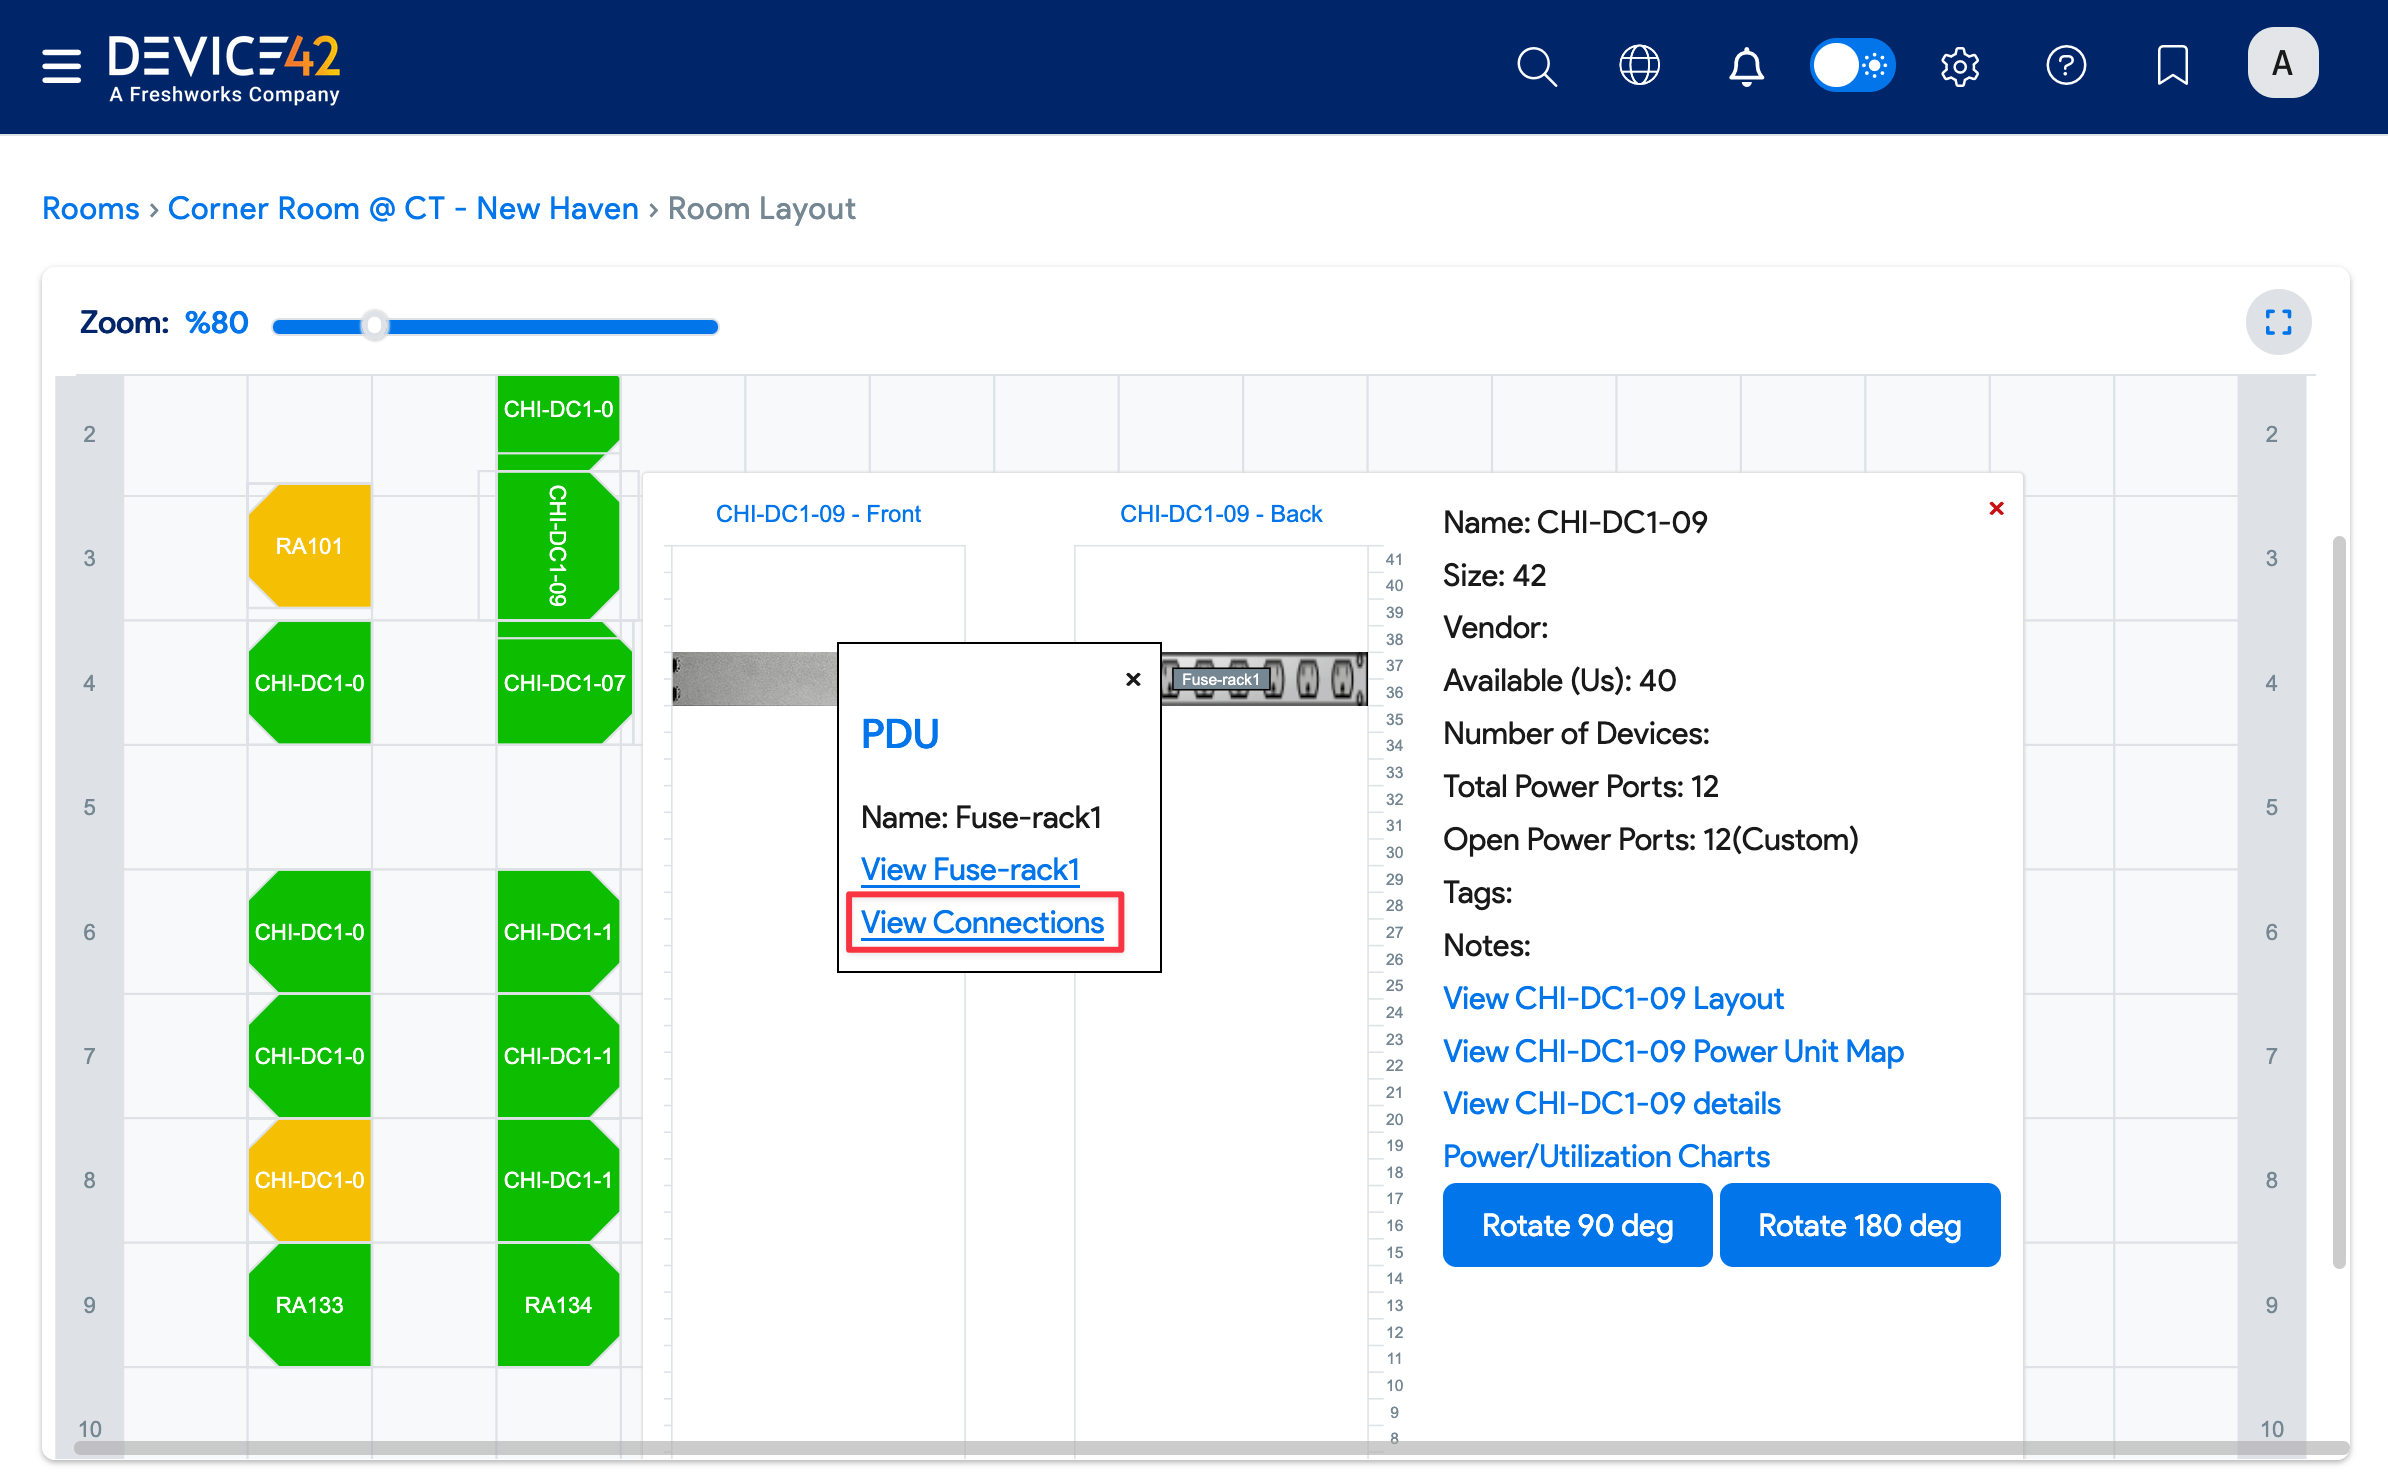
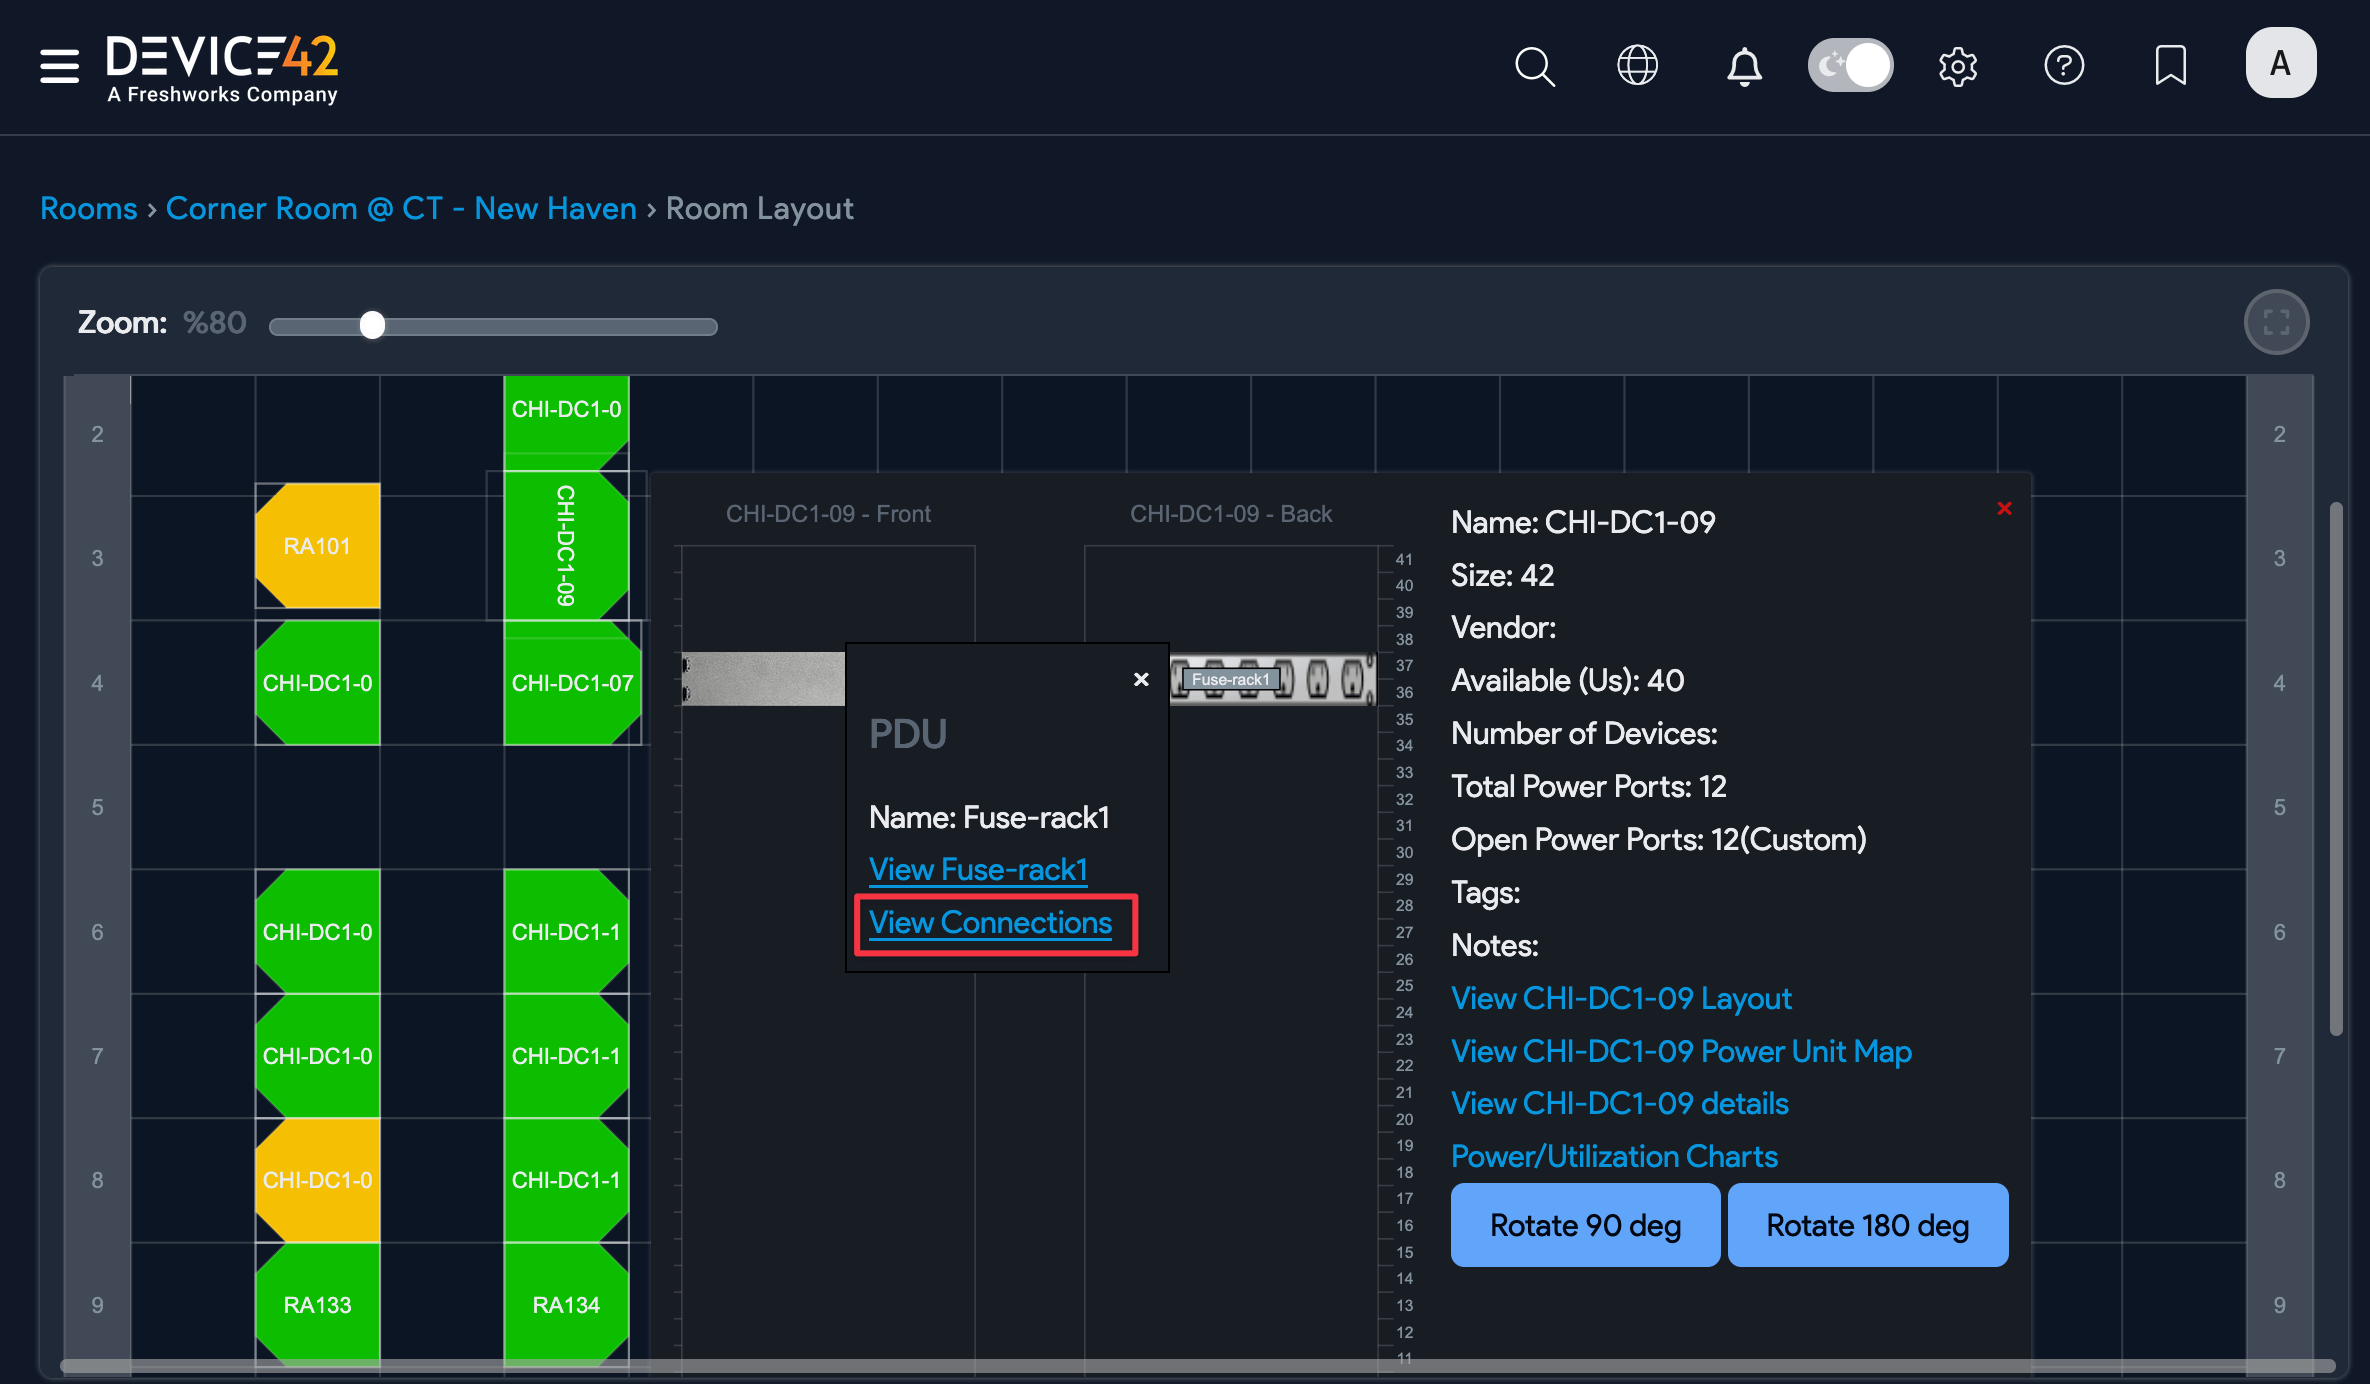
If you hover over an object, you will see a popup with detailed information about the object.
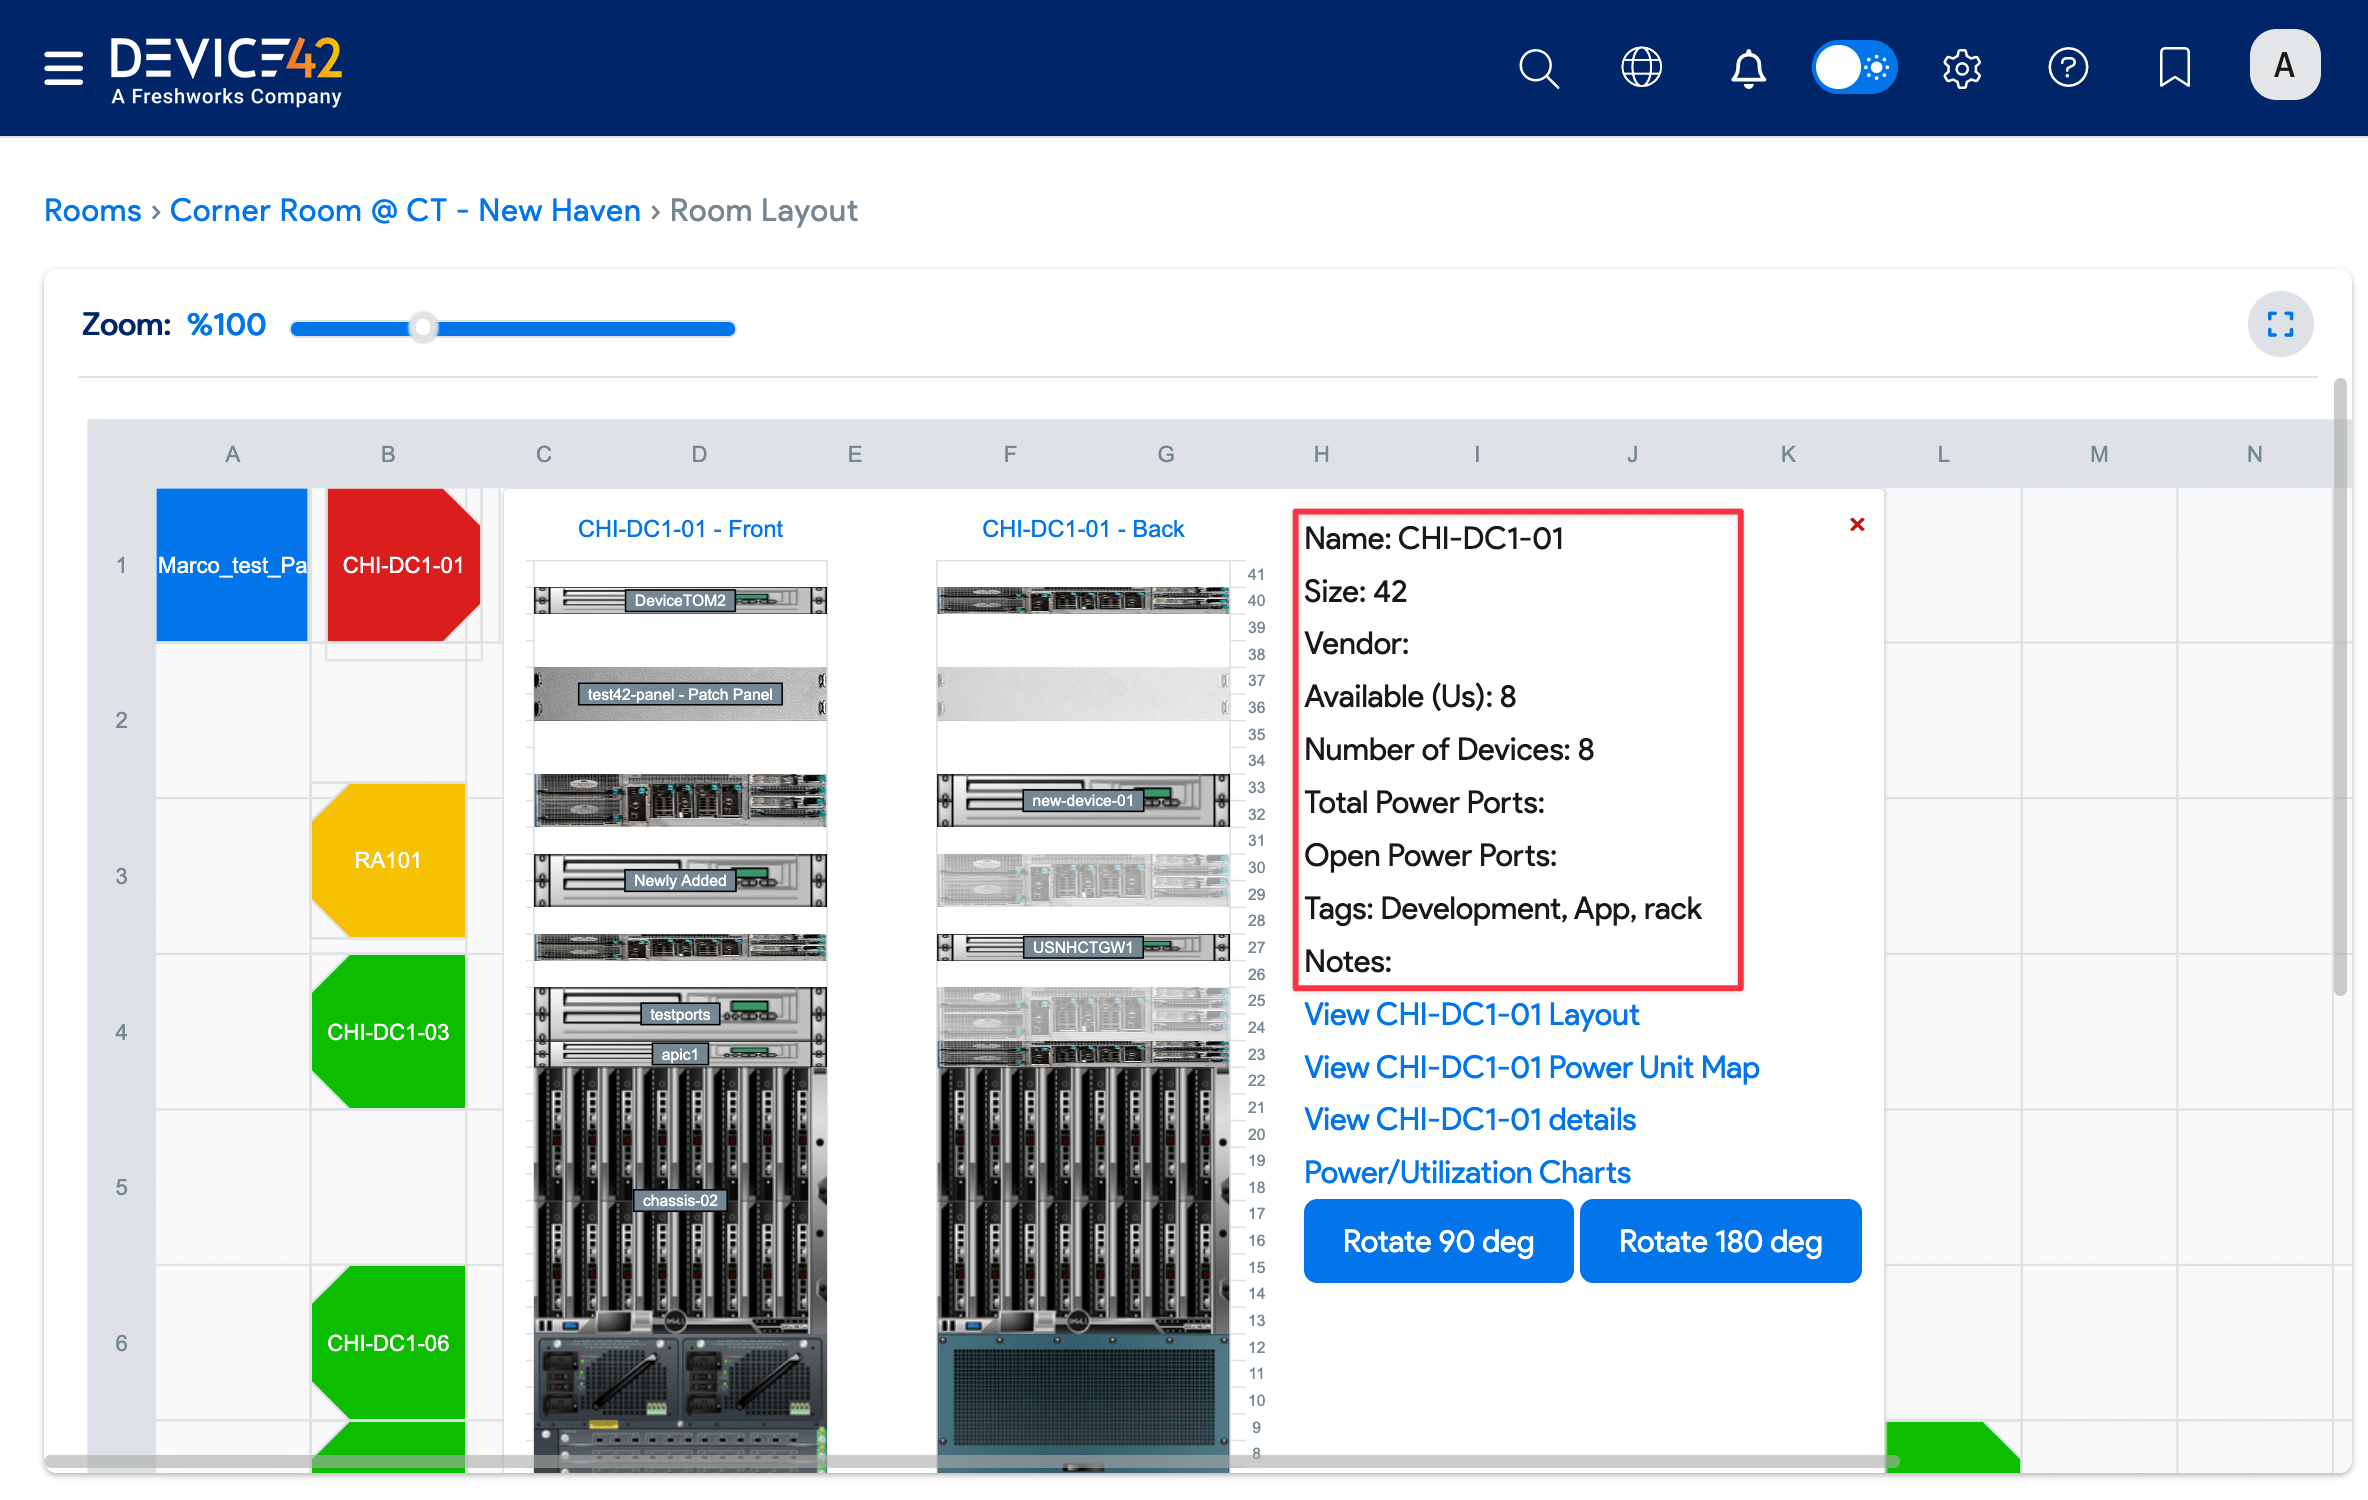
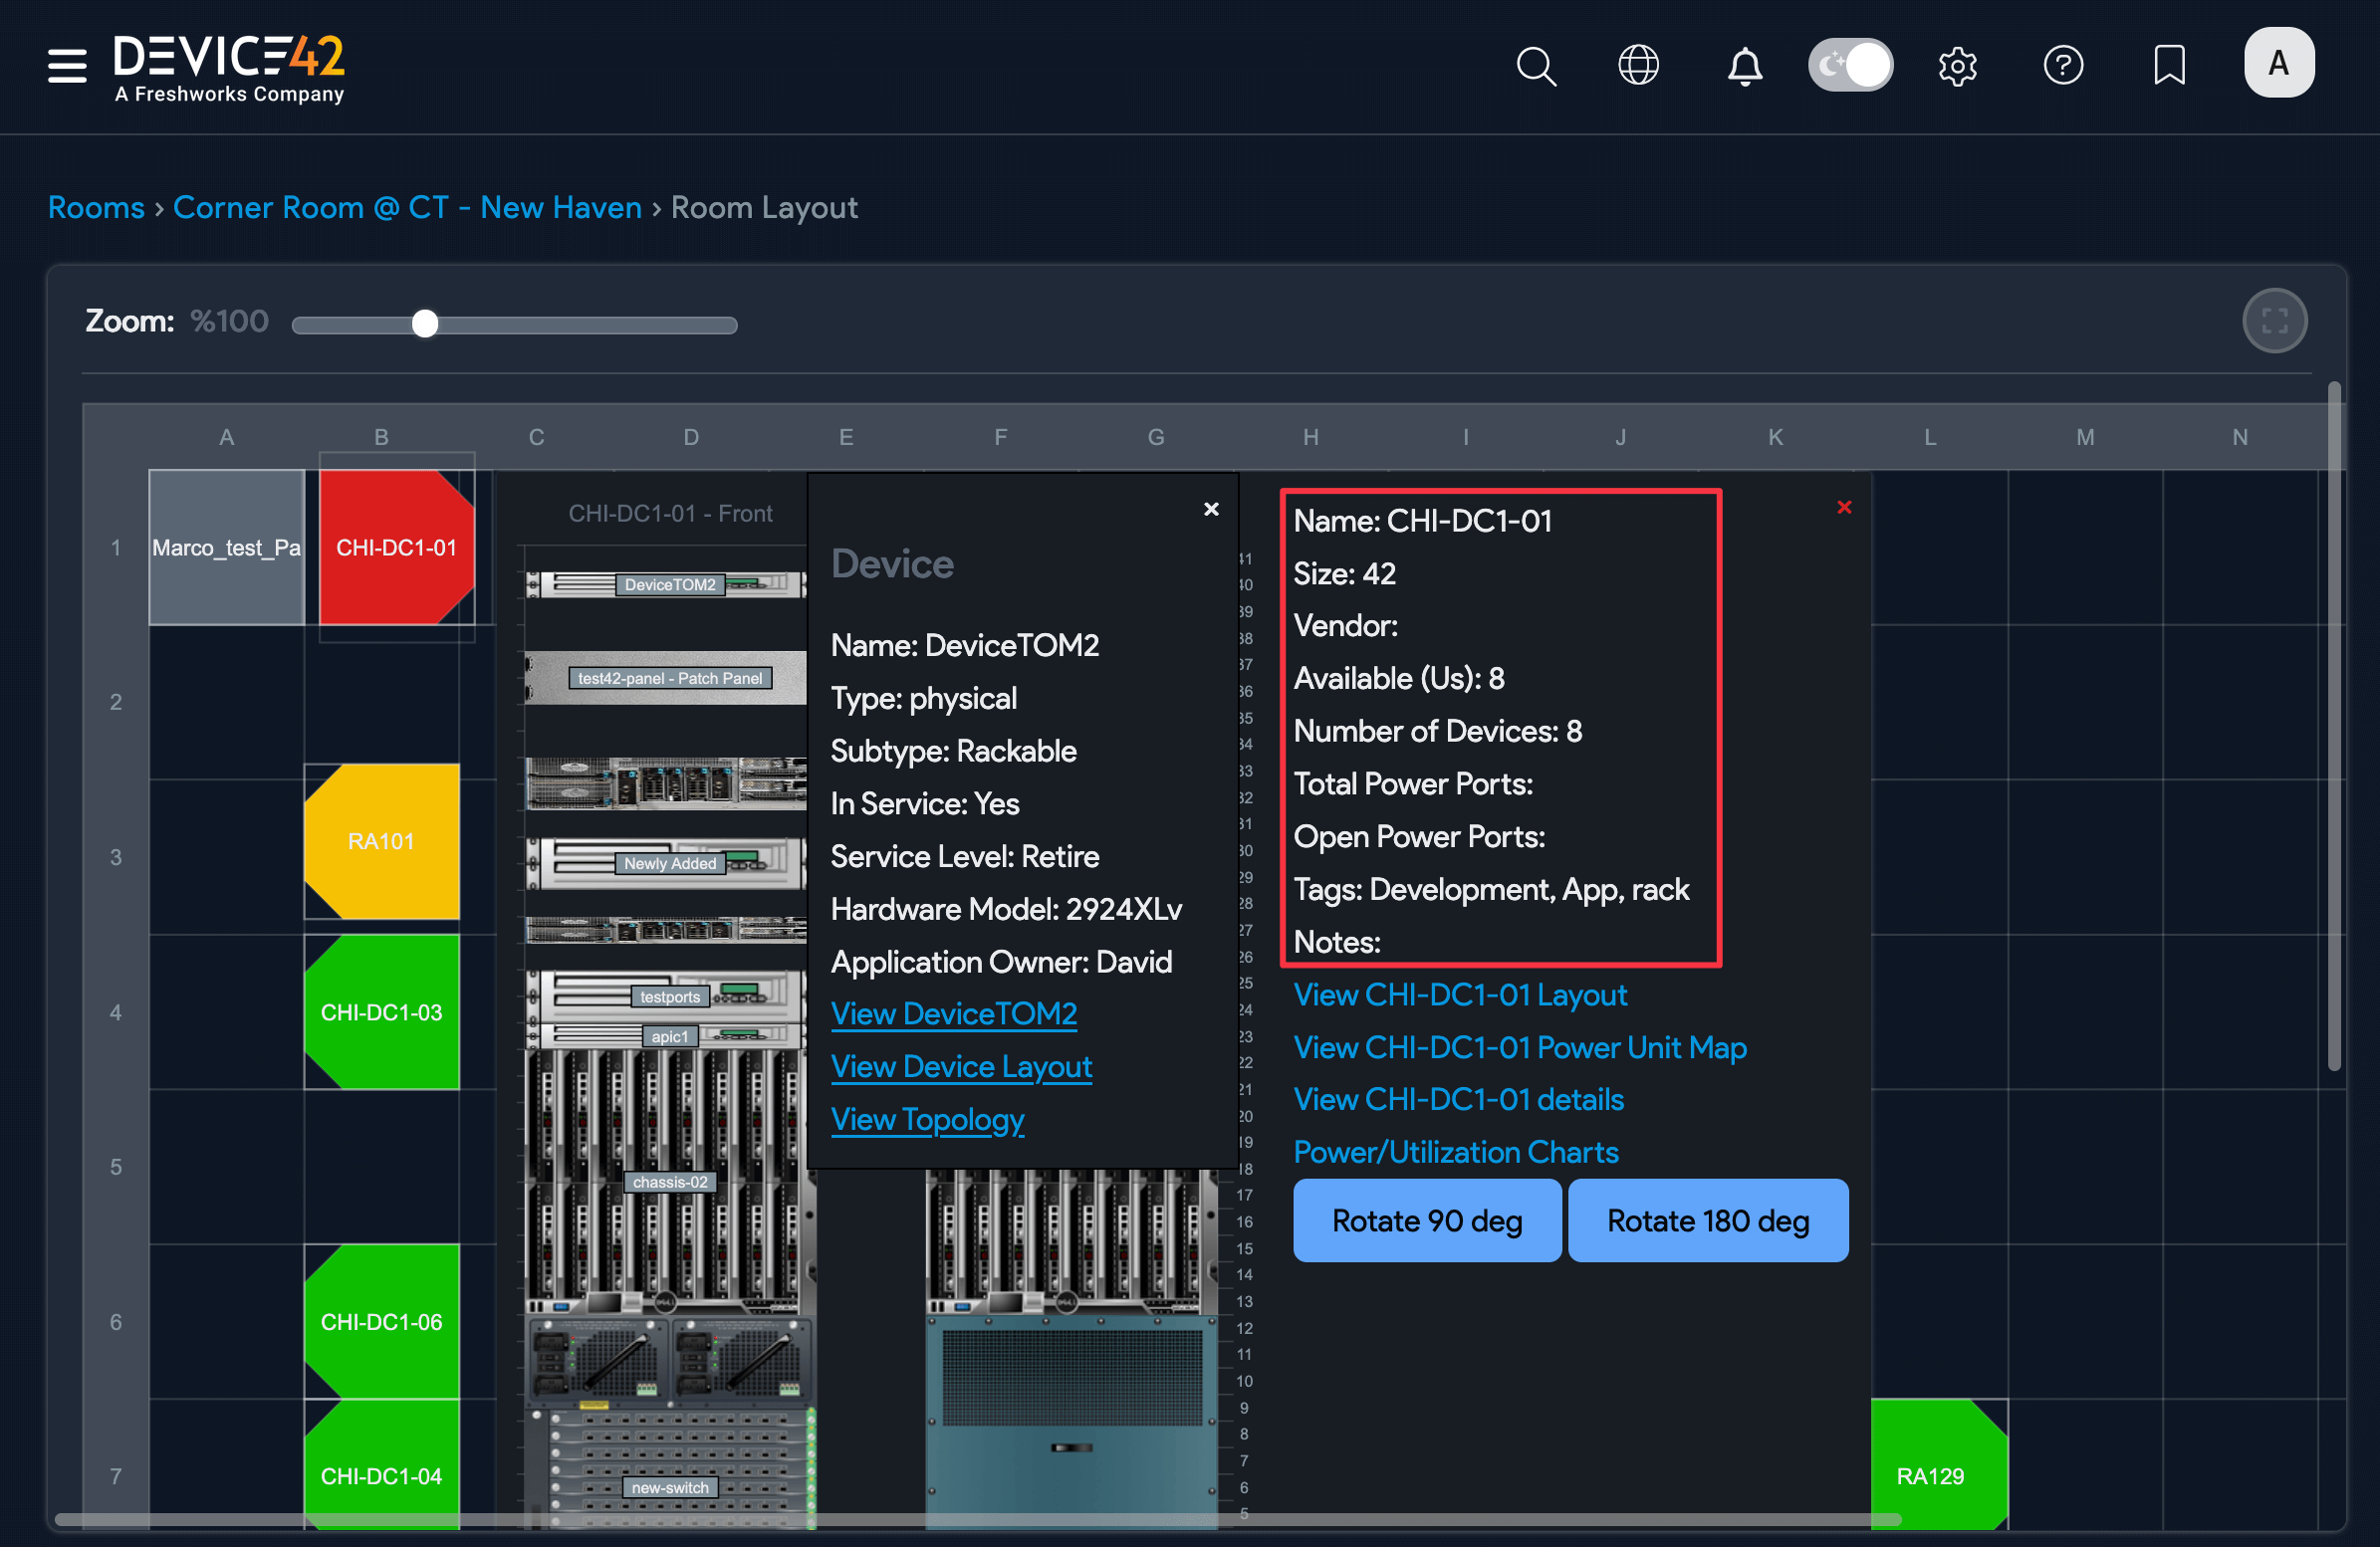
For racks, you'll see the following information:
- Name
- Size
- Vendor
- Available (Us)
- Number of Devices
- Total Power Ports The total number of ports for all PDUs in the rack.
- Open Power Ports The number of available power ports by connector type.
- Tags Any tags added to the rack for labeling and classification purposes.
- Notes
If you have Power and Environmental Monitoring enabled, you will also see the following information:
- Temperature The minimum to maximum temperature range from all sensors in the rack.
- Relative Humidity The minimum to maximum relative humidity range from all sensors in the rack.
The popup also has links to several additional views.
-
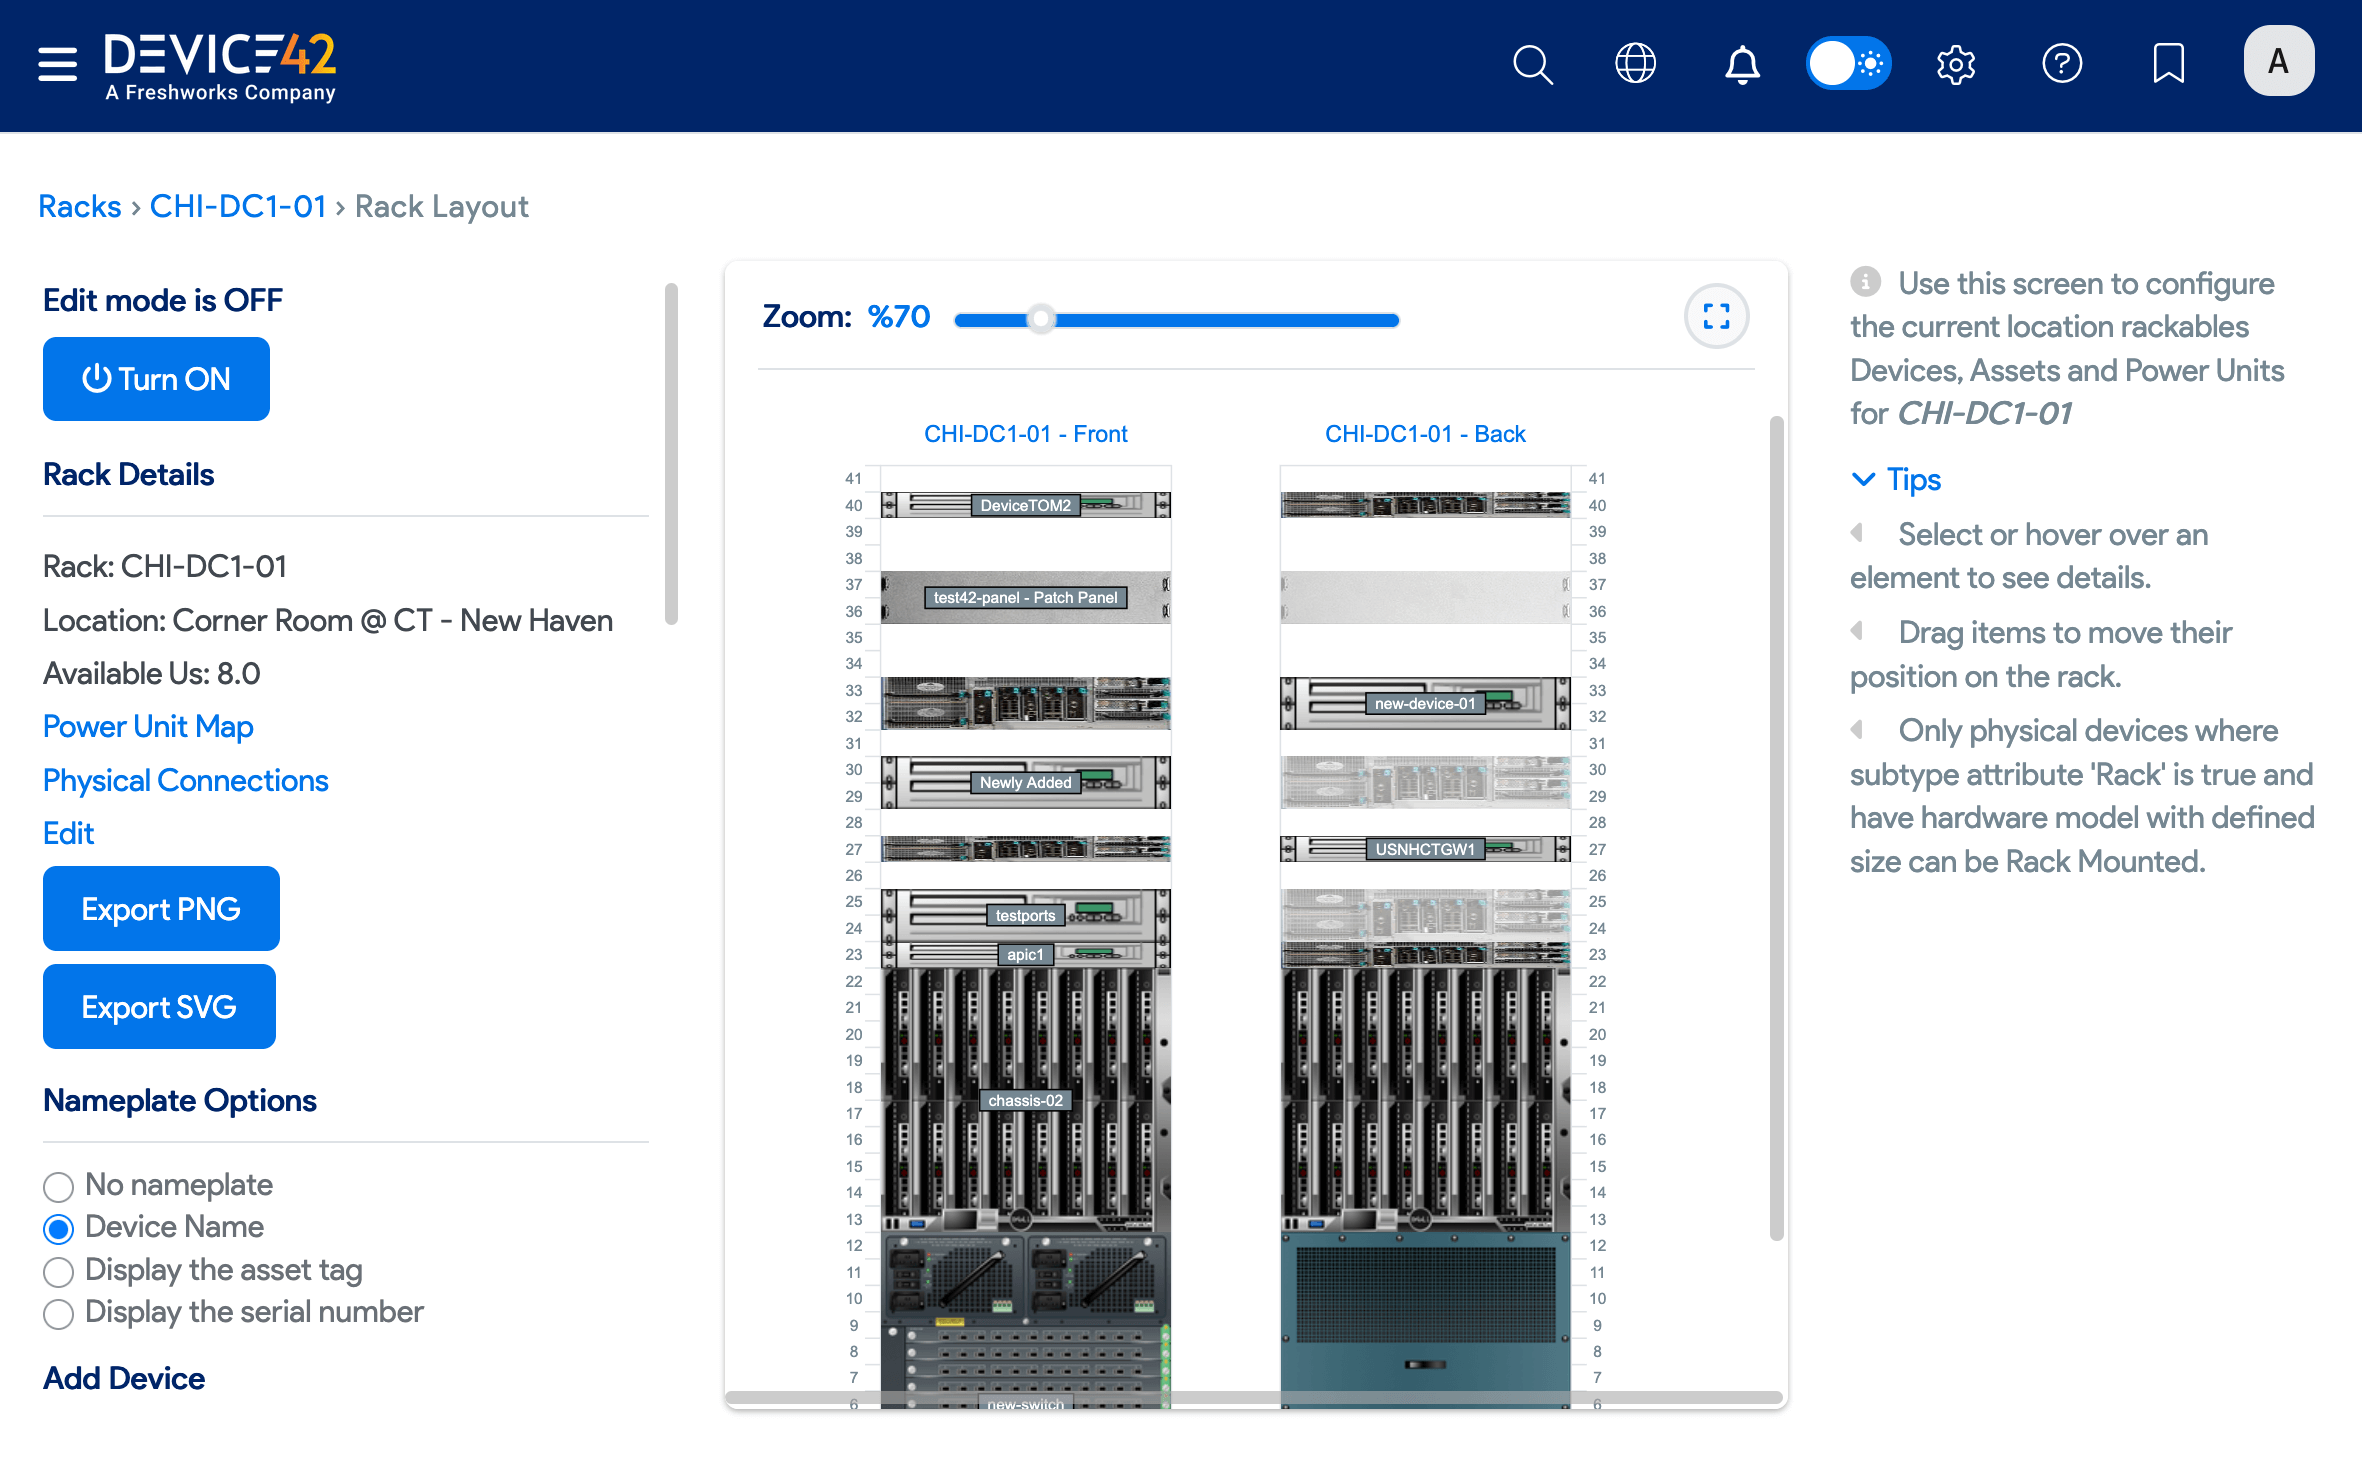
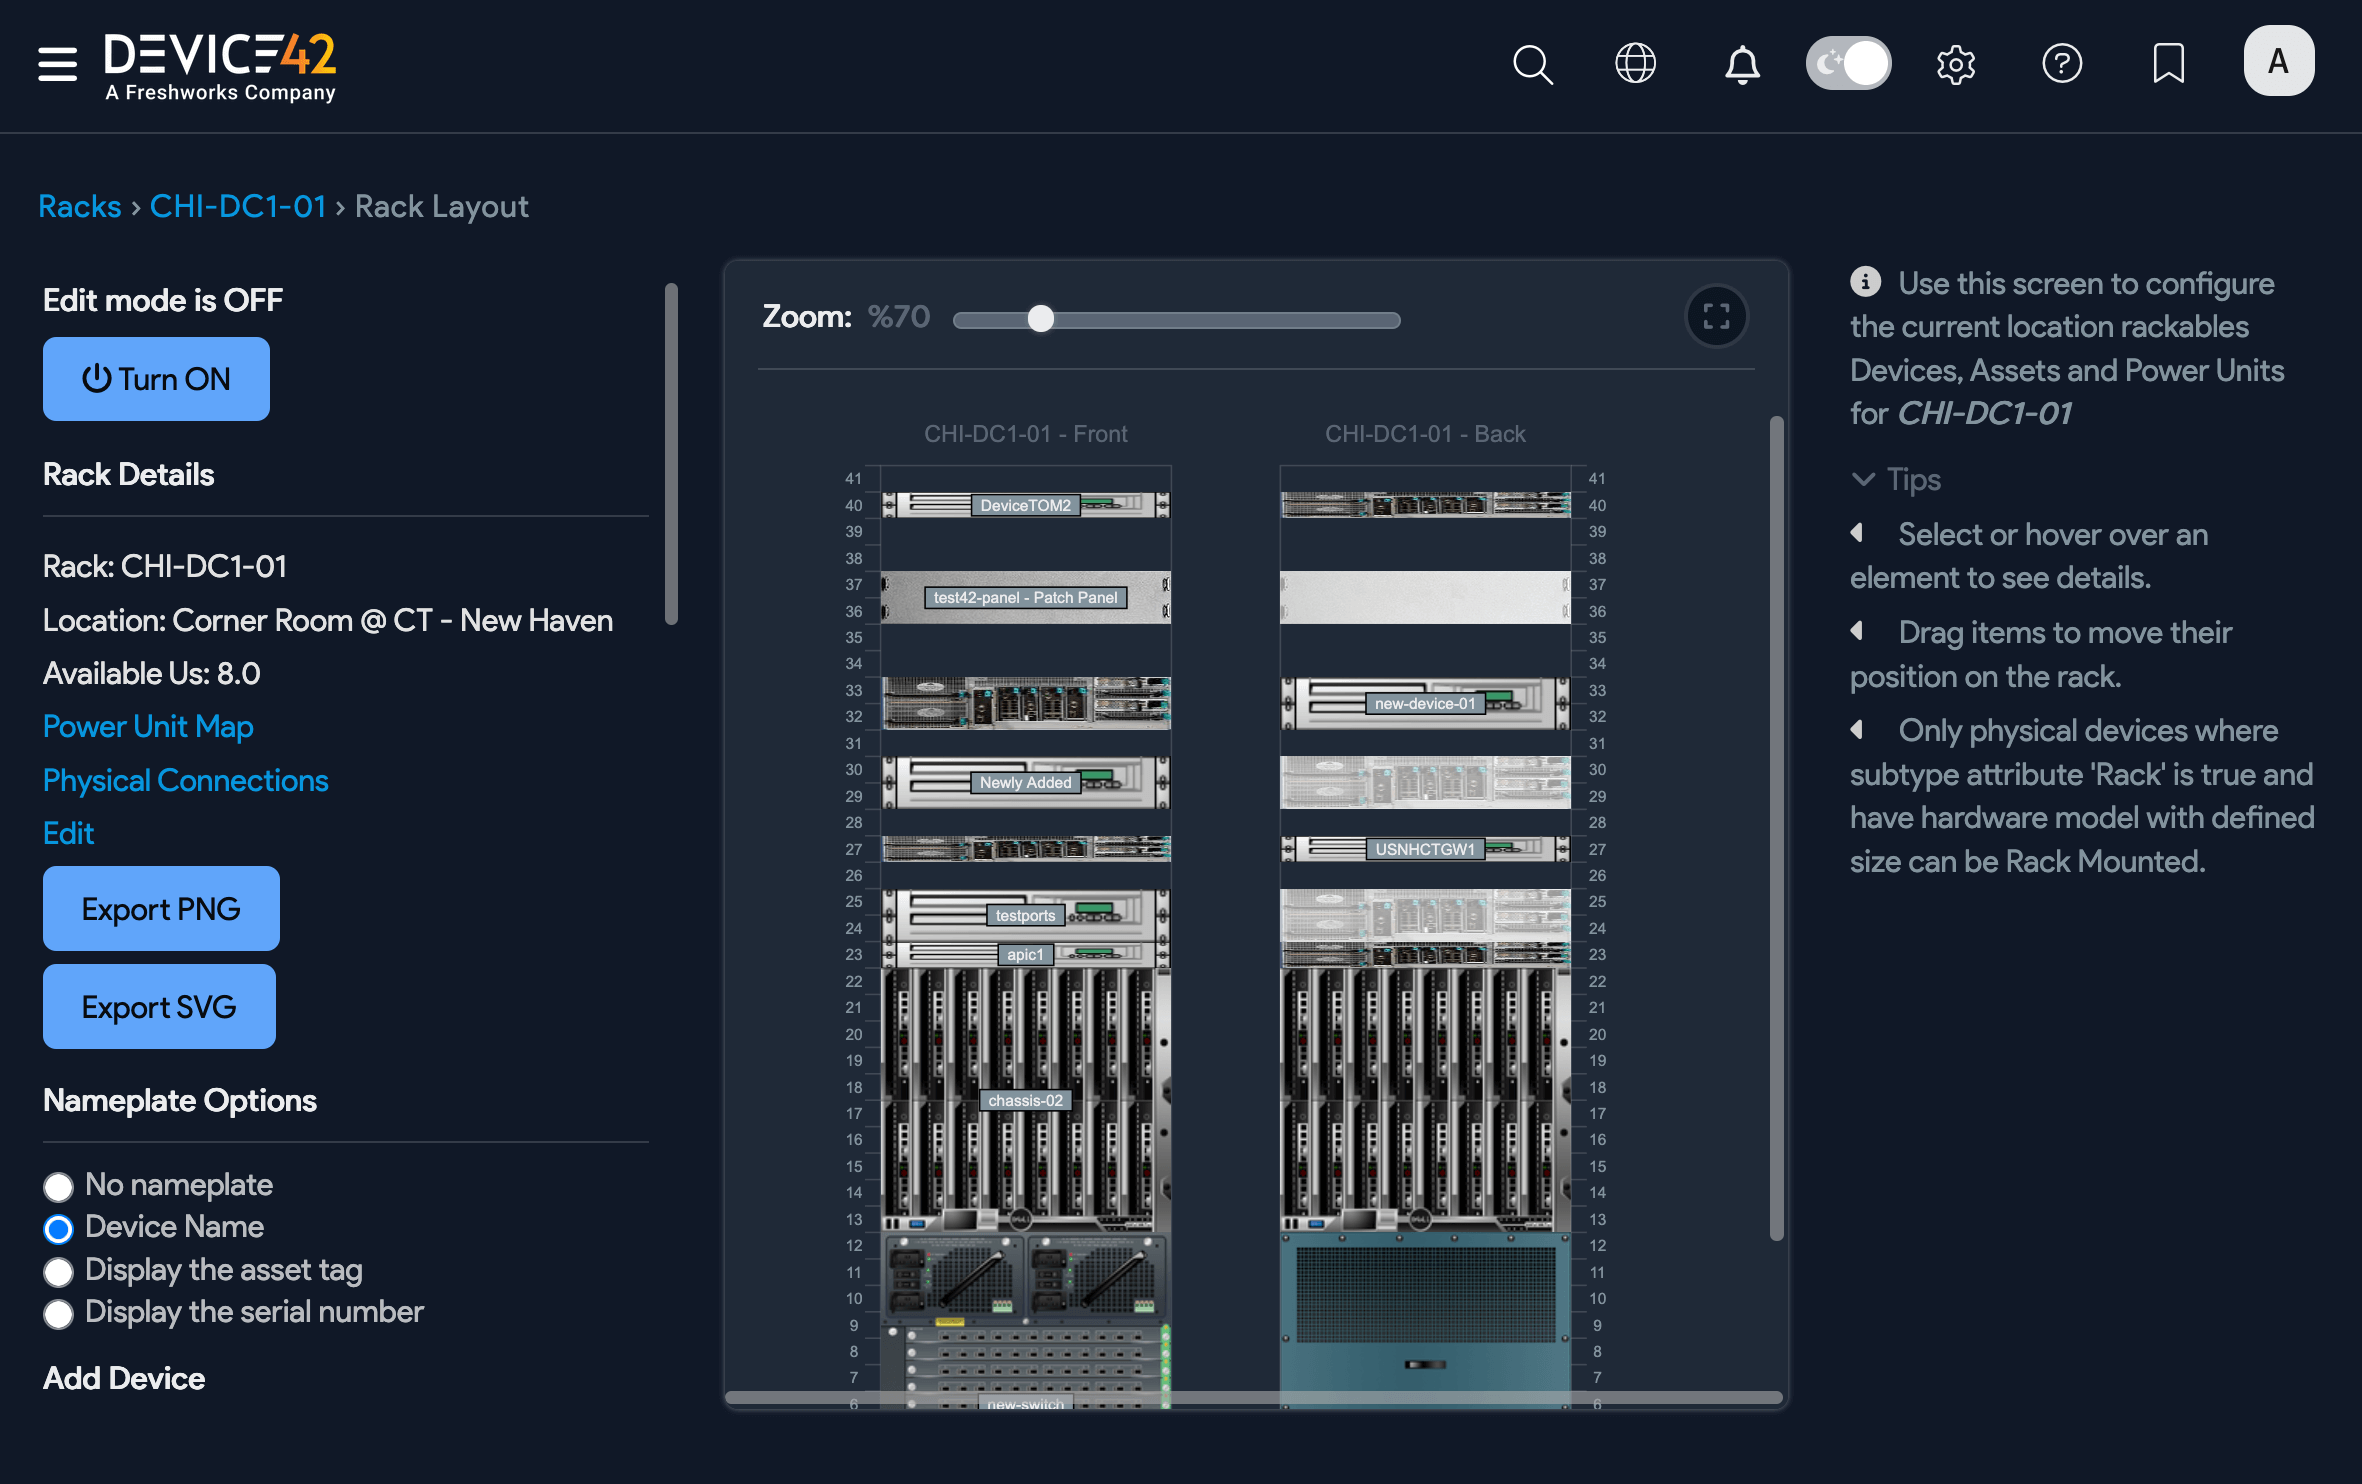
View [name] Layout: Click this link to drill down to a detailed visualization of the rack layout and the devices in the rack.
-
View [name] Power Unit Map:
-
View [name] details: Click this link to go to the Rack Details page for the rack.
-
Power/Utilization Charts: Click this link to display the power history for each input and output. Note that this link is only available if you have the Power Monitoring option.
-
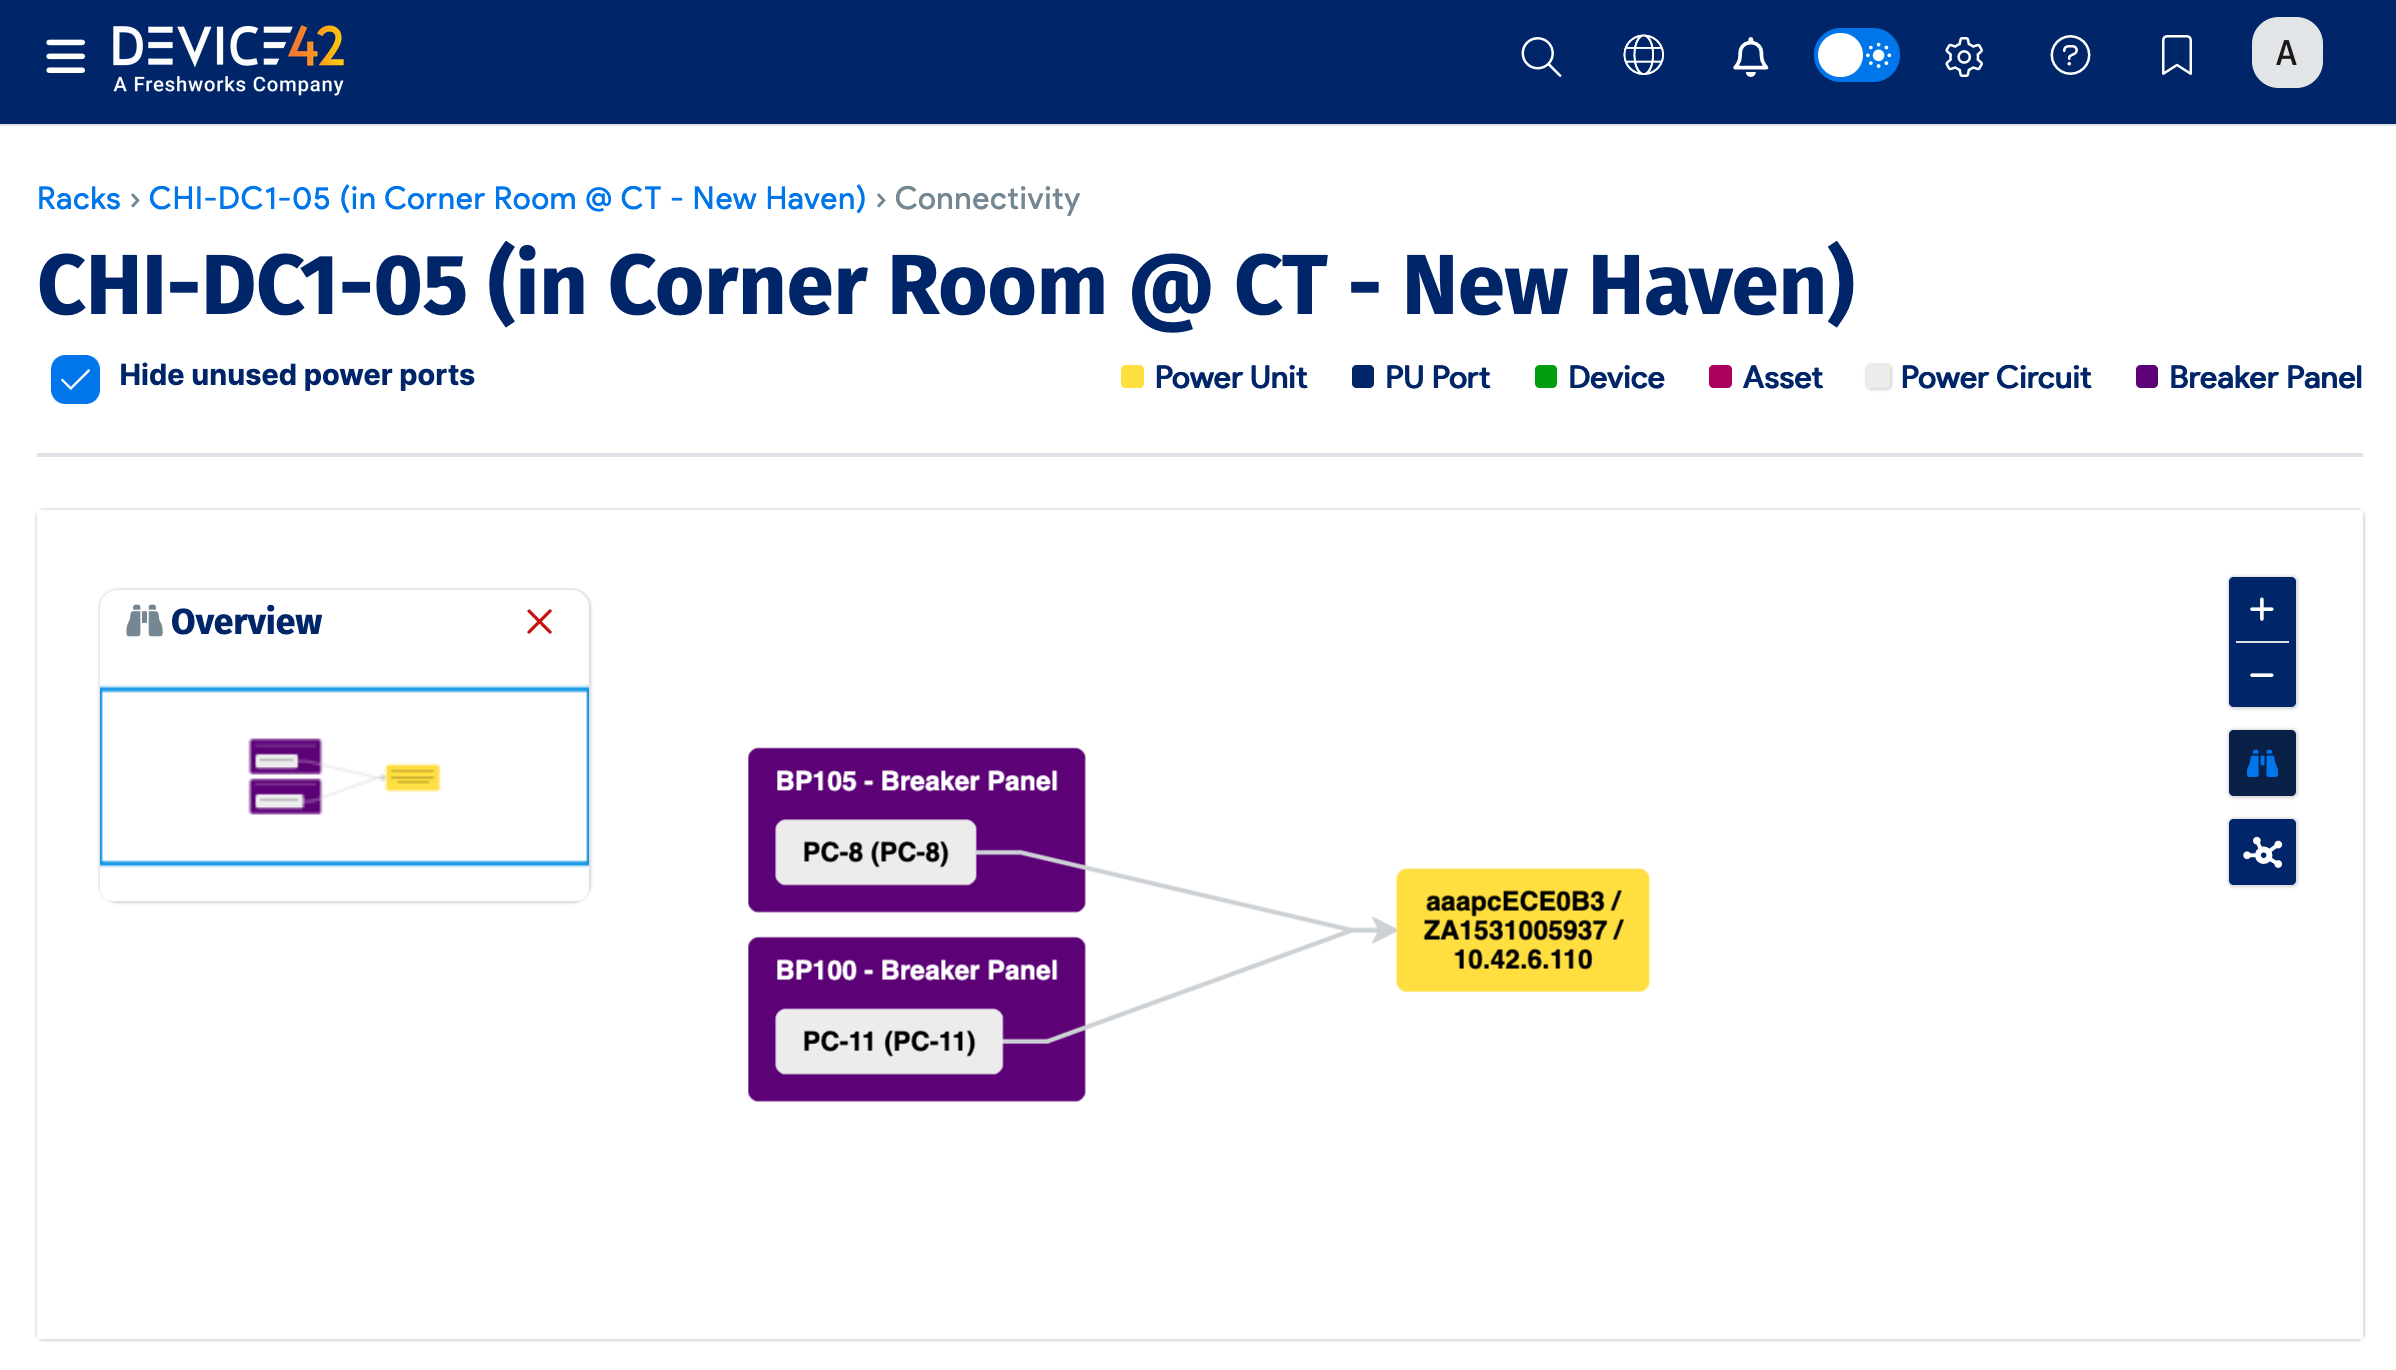
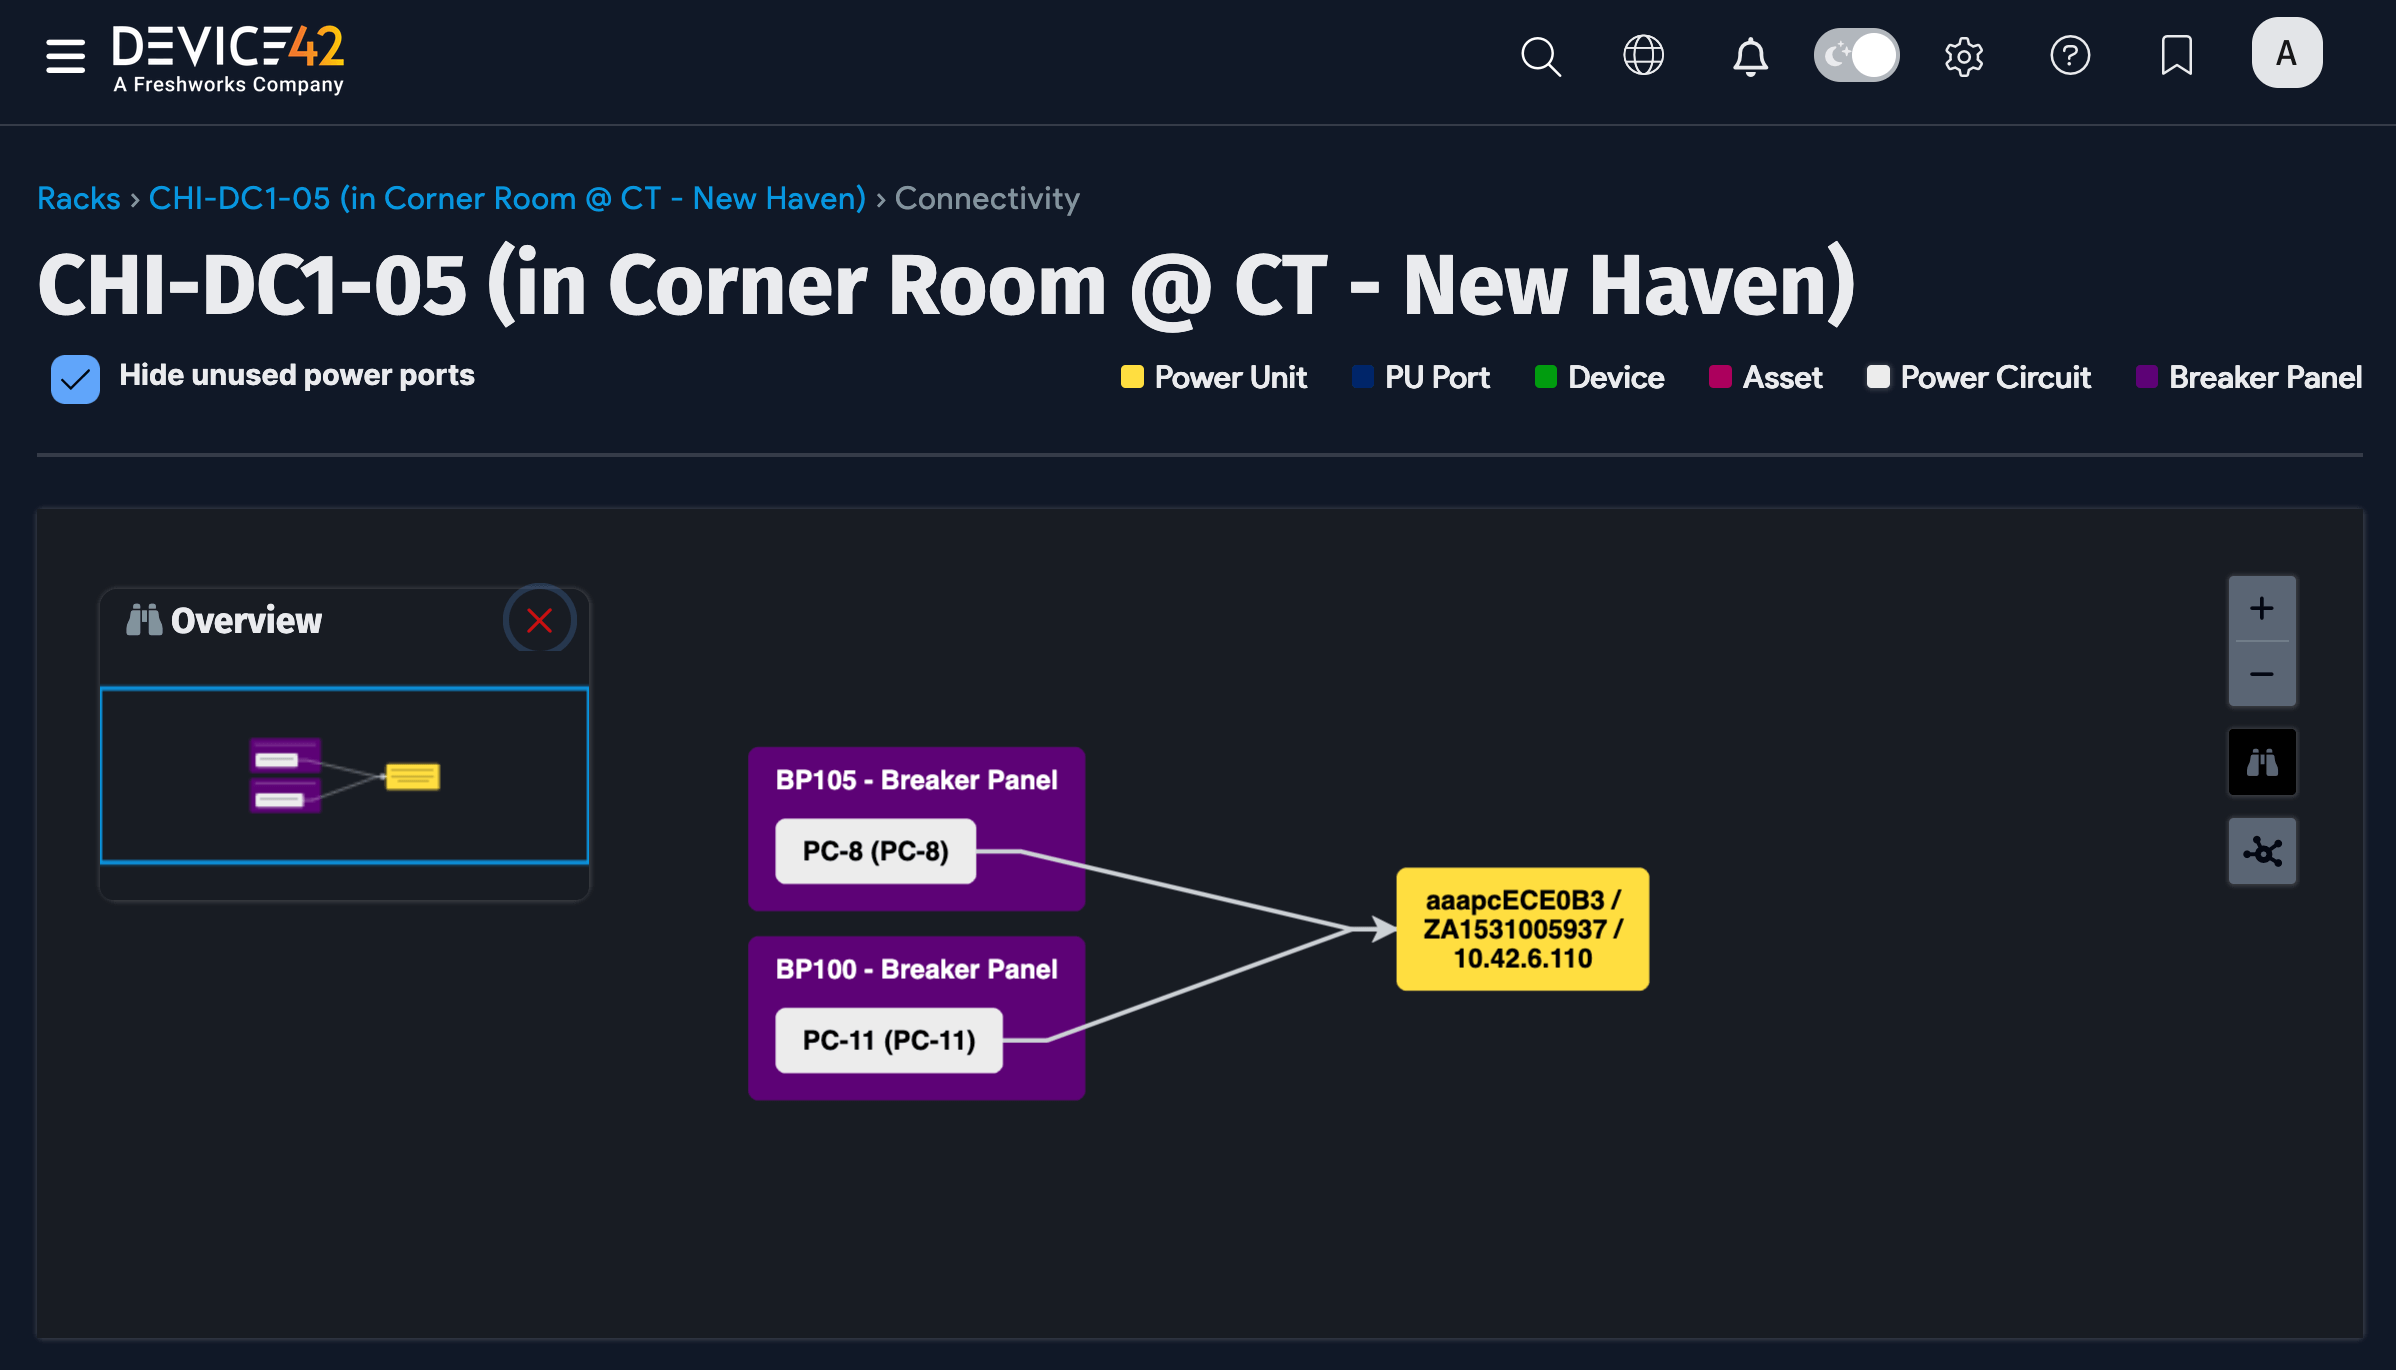
View Connections: Mouse over the rack displayed in the object popup panel to find this link. Click the link to display a visualization of the PDU connections in the rack.
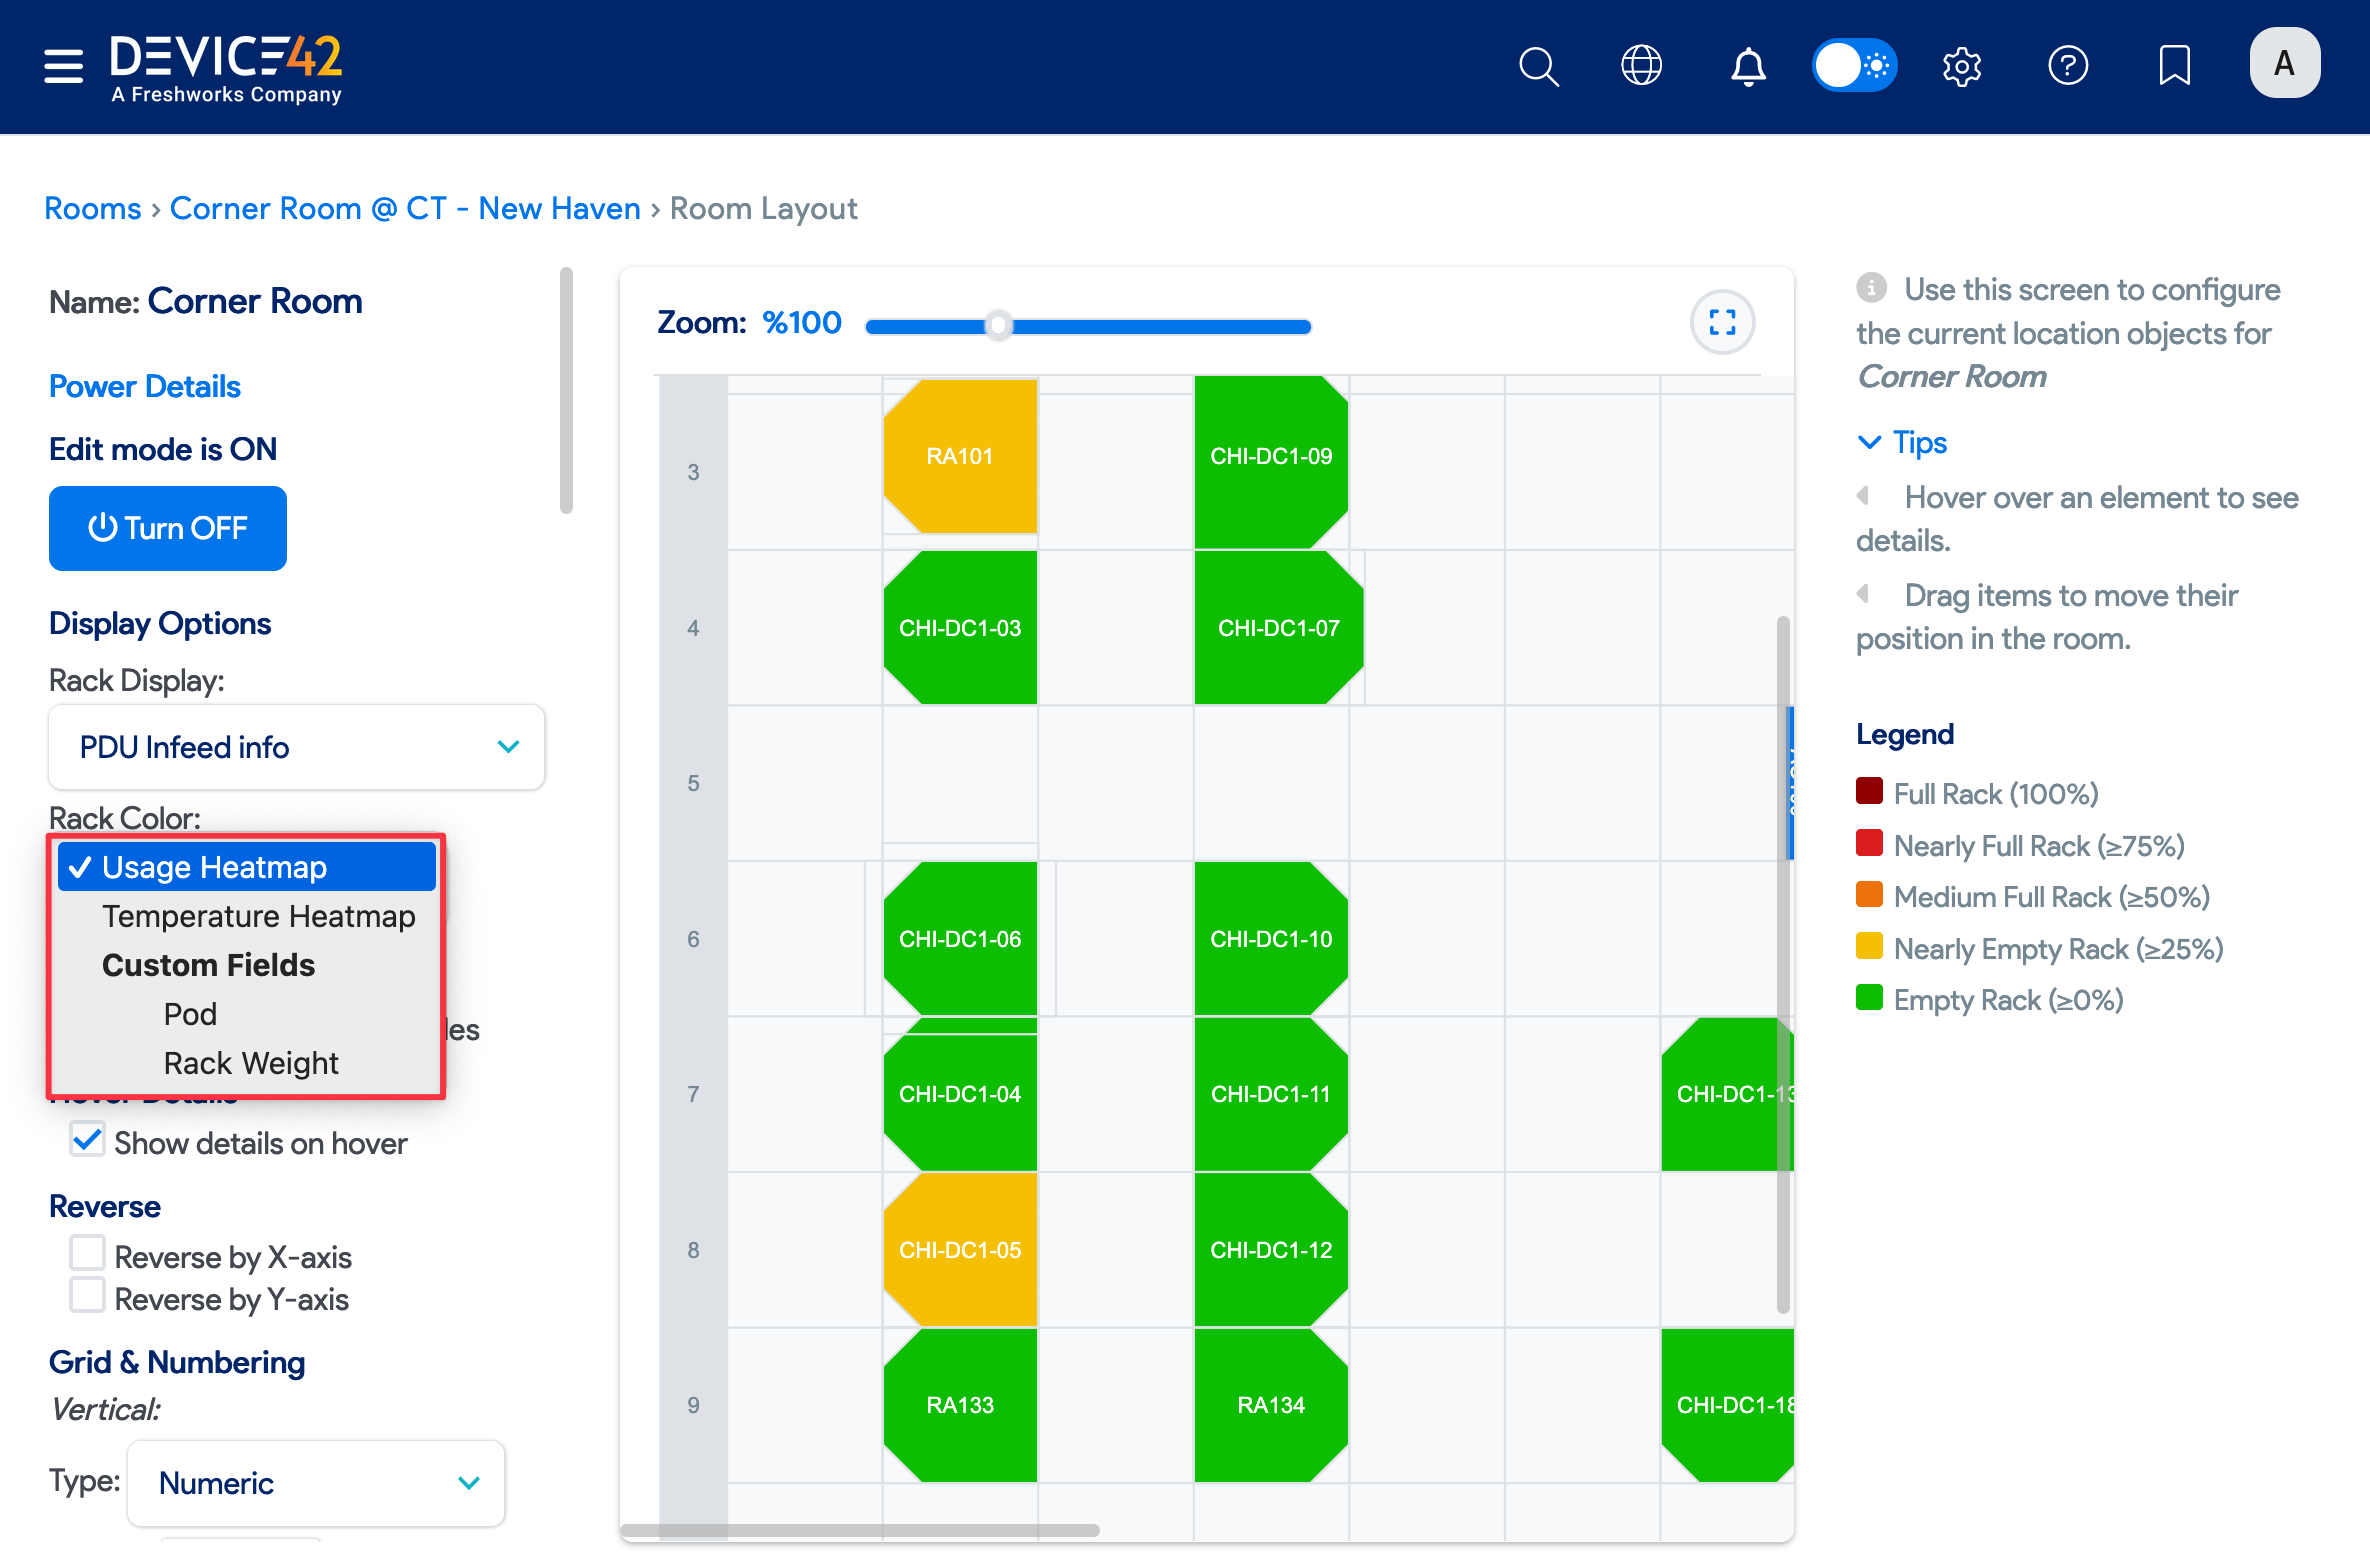
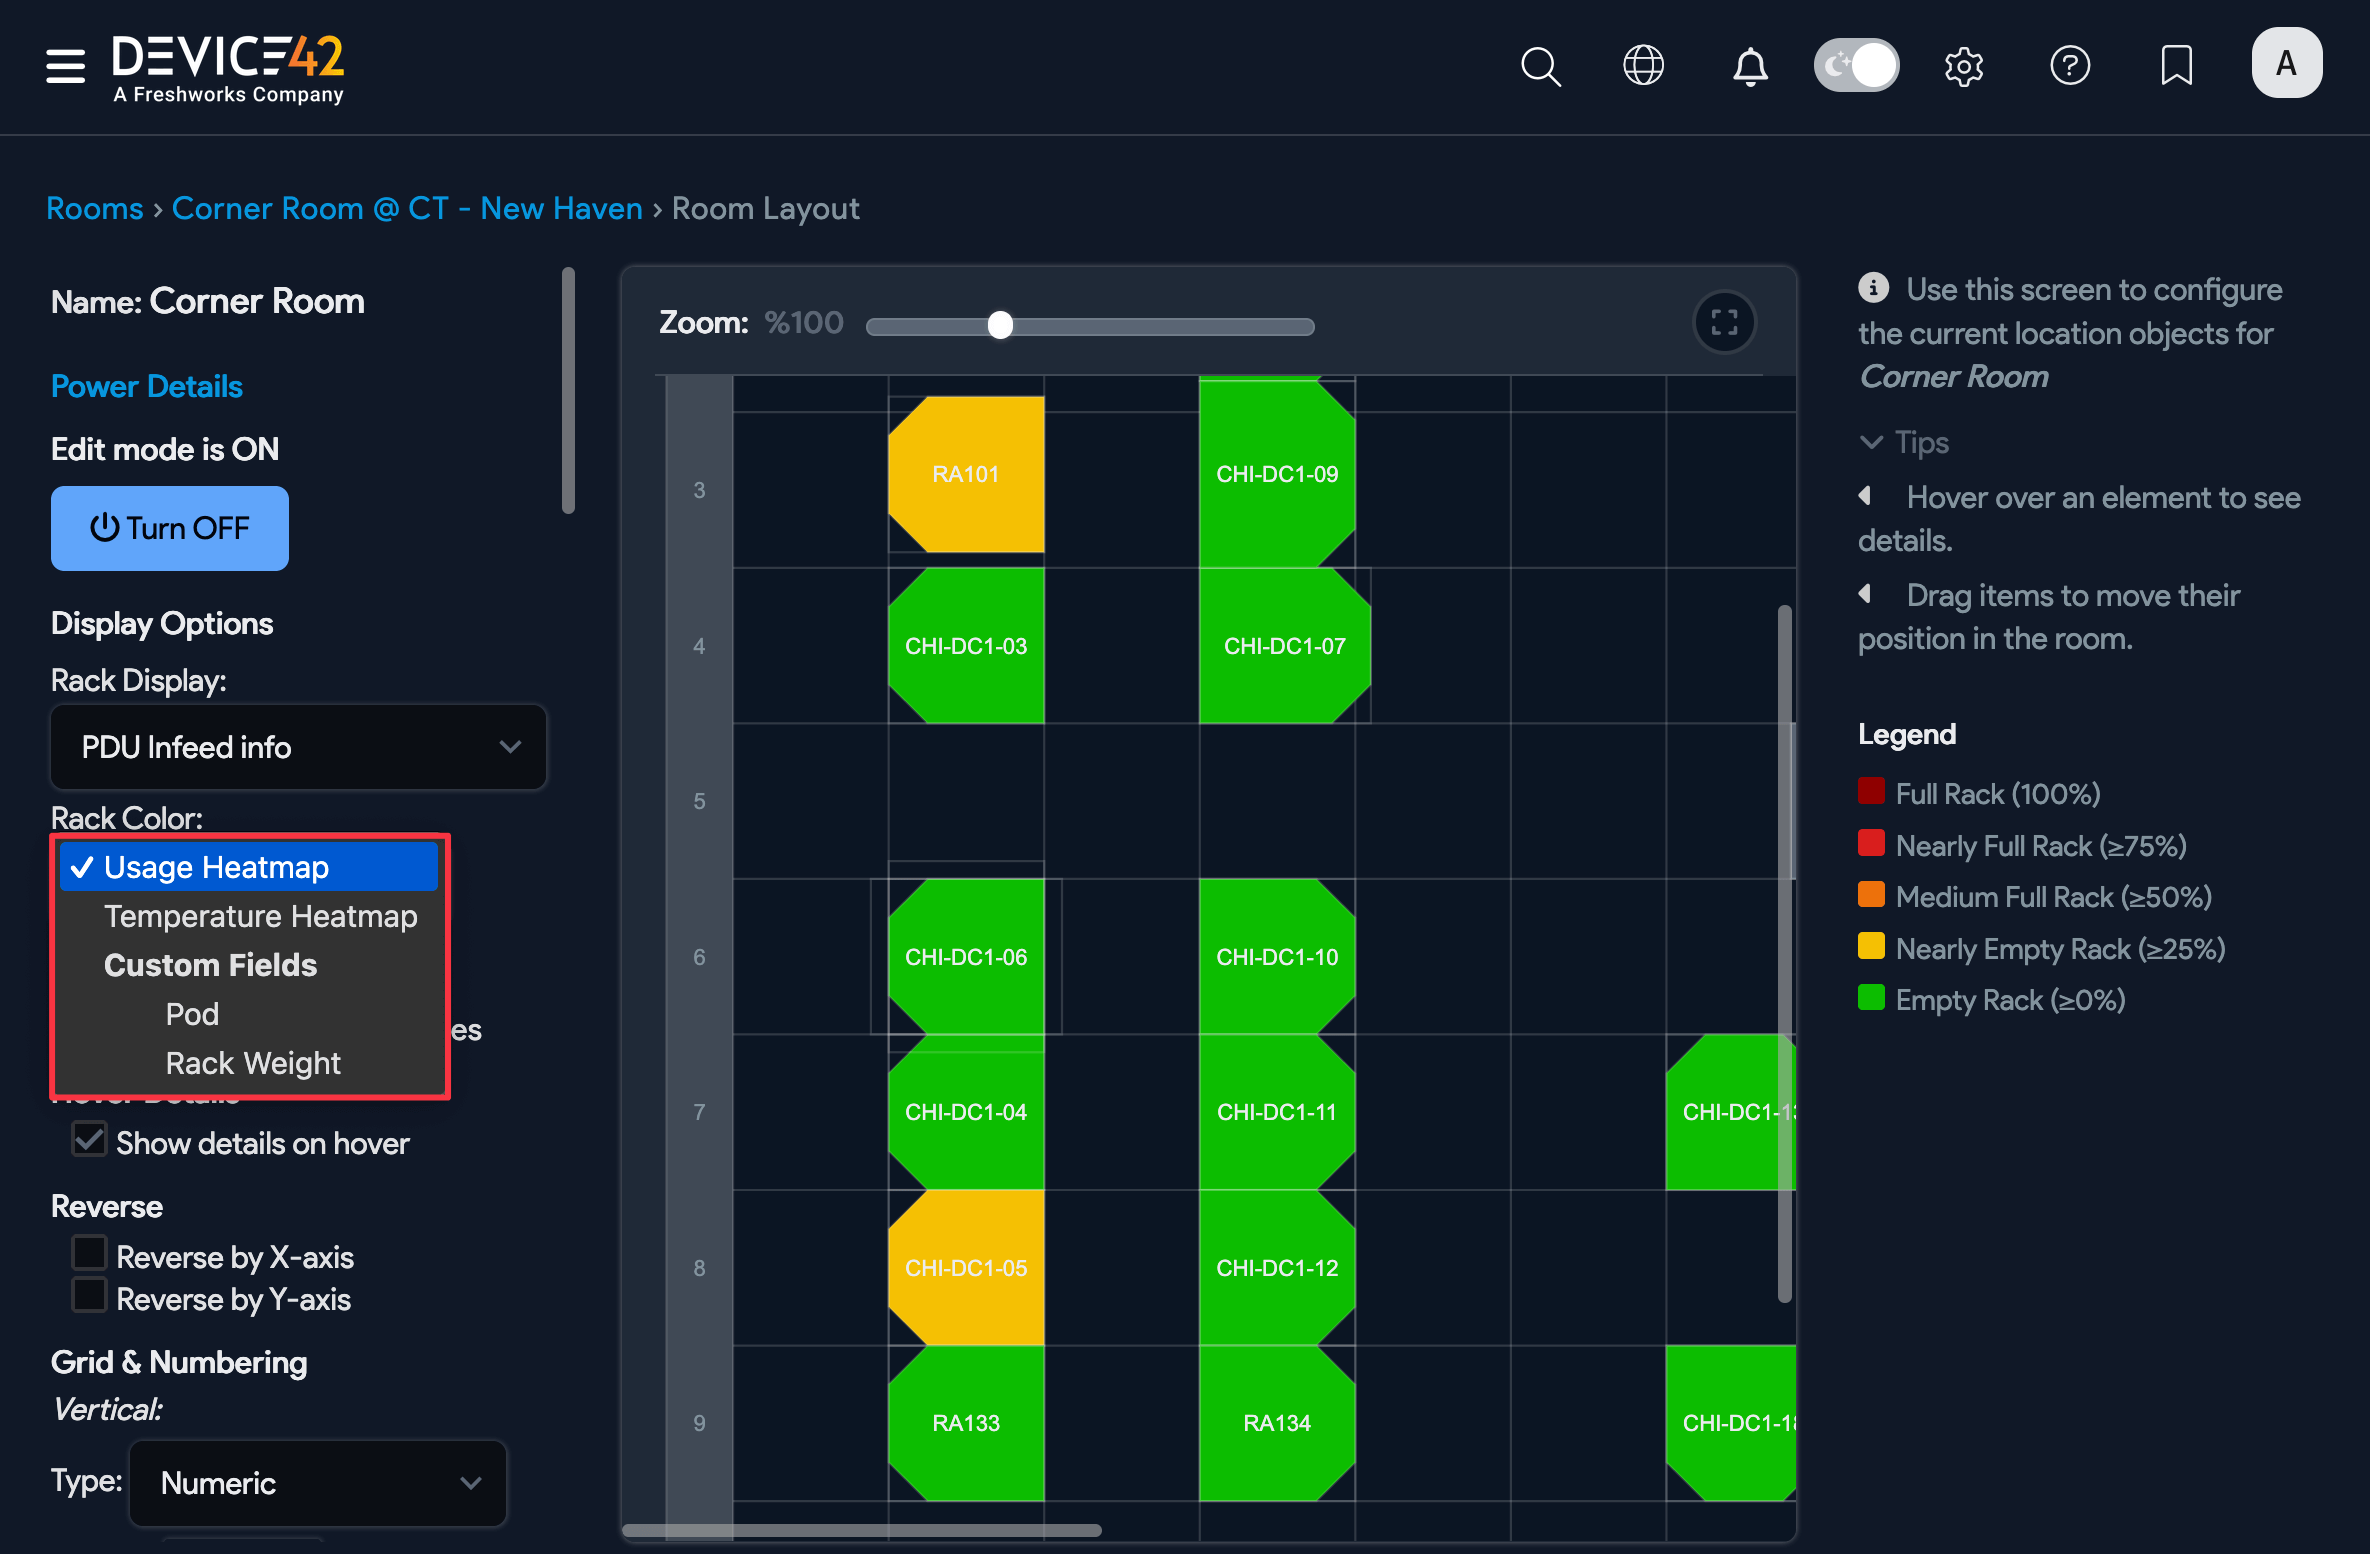
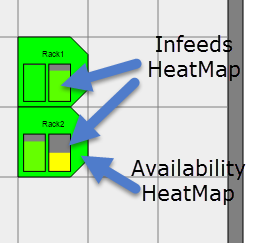
Heatmaps and Temperature Shading
You can set the object colors to denote usage or temperature information. Choose between the Usage Heatmap and Temperature Heatmap options under the Rack color menu. The legend on the right changes accordingly.
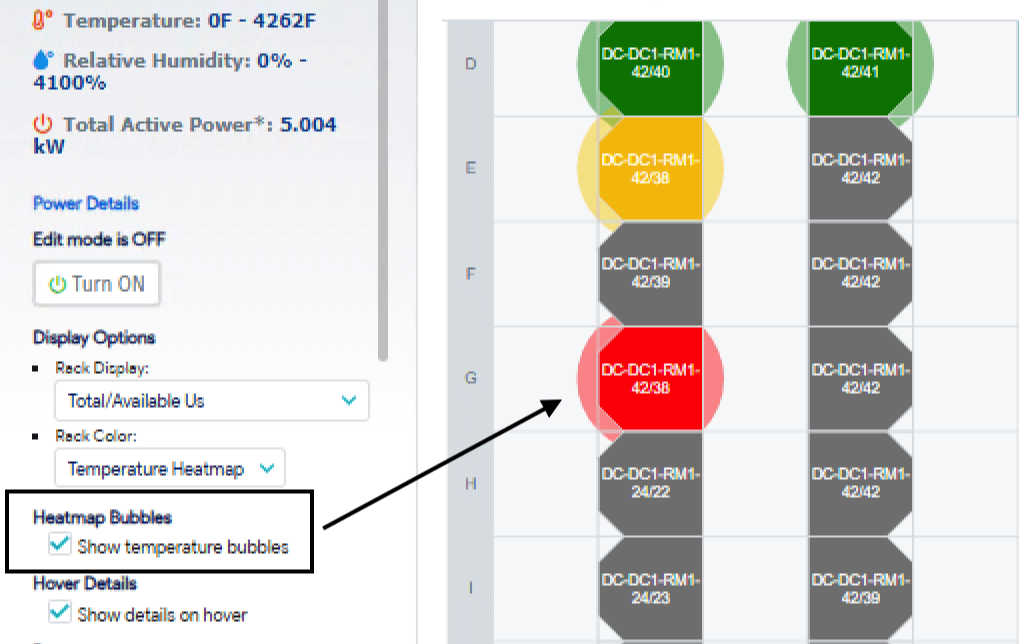
In addition, you can choose to Show temperature bubbles or turn it off.
These options are saved in cookies, so you don't have to reselect the combination of options that works best for you when revisiting the page.
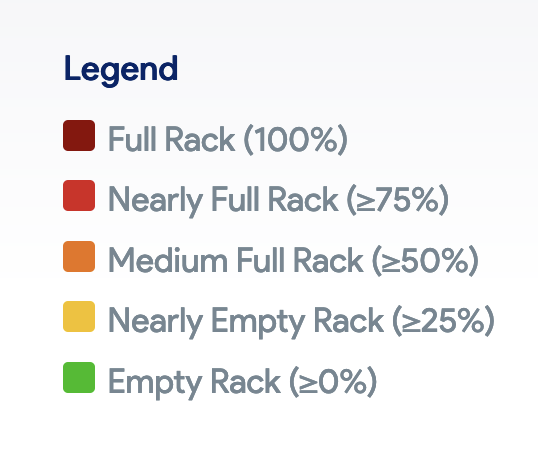
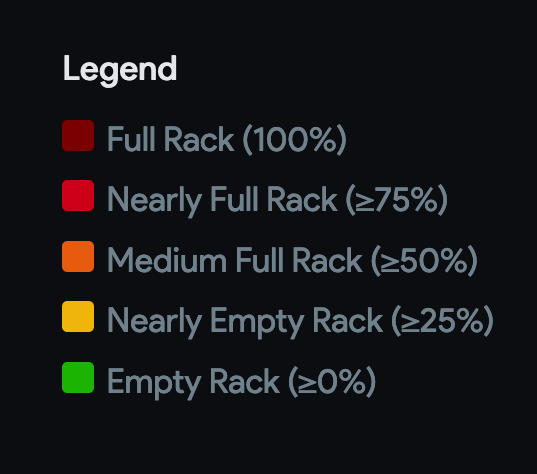
Usage Heatmap Legend
Each rack is color-coded to show the availability of U slots in the rack. Five color codes are available, ranging from green (high availability) to red (low availability). You can change the availability percentage for each color by going to Tools > Settings > Global Settings.
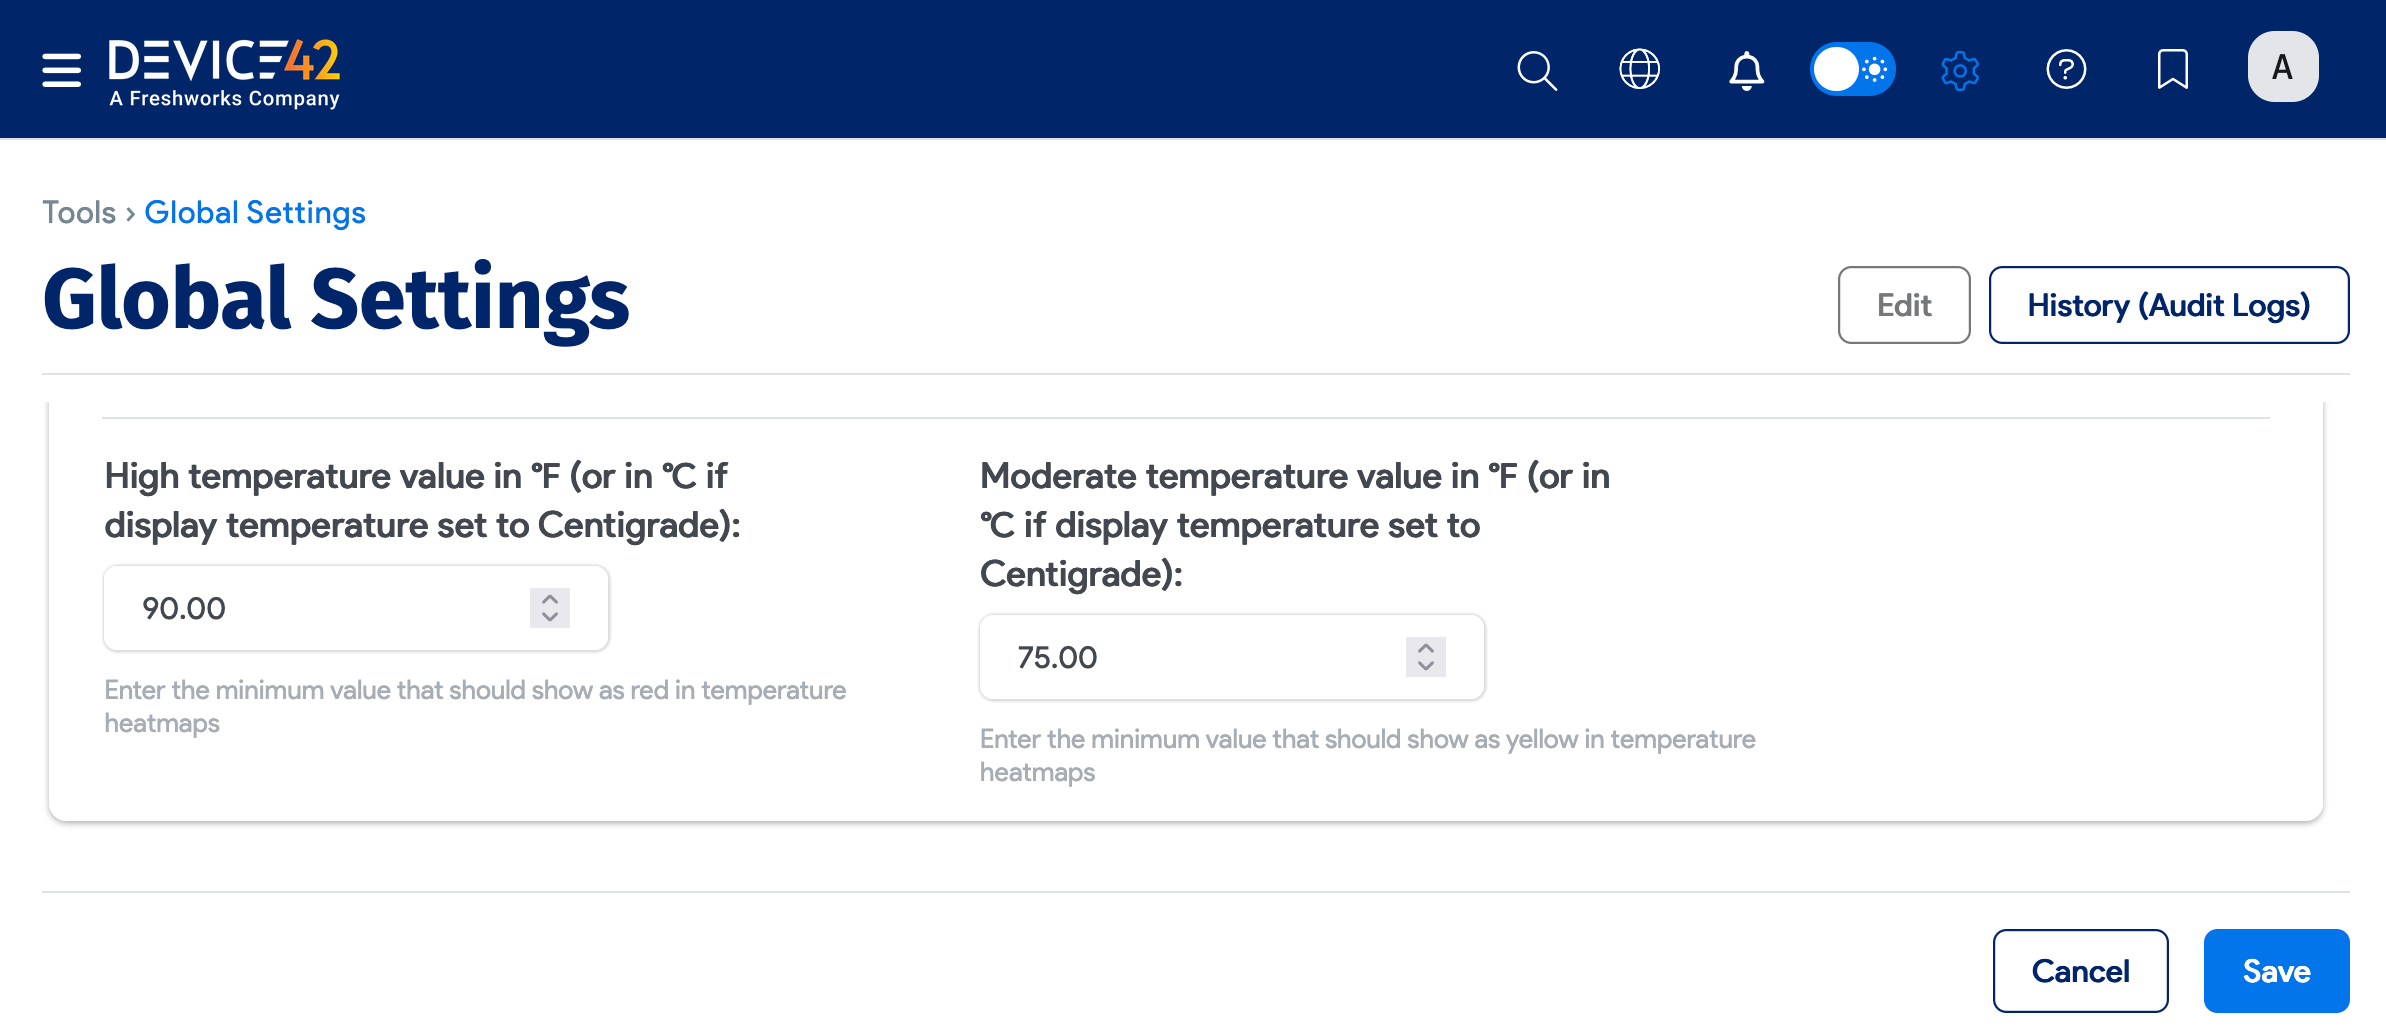
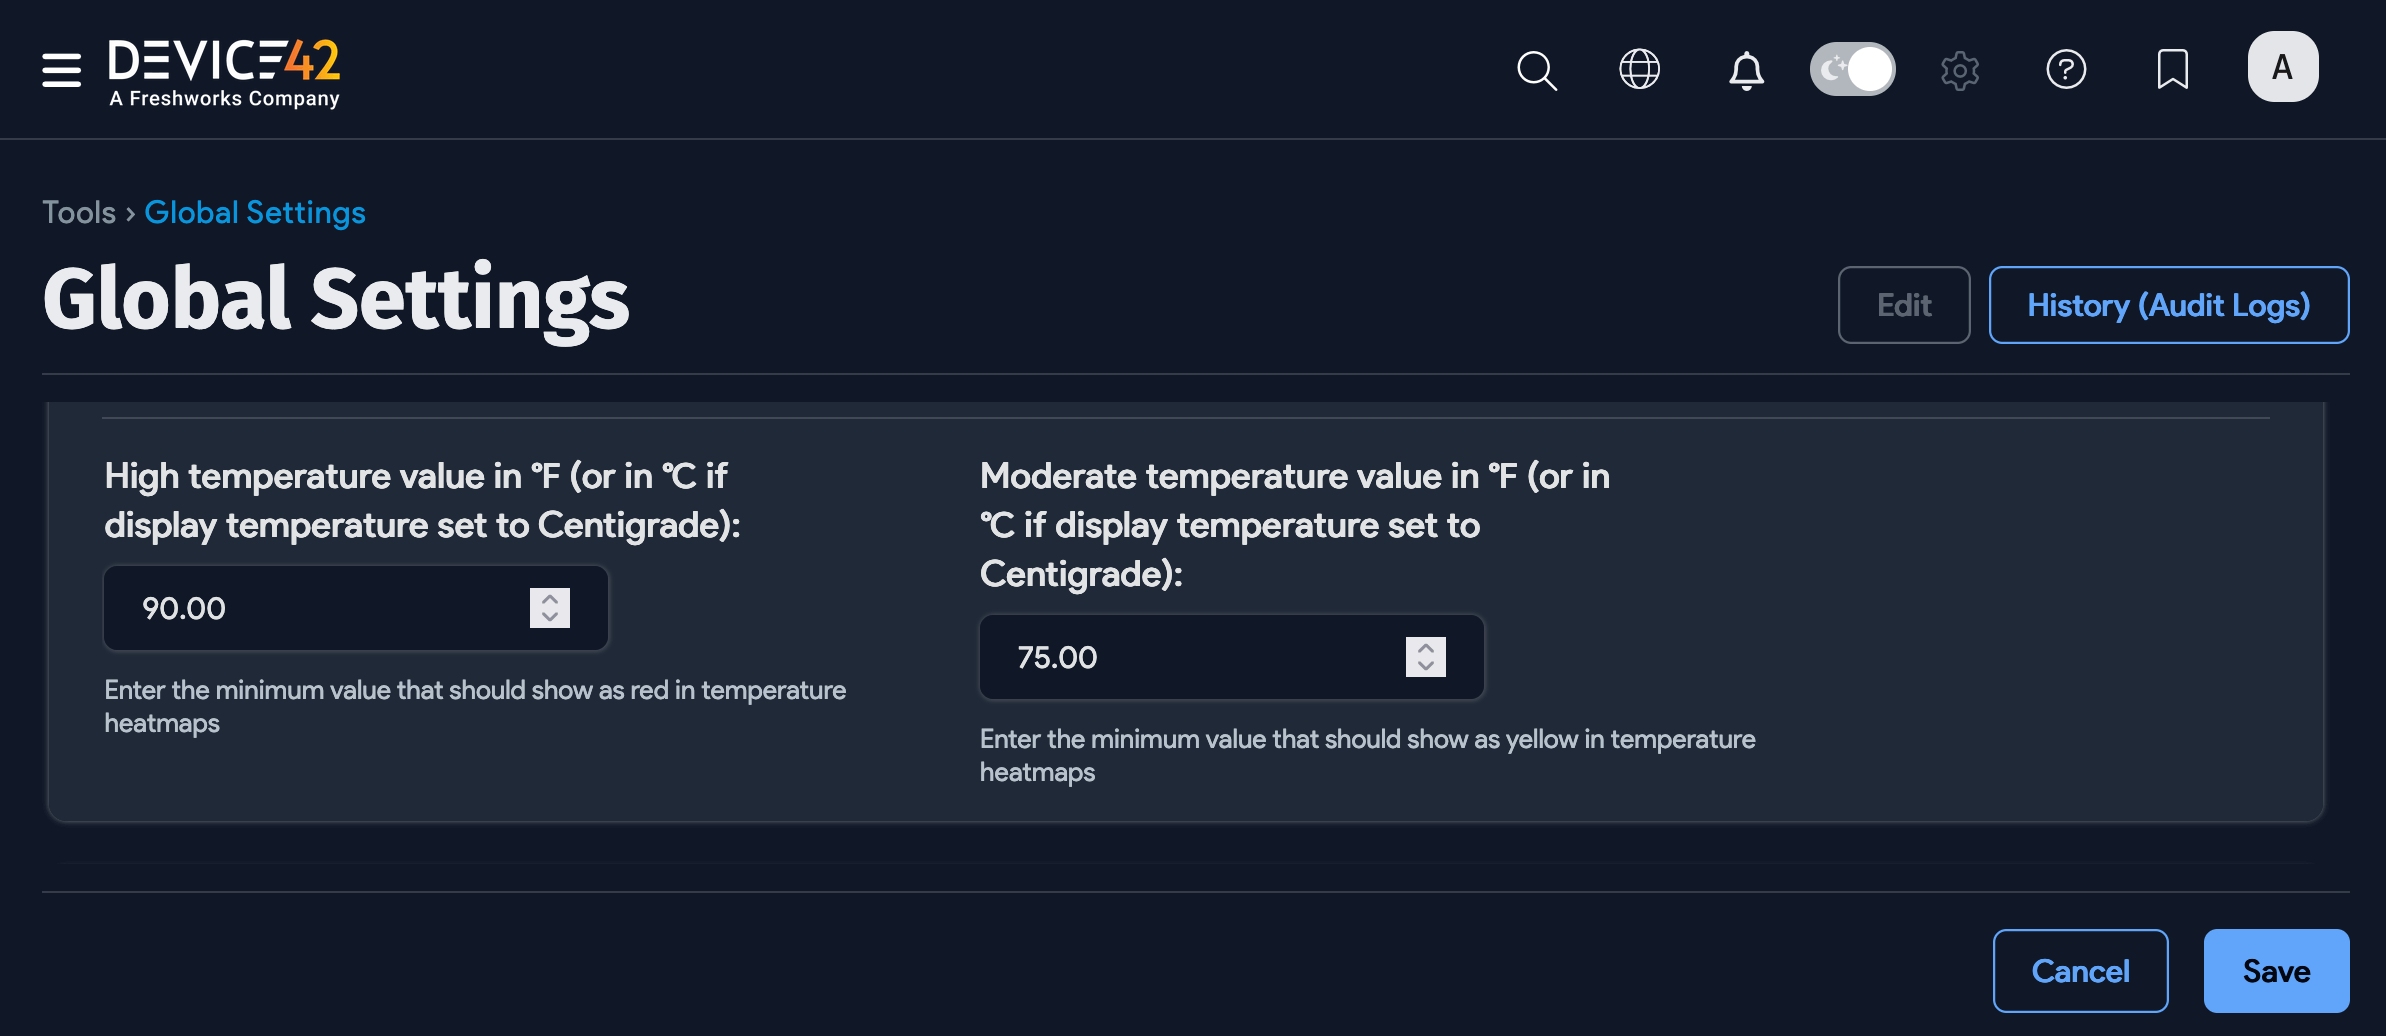
Temperature Heatmap Legend
In rooms that have temperature information, halo temperature shading around racks provides a quick view of the room's environment.
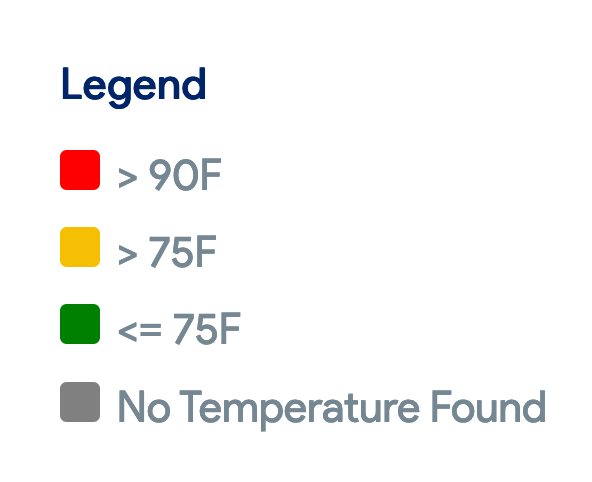
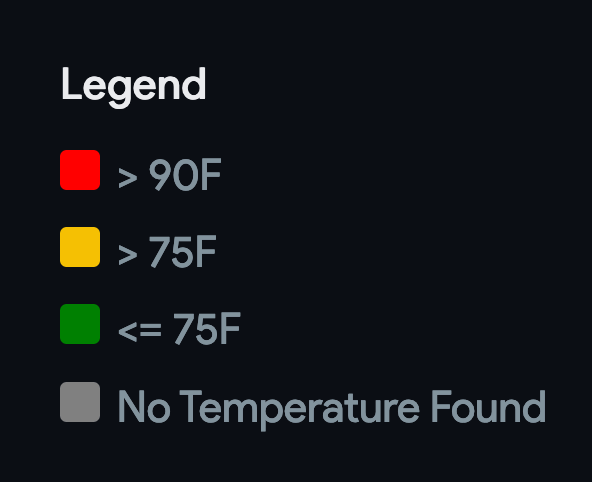
The default color value is based on the maximum temperature of the rack and corresponds to the following temperatures:
- Green: <= 75°F (23.88°C)
- Yellow: Between > 75°F (23.88°C) and <= 90°F (32.22°C)
- Red: > 90°F (32.22°C)
You can update the high and moderate temperature values from the Racks section under Tools > Settings > Global Settings. The room rack view updates accordingly.
PDU Power Monitoring
If you have the Power Monitoring option, you will see a rectangular bar for each input of every PDU in the rack. These bars are color-coded for power usage and represent the amount of power currently in use divided by the power capacity of the input. Green is high, and red is low. You can change the percentages in Tools > Settings > Global Settings.
Buildings and Rooms Actions
The following operations are available from the Actions dropdown menu on the Buildings and Rooms list pages:
-
Delete with Detailed Confirmation: View a list of all the objects that will be removed when you delete the selected buildings or rooms, like assets, devices, and racks.
-
Fast Background Delete: Delete the building or room without first viewing the list of affected objects.
-
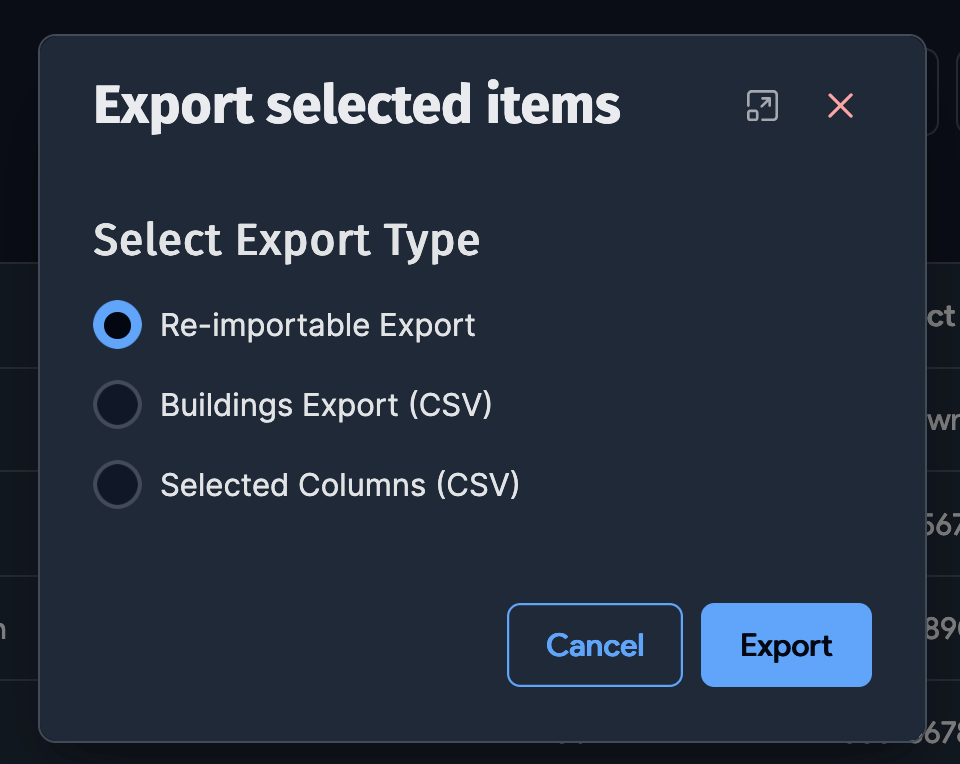
Export selected items: Open a window with the following export options:
-
Re-importable Export: Export the selected buildings in a
.xlsxspreadsheet to be re-imported into Device42. -
Buildings/Rooms Export (CSV): Export all data for the selected items in a CSV file.
-
Selected Columns (CSV): Export only the data from a reduced set of important columns (
ID,Address,Image,Contact_Name,Contact_Phone, andNotesfor buildings andID,Layout,Building,Available_Us, andNotesfor rooms) for the selected items in a CSV file.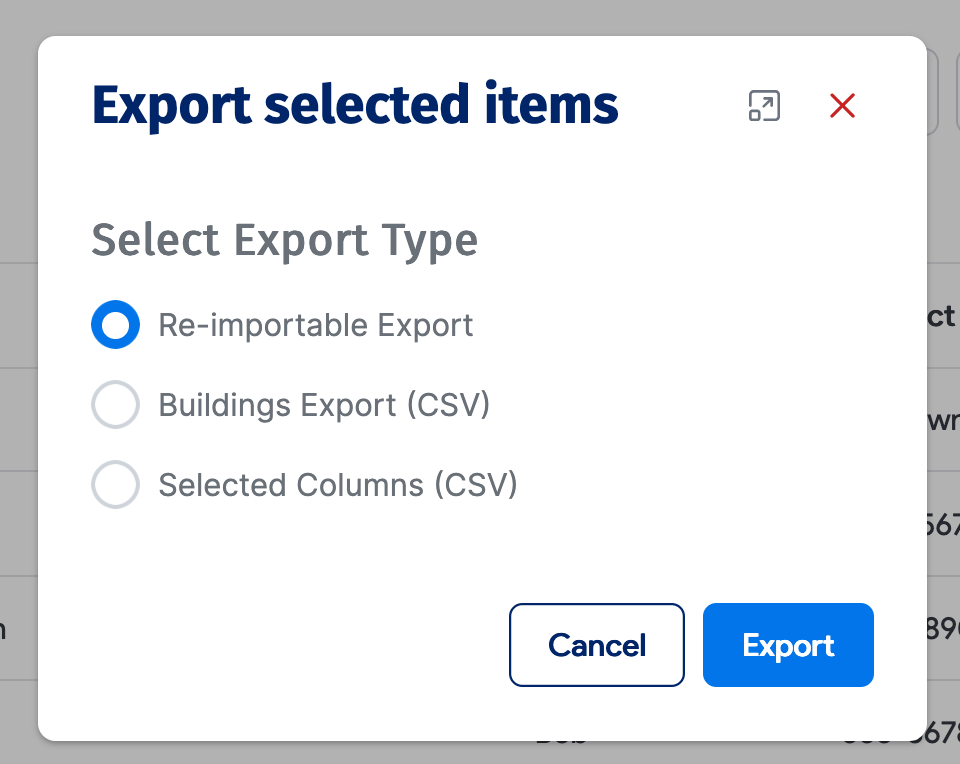
-
-
Add Groups: Select and add a permission group to the selected buildings or rooms.
-
Delete Groups: Select and remove a permission group from the selected buildings or rooms.
-
Set Custom Field Value: Add a populated custom field parameter to the selected buildings or rooms.